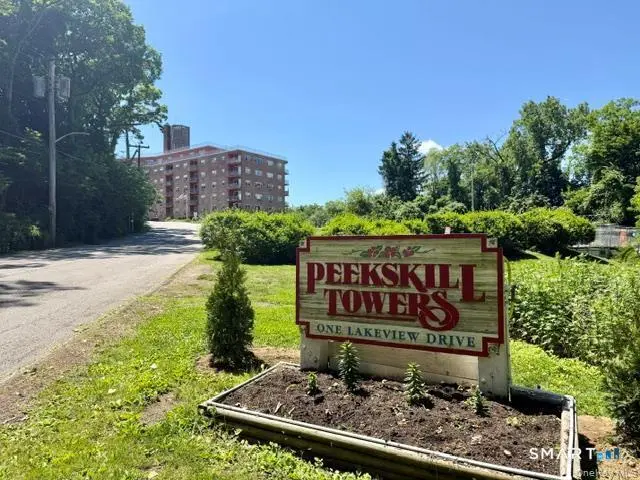
None · Peekskill, NY
Flood risk 1/10 · Minimal
- FEMA flood zone
- X (unshaded)
- Chance of flooding over 30 yrs
- 0.0%
- Est. flood insurance / yr
- $507 – $1,088
Fire risk 4/10 · Minor
- Est. fire insurance / yr
- $691 – $1,283
Heat risk 5/10 · Moderate
- Hot days now (above 99°F)
- 7 days/yr
- Hot days in 30 yrs
- 15 days/yr
Wind risk 4/10 · Minor
- Chance of severe wind over 30 yrs
- 19.0%
Air-quality risk 3/10 · Minor
- Unhealthy air days now
- 2 days/yr
- Unhealthy air days in 30 yrs
- 4 days/yr
Risk factors via First Street. Map © Google.
Why this score? — see what drove the D grade
The composite is a weighted blend of 9 inputs, each scored 0–100. Each bar is that input's sub-score; the figure is the points it added to the 100-point composite (weight × sub-score).
- 1% rule +10.0/10.0
- Cash flow +8.1/30.0
- ARV discount +7.5/15.0
- Livability +4.0/5.0
- Schools +3.5/10.0
- Rent growth +2.5/5.0
- Condition / age +2.5/5.0
- DSCR +2.1/10.0
- Appreciation +0.0/10.0
$145,000
🖨 Deal sheet (PDF) 📄 Offer letter ✓ Due diligence
Listing remarks MLS
Fabulous Opportunity to Own this Wonderful 1 Bedroom 1 Bath Co-op in Peekskill Towers! Walk in & Enjoy this Sunny Apartment with a Balcony! Great Size Living Room w/Slider to Covered Balcony, Sunny Kitchen, Separate Open Dining Area, Bedroom with WIC, Laundry in Building, Community Center & a Pool to Enjoy for Hot Summers!! Won't Last at this Price!!
Key facts
- Private balcony
- On-site parking
- Parking
Tags
Neighborhood map
What this means for you Summary
Snapshot
- This is a 1-bed/1.0-bath condo listed at $145k.
Deal economics
- At list price, monthly cash flow is $-142 ($-2k/yr) — negative.
- The deal already cash-flows at list — no discount required.
- Meets the 1% rule at list price ($2k rent vs $145k).
- Cap rate 5.1% vs local median 3.2% in Peekskill — top-decile yield for the area; either an underpriced asset or a hidden risk that comps aren't pricing in. Stress-test before assuming the spread holds.
Location & tenants
- Location reads 79/100 on livability (#132 in NY, #2,121 nationally) — a middle-class / working-renter tenant base. Strengths: commute A+, health & safety A+, crime A-; Watch: amenities F, cost of living F.
- Peekskill City School District (suburban): math 37% / reading 36% proficiency, ranked #670 of 755 in NY (top 89%) — families likely to look elsewhere, expect single-tenant / working-renter base with shorter leases; 64% free/reduced lunch — lower-income household profile, screen leases tightly.
- Zoned schools: Oakside School (515 students, 63% FRL) — zoned schools at 63% FRL track the district average.
- Market conditions: Rents flat; 117 active listings in the ZIP; 16 comparable units currently listed for rent nearby; rentals at typical pace (median 20d on market — plan ~3-4 weeks tenant-placement turnaround); solid renter incomes; 954 units permitted in Westchester County in 2024 (649 in 5+ unit buildings).
- This rent runs 32% of the median local income ($86k/yr) — at the standard rent-burdened threshold; future hikes will face affordability resistance.
Forward outlook
- Local home prices are declining (-3.0%/yr); year-one equity from $1k of loan paydown is wiped out by about $4k of value loss. Plan a longer hold.
- Westchester County population projected at +10% by 2050 — modest demand growth; plan on rents tracking national, not racing it.
Negotiation context
- Only 12 days on market — expect competitive offers; lowballing is unlikely to land.
- 7 sale attempts since 22y ago with the ask held roughly flat each time — persistent listings suggest the price (not the market) is what's stuck; bring a comps-based counter.
Risks & watch-outs
- Watch-outs: HOA is 42% of rent.
- Climate carrying-cost: extreme-heat days projected 7→15/yr by 2055 (HVAC capex compounding) — expect insurance premiums to compound above CPI over the hold.
Questions for the listing agent
- What do current leases actually rent for vs. the listed asking? Can we see a recent rent roll and the last 12 months of T-12 income?
- Built in 1965 — when were the roof, HVAC, electrical panel, plumbing, and water heater last replaced?
- What does the HOA fee cover, when was the last increase, and are there any pending special assessments or reserve-fund shortfalls?
- Any open or pending special assessments — roof, HVAC, plumbing, elevator, façade? What's the per-unit balance and payoff schedule, and is the seller paying it off at close or rolling it to the buyer?
- Is there a deadline driving the sale (1031 exchange, divorce, estate, relocation)? That informs how much negotiation room exists.
- The area grade is low — what's the realistic commute time and amenity access for the typical tenant pool here? Any planned neighborhood developments (good or bad) we should know about?
- What's the average days-on-market for RENTAL listings here right now (not sales)? A rising rental-DOM trend means longer vacancies and softer asking-rent achievability than the comps imply.
- What's the recent tenant-quality profile in this submarket — average credit score on applications, eviction rate, late-payment / NSF rate, and stable-employment percentage? A property-management company in the area should have these aggregated.
- How much new apartment / multifamily construction is in the pipeline within 1–3 miles? Heavy new supply (>2% of stock underway) typically softens rents 12–24 months out; light construction supports rent growth.
Investment metrics
- 1% rule
- 1.59% ✓
- Cap rate
- 5.11%
- Cash-on-cash
- -4.21%
- DSCR
- 0.81
- GRM
- 5.2
CMA / ARV
No comps found within radius.
Projected returns pro-forma
-3.0% appreciation · 0.12% rent growth · sell at horizon
- IRR
- -30.0%
- Equity multiple
- 0.05×
- Total profit
- $-38,432
- Equity at exit
- $21,620
- IRR
- -81.2%
- Equity multiple
- -0.67×
- Total profit
- $-67,750
- Equity at exit
- $12,537
Cash invested: $40,600 (down + closing). Projections, not guarantees.
Landlord ↔ Tenant lean methodology
- Overall (STATE)
- 15 Strongly Tenant-Friendly
- State New York
- 15 Strongly Tenant-Friendly · D+10
- County
- — inherits STATE
- City
- — inherits STATE
ZIP-level market 10566
- Home prices YoY
- -23.9%
- Rents YoY
- 0.1%
- Active inventory
- 117
- Price-to-rent
- 5.2×
Monthly cashflow live
- Estimated rent
- $2,305 high interval (Pro) →
- Mortgage (P&I)
- −$760
- Tax est. 1.5%
- −$181 /mo · $2,175/yr
- Insurance
- −$60
- HOA est. from 2 same-building comps
- −$961
- Vacancy / Maint / Mgmt
- −$484
- Net cashflow
- $-142
Break-even live
Sensitivity live
| Price | -10% $-42 | -5% $-92 | +0% $-142 | +5% $-192 | +10% $-243 |
|---|---|---|---|---|---|
| Rent | -10% $-324 | -5% $-233 | +0% $-142 | +5% $-51 | +10% $40 |
| Rate | -1.0pp $-69 | -0.5pp $-106 | base $-142 | +0.5pp $-180 | +1.0pp $-218 |
UW: 25.0% down · 7.5% · 30yr · 1.5% tax · 5.0% vac · 8.0% maint · 8.0% mgmt
Financing live
Cash to close
- Down payment
- $36,250
- Closing costs
- $4,350
- Reserves months
- —
- Total cash needed
- —
Loan-product check · same deal, 3 products live
Conventional
25% down · 7.5% · 30yr
- Down + closing
- —
- Monthly P&I
- —
- Monthly cashflow
- —
- DSCR
- —
- Eligible?
- —
Personal DTI + credit; lowest rate.
DSCR
20% down · 8.5% · 30yr
- Down + closing
- —
- Monthly P&I
- —
- Monthly cashflow
- —
- DSCR
- —
- Eligible?
- —
No personal income docs; deal must DSCR.
Hard money
10% down · 12.0% · 12mo
- Down + closing
- —
- Monthly P&I
- —
- Monthly cashflow
- —
- DSCR
- —
- Eligible?
- —
Short-term bridge; refi at stabilization.
Rent comps 16 comps
| Address | Beds | Baths | Sqft | Rent | $/sqft | DOM | Units | Dist |
|---|---|---|---|---|---|---|---|---|
| 2 Lakeview Dr Peekskill, NY | 1.0–2.0 | 1.0–1.5 | 875 | $2,299 | $2.63 | 0d | 3 | 0.11mi |
| 958 Phoenix Ave Peekskill, NY | 2.0 | 1.0 | 964 | $2,500 | $2.59 | 0d | 1 | 0.34mi |
| 305 Chateau Rive Peekskill, NY | 1.0 | 1.5 | 600 | $2,295 | $3.83 | 0d | 1 | 0.47mi |
| 207 Chateau Rive #207 Peekskill, NY | 1.0 | 1.0 | 600 | $2,295 | $3.83 | 20d | 1 | 0.48mi |
| 300 Highland Ave Unit 7 Peekskill, NY | 1.0 | 1.0 | 660 | $2,200 | $3.33 | 20d | 1 | 0.48mi |
| 304 Chateau Rive Unit 304 Peekskill, NY | 1.0 | 1.5 | 700 | $2,600 | $3.71 | 0d | 1 | 0.48mi |
| 8 N James St Unit D Peekskill, NY | 1.0 | 1.0 | 750 | $2,250 | $3.00 | 44d | 1 | 0.51mi |
| 1014 Main St Unit 1 Peekskill, NY | 2.0 | 1.0 | 1000 | $2,000 | $2.00 | 44d | 1 | 0.60mi |
| 1009 Brown St #1 Peekskill, NY | 1.0 | 1.0 | 800 | $2,450 | $3.06 | 44d | 1 | 0.71mi |
| 1009 Brown St #1 Peekskill, NY | 1.0 | 1.0 | 800 | $2,450 | $3.06 | 8d | 1 | 0.71mi |
| 209 S Division St Unit C Peekskill, NY | 2.0 | 1.0 | 720 | $2,200 | $3.06 | 21d | 1 | 0.74mi |
| 119 High St Unit 3 Peekskill, NY | 1.0 | 1.0 | 582 | $1,975 | $3.39 | 16d | 1 | 0.78mi |
| 1108 Brown St Peekskill, NY | 3.0 | 1.0–2.0 | 852 | $2,574 | $3.02 | 0d | 5 | 0.81mi |
| 320 Simpson Pl Peekskill, NY | 2.0 | 1.0 | 1100 | $3,000 | $2.73 | 4d | 1 | 1.02mi |
| 1701 Crompond Rd #4403 Peekskill, NY | 2.0 | 2.0 | 1000 | $2,600 | $2.60 | 20d | 1 | 1.23mi |
| 5307 Villa At the Woods Peekskill, NY | 1.0 | 1.0 | 550 | $2,000 | $3.64 | 44d | 1 | 1.35mi |
HOA detail condo
- Monthly dues
- $0 · $0/yr
- Likely covers
- pool
- Assessments
- None detected in remarks — confirm with the listing agent.
Listing history 8 events
-
2026-06-21days on market $145,000 Active 12 DOM
-
2026-06-18days on market $145,000 Active 9 DOM
-
2026-06-17days on market $145,000 Active 8 DOM
-
2026-06-16days on market $145,000 Active 7 DOM
-
2026-06-15days on market $145,000 Active 6 DOM
-
2026-06-13days on market $145,000 Active 4 DOM
-
2026-06-10remarks 699-char remark
-
2026-06-10$145,000 Active 1 DOM
ⓘ Source: listings_history table (triggers on properties + properties_extension) + one-shot
backfill from property_details.listing_events for pre-trigger history.
Climate risk First Street
- Flood 1/10 Low FEMA zone X (unshaded) · 0% chance over 30 yrs
- Wildfire 4/10 Moderate
- Heat 5/10 Major 7 d/yr ≥99°F today · 15 d/yr by 30 yrs out
- Wind 4/10 Moderate 19% chance of damaging wind over 30 yrs
- Air quality 3/10 Moderate 2 unhealthy d/yr today · 4 by 30 yrs out
Nearby sold comps map
Loading sold comps map…
Walkable amenities ~0.75 mi
Loading nearby amenities…
Taxation est. · year 1
- Rental income
- $27,656
- − Mortgage interest
- −$8,122
- − Property taxes
- −$2,175
- − Insurance
- −$725
- − Repairs & maintenance
- −$2,212
- − Management
- −$2,212
- − HOA
- −$11,532
- − Depreciation
- −$4,218
- Taxable loss
- −$3,542
- Est. tax savings @ 24.0%
- +$850
- After-tax cash flow
- $-859/yr
For passive investors: Depreciation is non-cash, so a rental often shows a tax loss while cash-flowing — sheltering income. Rental losses are passive: they offset passive income freely, and up to $25,000/yr can offset ordinary (W-2) income if you actively participate and your MAGI is under $100k (phasing out to $0 by $150k); unused losses carry forward. On sale, claimed depreciation is recaptured at up to 25%, and gains may owe capital-gains tax (a 1031 exchange can defer both). Figures are a year-1 estimate at your 24.0% rate — not tax advice; consult a CPA.
Schools (NCES district)
- District
- Peekskill City School District
- NCES district ID
- 3622650
- Math proficiency
- 37% ▲ 4.00%
- Reading proficiency
- 36% ▲ 4.00%
- Median HH income
- $54,563
- Composite
- 34.6/100
- National rank
- #10089
- State rank
- #670 of 755 in NY
Livability — Peekskill
- Score
- 79/100
- State rank
- #132
- US rank
- #2121
Category grades
Schools grade is shown separately in the Schools card above.
Census & demographics
- Census place
- Peekskill, NY
- County
- Westchester County · 709,332 people
- City population
- 25,625
- Metro
- New York-Newark-Jersey City, NY-NJ-PA
- Population (ZIP)
- 25,625
- Household income
- $85,954
- Rent vs Own
- Severe rent burden
- 1507.0
Population outlook (Westchester County) Hauer SSP2
- Today (2025)
- 1,028,035 people
- By 2030
- 1,051,636 · +2.3%
- By 2040
- 1,098,520 · +6.9%
- By 2050
- 1,136,044 · +10.5%
- By 2075
- 1,196,925 · +16.4%
- By 2100
- 1,175,147 · +14.3%
Race, ethnicity, and origin ACS 2023
- Neighborhood character
- Diverse neighborhood (Simpson 0.65)
- Race & ethnicity
- Hispanic / Latino 46% White 32% Black 17% Two or more races 14% Native American 2% Asian 2%
- Hispanic origin (detail)
- Mexican 1% Puerto Rican 10% Cuban 3% Dominican 4%
- Common ancestry
- Romanian 2% Lithuanian 1% Slovak 1%
- Foreign-born
- 27% · Canada
- Languages at home
- 57% English-only · Spanish 37% Other Indo-European 2% French/Haitian/Cajun 1%
Political lean MEDSL · Westchester
- 2024 margin
- Strong D (+26.3) · D 63.1% · R 36.9%
- 2008→2024 swing
- -1.3pp toward R · 2008: 27.6pp · 2024: 26.3pp
- All cycles
- 2024: D+26.3 2020: D+36.3 2016: D+32.8 2012: D+22.2 2008: D+27.6
Not yet ingested
- Civics
- —
Market trends
- HPI YoY
- ▼ -96.67%
- Current HPI
- 307.944
- Rent YoY
- ▲ 0.12%
- Metro
- New York-Newark-Jersey City, NY-NJ-PA
- State GDP YoY
- ▲ 2.60%
- F500 in state
- 92
Industry mix (Fortune 500 HQ in NY)
| Industry | F500 HQs | Revenue |
|---|---|---|
| Financial Services | 10 | $950B |
|
||
| Consumer Goods | 9 | $162B |
|
||
| Insurance | 4 | $225B |
|
||
| Telecommunications | 2 | $144B |
|
||
| Pharmaceuticals | 2 | $112B |
|
||
| Media / Entertainment | 2 | $69B |
|
||
Price history
+22.5% since first listed19 events — show timeline
- 2026-06-09 Listed $145,000 Smart MLS
- 2024-09-30 Sold (MLS) $132,500 OneKey® MLS as Distributed by MLS Grid
- 2024-07-25 Pending — OneKey® MLS as Distributed by MLS Grid
- 2024-07-14 Listed $132,500 OneKey® MLS as Distributed by MLS Grid
- 2024-07-10 Coming Soon $132,500 OneKey® MLS as Distributed by MLS Grid
- 2022-10-06 Listed $115,000 OneKey® MLS as Distributed by MLS Grid
- 2014-03-15 Price Changed $65,000 HGMLS
- 2013-09-23 Sold (MLS) $65,000 OneKey® MLS as Distributed by MLS Grid
- 2013-09-23 Sold (MLS) $65,000 HGMLS
- 2013-08-10 Delisted — HGMLS
- 2013-08-05 Contingent — HGMLS
- 2013-08-05 Price Changed $80,000 HGMLS
- 2013-07-15 Relisted — HGMLS
- 2013-07-07 Delisted — HGMLS
- 2013-01-07 Listed $80,000 HGMLS
- 2013-01-07 Listed $80,000 OneKey® MLS as Distributed by MLS Grid
- 2004-08-27 Sold (MLS) $118,400 HGMLS
- 2004-05-01 Delisted — HGMLS
- 2004-04-02 Listed $118,400 HGMLS
Cash-flow waterfall
monthlySold comps — $/sqft
last 12 mo · ≤1 miLoading sold comps…