375 E Highway 20 Hwy #8 · Upper Lake, CA
Flood risk 1/10 · Minimal
- FEMA flood zone
- X (unshaded)
- Chance of flooding over 30 yrs
- 0.0%
- Est. flood insurance / yr
- $507 – $1,088
Fire risk 9/10 · Severe
- Est. fire insurance / yr
- $659 – $1,223
Heat risk 6/10 · Moderate
- Hot days now (above 100°F)
- 7 days/yr
- Hot days in 30 yrs
- 15 days/yr
Wind risk 1/10 · Minimal
- Chance of severe wind over 30 yrs
- —
Air-quality risk 10/10 · Severe
- Unhealthy air days now
- 38 days/yr
- Unhealthy air days in 30 yrs
- 38 days/yr
Risk factors via First Street. Map © Google.
Why this score? — see what drove the B grade
The composite is a weighted blend of 9 inputs, each scored 0–100. Each bar is that input's sub-score; the figure is the points it added to the 100-point composite (weight × sub-score).
- Cash flow +30.0/30.0
- DSCR +10.0/10.0
- 1% rule +8.5/10.0
- ARV discount +7.4/15.0
- Appreciation +5.2/10.0
- Livability +3.2/5.0
- Rent growth +2.5/5.0
- Condition / age +2.5/5.0
- Schools +2.0/10.0
$149,950
🖨 Deal sheet 📄 Offer letter ✓ Due diligence
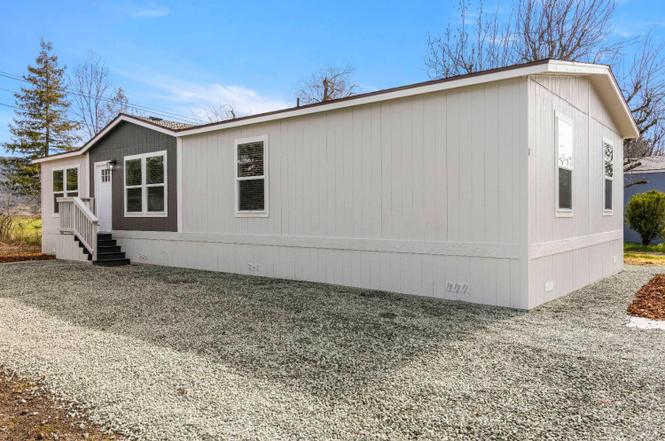
Listing remarks
Welcome to this brand new 2025 Tempo Series manufactured home located in the desirable Meadow Pointe Manufactured Community. With an affordable space rent of just $595 per month, this spacious home offers 4 bedrooms and 2 bathrooms in a thoughtfully designed open-concept floor plan. The modern kitchen features stainless steel appliances, abundant cabinetry for storage, and a seamless flow into the living and dining areasperfect for everyday living and entertaining. Indoor laundry hookups add convenience and functionality. The primary suite includes a walk-in closet and a private en-suite bathroom complete with double sinks and a separate shower stall. Modern fixtures are featured throughout
Key facts
- Abundant cabinetry
- Modern kitchen
- 2 parking spots
Tags
Neighborhood map
What this means for you Summary
Snapshot
- This is a 4-bed/2.0-bath manufactured listed at $150k.
Deal economics
- At list price, monthly cash flow is $561 ($7k/yr) — positive.
- The deal already cash-flows at list — no discount required.
- Meets the 1% rule at list price ($2k rent vs $150k).
- Recommended offer: $145k (3.0% below list) — sets the bar for market timing.
Location & tenants
- Location reads 65/100 on livability (#390 in CA) — a middle-class / working-renter tenant base. Strengths: employment A+, housing A+, crime A-; Watch: health & safety D+, schools D-, amenities F.
- Upper Lake Unified (rural): math 17% / reading 32% proficiency, ranked #433 of 517 in CA (top 84%) — low school quality limits family demand, transient renter base, plan for 1-2y turnover; 70% free/reduced lunch — lower-income household profile, screen leases tightly.
- Market conditions: 31 active listings in the ZIP; 107 units permitted in Lake County in 2024 (40 in 5+ unit buildings).
Forward outlook
- In year one you build about $2k of equity ($1k loan paydown + $589 appreciation (0.4% local appreciation)).
- Lake County population projected at -15% by 2050 — secular population decline; favor cash flow + early exit over multi-decade hold.
- At projected returns (0.4% appreciation + 3.0% rent growth), your $42k cash investment doubles in ~5 years — after that, you're playing with house money.
Negotiation context
- It's been on market 50 days — a 3% lower offer ($145k) is reasonable based on typical stale-listing flexibility.
Risks & watch-outs
- Climate carrying-cost: severe wildfire risk; extreme-heat days projected 7→15/yr by 2055 (HVAC capex compounding) — expect insurance premiums to compound above CPI over the hold.
Questions for the listing agent
- It's been on market 50 days. Have you received any prior offers? Is the seller open to a 3% concession, seller financing, or rate buy-down credit?
- Is there a deadline driving the sale (1031 exchange, divorce, estate, relocation)? That informs how much negotiation room exists.
- Schools are D-rated, which usually means shorter tenancies and higher turnover. Who's the typical renter profile here, and what's been the actual vacancy rate?
- What's the average days-on-market for RENTAL listings here right now (not sales)? A rising rental-DOM trend means longer vacancies and softer asking-rent achievability than the comps imply.
- What's the recent tenant-quality profile in this submarket — average credit score on applications, eviction rate, late-payment / NSF rate, and stable-employment percentage? A property-management company in the area should have these aggregated.
- How much new for-sale + rental construction is in the pipeline within 1–3 miles? Heavy new supply typically softens prices + rents 12–24 months out; constrained supply supports both.
Investment metrics
- 1% rule
- 1.35% ✓
- Cap rate
- 10.78%
- Cash-on-cash
- 16.03%
- DSCR
- 1.71
- GRM
- 6.2
CMA / ARV
- ARV (on-the-fly)
- $149,612
- Comps found
- 6
Show comp detail 6 sales within ~0.75 mi
| Address | Dist | Beds/Ba | Sqft | Sold | Price | $/sf | Match |
|---|---|---|---|---|---|---|---|
| 375 E Highway 20 Hwy #8 | 0.00mi | 4/2.0 | 1,324 (0%) | 1mo | $149,000 | $113 | 99 |
| 375 E Highway 20 Hwy #66 | 0.14mi | 3/2.0 (-1) | 1,344 (+2%) | 16mo | $69,000 | $51 | 73 |
| 375 E Highway 20 Hwy #26 | 0.07mi | 3/2.0 (-1) | 1,320 (-0%) | 23mo | $130,000 | $98 | 72 |
| 375 E Highway 20 Hwy #59 | 0.07mi | 3/2.0 (-1) | 1,226 (-7%) | 10mo | $140,000 | $114 | 71 |
| 375 E Highway 20 Hwy #72 | 0.07mi | 3/2.0 (-1) | 1,440 (+9%) | 18mo | $67,950 | $47 | 62 |
| 551 Clover Dr | 0.67mi | 3/2.0 (-1) | 1,488 (+12%) | 1mo | $325,000 | $218 | 42 |
Match score weights: distance 35% · size 25% · config 20% · recency 20%. Top-matched comps best support the ARV.
Projected returns pro-forma
0.39% appreciation · 3.0% rent growth · sell at horizon
- IRR
- 16.5%
- Equity multiple
- 1.81×
- Total profit
- $34,166
- Equity at exit
- $46,508
- IRR
- 20.5%
- Equity multiple
- 3.35×
- Total profit
- $98,763
- Equity at exit
- $58,332
Cash invested: $41,986 (down + closing). Projections, not guarantees.
Landlord ↔ Tenant lean methodology
- Overall (STATE)
- 18 Strongly Tenant-Friendly
- State California
- 18 Strongly Tenant-Friendly · D+13
- County
- — inherits STATE
- City
- — inherits STATE
ZIP-level market 95485
- Home prices YoY
- 0.2%
- Active inventory
- 31
- Price-to-rent
- 6.2×
Monthly cashflow live
- Estimated rent
- $2,022 medium interval (Pro) →
- Mortgage (P&I)
- −$786
- Tax est. 1.5%
- −$187 /mo · $2,249/yr
- Insurance
- −$62
- HOA
- −$0
- Vacancy / Maint / Mgmt
- −$425
- Net cashflow
- $561
Break-even live
UW: 25.0% down · 7.5% · 30yr · 1.5% tax · 5.0% vac · 8.0% maint · 8.0% mgmt
Financing live
Cash to close
- Down payment
- $37,488
- Closing costs
- $4,498
- Reserves months
- —
- Total cash needed
- —
Loan-product check · same deal, 3 products live
Conventional
25% down · 7.5% · 30yr
- Down + closing
- —
- Monthly P&I
- —
- Monthly cashflow
- —
- DSCR
- —
- Eligible?
- —
Personal DTI + credit; lowest rate.
DSCR
20% down · 8.5% · 30yr
- Down + closing
- —
- Monthly P&I
- —
- Monthly cashflow
- —
- DSCR
- —
- Eligible?
- —
No personal income docs; deal must DSCR.
Hard money
10% down · 12.0% · 12mo
- Down + closing
- —
- Monthly P&I
- —
- Monthly cashflow
- —
- DSCR
- —
- Eligible?
- —
Short-term bridge; refi at stabilization.
Climate risk First Street
- Flood 1/10 Low FEMA zone X (unshaded) · 0% chance over 30 yrs
- Wildfire 9/10 Extreme
- Heat 6/10 Major 7 d/yr ≥100°F today · 15 d/yr by 30 yrs out
- Wind 1/10 Low
- Air quality 10/10 Extreme 38 unhealthy d/yr today · 38 by 30 yrs out
Nearby sold comps map
Loading sold comps map…
Walkable amenities ~0.75 mi
Loading nearby amenities…
Taxation est. · year 1
- Rental income
- $24,263
- − Mortgage interest
- −$8,400
- − Property taxes
- −$2,249
- − Insurance
- −$750
- − Repairs & maintenance
- −$1,941
- − Management
- −$1,941
- − Depreciation
- −$4,362
- Taxable income
- $4,620
- Est. tax owed @ 24.0%
- −$1,109
- After-tax cash flow
- $5,624/yr
For passive investors: Depreciation is non-cash, so a rental often shows a tax loss while cash-flowing — sheltering income. Rental losses are passive: they offset passive income freely, and up to $25,000/yr can offset ordinary (W-2) income if you actively participate and your MAGI is under $100k (phasing out to $0 by $150k); unused losses carry forward. On sale, claimed depreciation is recaptured at up to 25%, and gains may owe capital-gains tax (a 1031 exchange can defer both). Figures are a year-1 estimate at your 24.0% rate — not tax advice; consult a CPA.
Schools (NCES district)
- District
- Upper Lake Unified
- NCES district ID
- 0601442
- Math proficiency
- 17% ▼ -3.00%
- Reading proficiency
- 32% ▲ 1.00%
- Median HH income
- $35,872
- Composite
- 20.24/100
- National rank
- #8624
- State rank
- #433 of 517 in CA
Livability — Upper Lake
- Score
- 65/100
- State rank
- #390
- US rank
- #13252
Category grades
Schools grade is shown separately in the Schools card above.
Census & demographics
- Census place
- Upper Lake, CA
- Population (ZIP)
- 2,900
Population outlook (Lake County) Hauer SSP2
- Today (2025)
- 62,396 people
- By 2030
- 60,626 · -2.8%
- By 2040
- 56,453 · -9.5%
- By 2050
- 53,054 · -15.0%
- By 2075
- 47,663 · -23.6%
- By 2100
- 41,804 · -33.0%
Race, ethnicity, and origin ACS 2023
- Neighborhood character
- Predominantly White (70%)
- Race & ethnicity
- White 70% Two or more races 16% Hispanic / Latino 12% Native American 3% Asian 1%
- Hispanic origin (detail)
- Mexican 7%
- Common ancestry
- Romanian 4% Portuguese 1% Slovak 1%
- Foreign-born
- 5% · Canada
- Languages at home
- 95% English-only · Spanish 5%
Political lean MEDSL · Lake
- 2024 margin
- Toss-up / Even · D 47.8% · R 49.2% · Other 3.0%
- 2008→2024 swing
- -20.6pp toward R · 2008: 19.3pp · 2024: -1.4pp
- All cycles
- 2024: R+1.4 2020: D+6.3 2016: D+3.7 2012: D+16.5 2008: D+19.3
Not yet ingested
- Civics
- —
Market trends
- HPI YoY
- ▲ 0.39%
- Current HPI
- 154.5278
- Rent YoY
- —
- Metro
- —
- State GDP YoY
- ▲ 3.21%
- F500 in state
- 116
Industry mix (Fortune 500 HQ in CA)
| Industry | F500 HQs | Revenue |
|---|---|---|
| Technology | 27 | $1,492B |
|
||
| Financial Services | 3 | $174B |
|
||
| Retail | 3 | $44B |
|
||
| Insurance | 3 | $26B |
|
||
| Media / Entertainment | 2 | $115B |
|
||
| Pharmaceuticals / Biotech | 2 | $62B |
|
||
Cash-flow waterfall
monthlySold comps — $/sqft
last 12 mo · ≤1 miLoading sold comps…