23315 Bunny Vw #7 · Ellicott, CO
Flood risk No data
- FEMA flood zone
- —
- Chance of flooding over 30 yrs
- —
- Est. flood insurance / yr
- —
Fire risk No data
- Est. fire insurance / yr
- —
Heat risk No data
- Hot days now (above threshold)
- —
- Hot days in 30 yrs
- —
Wind risk No data
- Chance of severe wind over 30 yrs
- —
Air-quality risk No data
- Unhealthy air days now
- —
- Unhealthy air days in 30 yrs
- —
Risk factors via First Street. Map © Google.
Why this score? — see what drove the B- grade
The composite is a weighted blend of 9 inputs, each scored 0–100. Each bar is that input's sub-score; the figure is the points it added to the 100-point composite (weight × sub-score).
- Cash flow +29.9/30.0
- DSCR +10.0/10.0
- 1% rule +8.4/10.0
- ARV discount +7.5/15.0
- Condition / age +3.8/5.0
- Livability +3.1/5.0
- Rent growth +2.5/5.0
- Schools +2.4/10.0
- Appreciation +0.0/10.0
$129,900
🖨 Deal sheet (PDF) 📄 Offer letter ✓ Due diligence
Listing remarks
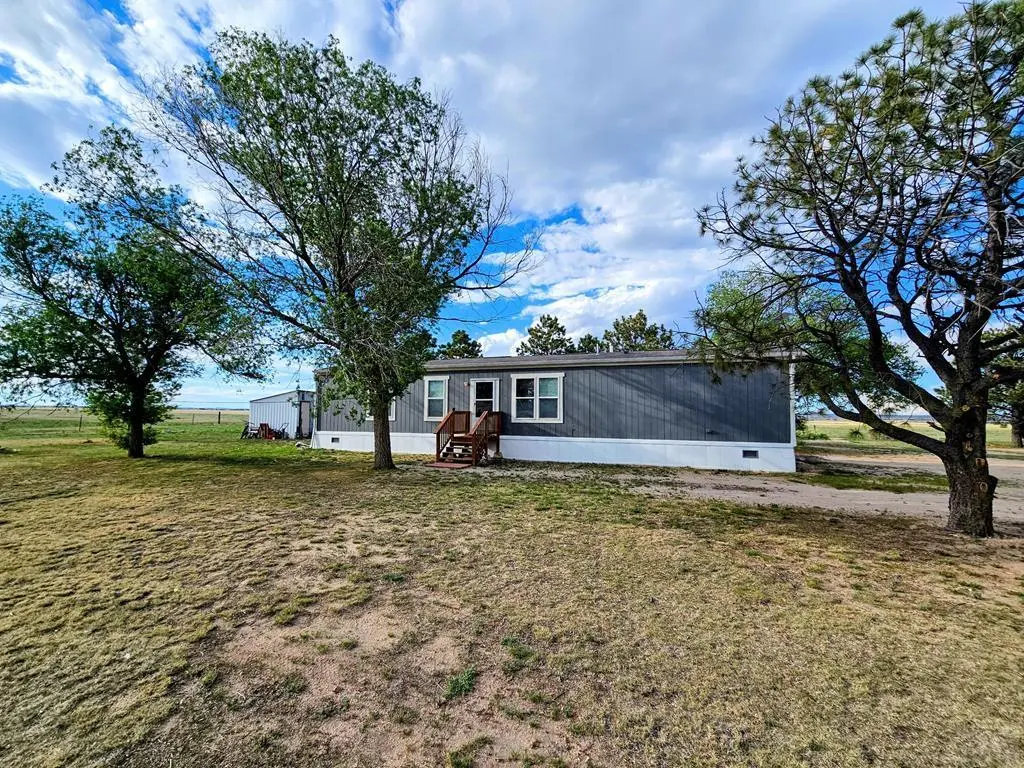
Just minutes from Colorado Springs! Very beautiful inexpensive country living. Here's your opportunity to live in the country surrounded by horses and amazing wildlife without having to worry about all the country maintenance. This 2 bedroom 2-bathroom mobile with central air was constructed in 2023 with extra foundation supports for extra floor load located just minutes from a private/public airport. If you are a horse lover, you do have the opportunity next door the to pay and have your personal horse boarded on huge open grassland.
Key facts
- Central air
- Huge open grassland
- Built 2023
Tags
Property features AI
Finance
- Financial info: Land lease: $650
- HOA & community: No association amenities; Association fees (if any) may include water, snow removal, and grounds maintenance
Exterior
- Parking: No garage
- Security: Smoke detector(s)
- Utilities: Shared well water
- Home design: Mobile home (residential); Single-family subtype
- Construction: Built with frame construction and wood/vinyl siding; Composition roof
- Exterior features: Porch; Shed(s); Has a view; Located on a cul-de-sac and a corner lot
Interior
- Kitchen: Disposal; Range; Oven; Dishwasher; Refrigerator
- Bedrooms: 2 main-level bedrooms
- Flooring: Laminate flooring
- Bathrooms: 2 full bathrooms (both on the main level)
- Heating & cooling: Propane forced-air heating; Central air conditioning
- Interior features: Master bedroom on the main level; Double-pane windows; No fireplace
- Laundry & utility: Washer and dryer included; Laundry located on the main level
Neighborhood map
What this means for you Summary
Snapshot
- This is a 2-bed/2.0-bath manufactured listed at $130k. Condition is rated good.
Deal economics
- At list price, monthly cash flow is $482 ($6k/yr) — positive.
- The deal already cash-flows at list — no discount required.
- Meets the 1% rule at list price ($2k rent vs $130k).
- Cap rate 10.7% vs local median 2.2% in Ellicott — top-decile yield for the area; either an underpriced asset or a hidden risk that comps aren't pricing in. Stress-test before assuming the spread holds.
Location & tenants
- Location reads 61/100 on livability (#226 in CO) — a middle-class / working-renter tenant base. Strengths: cost of living A+, housing A+, crime B; Watch: employment D+, schools D, amenities F.
- Ellicott School District No. 22 In The County Of El Paso A (rural): math 21% / reading 32% proficiency, ranked #62 of 86 in CO (top 72%) — low school quality limits family demand, transient renter base, plan for 1-2y turnover.
- Market conditions: 215 active listings in the ZIP; 3,906 units permitted in El Paso County in 2024 (872 in 5+ unit buildings).
Forward outlook
- Local home prices are declining (-3.0%/yr); year-one equity from $898 of loan paydown is wiped out by about $4k of value loss. Plan a longer hold.
- El Paso County population projected at +28% by 2050 — long-run rental-demand tailwind backs the buy-and-hold thesis.
- At projected returns (-3.0% appreciation + 3.0% rent growth), your $36k cash investment doubles in ~8 years — after that, you're playing with house money.
Negotiation context
- Only 13 days on market — expect competitive offers; lowballing is unlikely to land.
Questions for the listing agent
- Is there a deadline driving the sale (1031 exchange, divorce, estate, relocation)? That informs how much negotiation room exists.
- Schools are D-rated, which usually means shorter tenancies and higher turnover. Who's the typical renter profile here, and what's been the actual vacancy rate?
- What's the average days-on-market for RENTAL listings here right now (not sales)? A rising rental-DOM trend means longer vacancies and softer asking-rent achievability than the comps imply.
- What's the recent tenant-quality profile in this submarket — average credit score on applications, eviction rate, late-payment / NSF rate, and stable-employment percentage? A property-management company in the area should have these aggregated.
- How much new for-sale + rental construction is in the pipeline within 1–3 miles? Heavy new supply typically softens prices + rents 12–24 months out; constrained supply supports both.
Investment metrics
- 1% rule
- 1.34% ✓
- Cap rate
- 10.74%
- Cash-on-cash
- 15.89%
- DSCR
- 1.71
- GRM
- 6.2
CMA / ARV
No comps found within radius.
Projected returns pro-forma
-3.0% appreciation · 3.0% rent growth · sell at horizon
- IRR
- 6.8%
- Equity multiple
- 1.27×
- Total profit
- $9,658
- Equity at exit
- $19,369
- IRR
- 16.2%
- Equity multiple
- 2.32×
- Total profit
- $48,023
- Equity at exit
- $11,231
Cash invested: $36,372 (down + closing). Projections, not guarantees.
Landlord ↔ Tenant lean methodology
- Overall (STATE)
- 38 Tenant-Leaning
- State Colorado
- 38 Tenant-Leaning · D+4
- County
- — inherits STATE
- City
- — inherits STATE
ZIP-level market 80808
- Home prices YoY
- -5.4%
- Active inventory
- 215
- Price-to-rent
- 6.2×
Monthly cashflow live
- Estimated rent
- $1,746 medium interval (Pro) →
- Mortgage (P&I)
- −$681
- Tax est. 1.5%
- −$162 /mo · $1,948/yr
- Insurance
- −$54
- HOA
- −$0
- Vacancy / Maint / Mgmt
- −$367
- Net cashflow
- $482
Break-even live
Sensitivity live
| Price | -10% $571 | -5% $527 | +0% $482 | +5% $437 | +10% $392 |
|---|---|---|---|---|---|
| Rent | -10% $344 | -5% $413 | +0% $482 | +5% $551 | +10% $620 |
| Rate | -1.0pp $547 | -0.5pp $515 | base $482 | +0.5pp $448 | +1.0pp $414 |
UW: 25.0% down · 7.5% · 30yr · 1.5% tax · 5.0% vac · 8.0% maint · 8.0% mgmt
Financing live
Cash to close
- Down payment
- $32,475
- Closing costs
- $3,897
- Reserves months
- —
- Total cash needed
- —
Loan-product check · same deal, 3 products live
Conventional
25% down · 7.5% · 30yr
- Down + closing
- —
- Monthly P&I
- —
- Monthly cashflow
- —
- DSCR
- —
- Eligible?
- —
Personal DTI + credit; lowest rate.
DSCR
20% down · 8.5% · 30yr
- Down + closing
- —
- Monthly P&I
- —
- Monthly cashflow
- —
- DSCR
- —
- Eligible?
- —
No personal income docs; deal must DSCR.
Hard money
10% down · 12.0% · 12mo
- Down + closing
- —
- Monthly P&I
- —
- Monthly cashflow
- —
- DSCR
- —
- Eligible?
- —
Short-term bridge; refi at stabilization.
Listing history 11 events
-
2026-06-18days on market $129,900 Active 13 DOM
-
2026-06-17days on market $129,900 Active 12 DOM
-
2026-06-16days on market $129,900 Active 11 DOM
-
2026-06-15days on market $129,900 Active 10 DOM
-
2026-06-14days on market $129,900 Active 8 DOM
-
2026-06-13days on market $129,900 Active 7 DOM
-
2026-06-10days on market $129,900 Active 5 DOM
-
2026-06-09days on market $129,900 Active 4 DOM
-
2026-06-08days on market $129,900 Active 3 DOM
-
2026-06-07remarks 540-char remark
-
2026-06-07$129,900 Active 2 DOM
ⓘ Source: listings_history table (triggers on properties + properties_extension) + one-shot
backfill from property_details.listing_events for pre-trigger history.
Nearby sold comps map
Loading sold comps map…
Walkable amenities ~0.75 mi
Loading nearby amenities…
Taxation est. · year 1
- Rental income
- $20,953
- − Mortgage interest
- −$7,276
- − Property taxes
- −$1,948
- − Insurance
- −$650
- − Repairs & maintenance
- −$1,676
- − Management
- −$1,676
- − Depreciation
- −$3,779
- Taxable income
- $3,947
- Est. tax owed @ 24.0%
- −$947
- After-tax cash flow
- $4,833/yr
For passive investors: Depreciation is non-cash, so a rental often shows a tax loss while cash-flowing — sheltering income. Rental losses are passive: they offset passive income freely, and up to $25,000/yr can offset ordinary (W-2) income if you actively participate and your MAGI is under $100k (phasing out to $0 by $150k); unused losses carry forward. On sale, claimed depreciation is recaptured at up to 25%, and gains may owe capital-gains tax (a 1031 exchange can defer both). Figures are a year-1 estimate at your 24.0% rate — not tax advice; consult a CPA.
Condition & rehab AI · 13 photos
This mobile home is in good condition with a good condition score of 75. It has a good exterior, interior, and HVAC system. The home is move-in ready and has a good curb appeal. The home has a good location with easy access to a private/public airport and is surrounded by horses and wildlife. The home has a good resale and rental value.
Value-add opportunities
- Both Paint exterior — Fresh paint can improve the home's curb appeal and make it more attractive to potential buyers or renters.
- Both Clean gutters — Clean gutters can prevent water damage and improve the home's overall appearance.
- Both Landscaping — Well-maintained landscaping can enhance the home's curb appeal and make it more attractive to potential buyers or renters.
- Both HVAC maintenance — Regular HVAC maintenance can improve the home's comfort and energy efficiency, making it more attractive to potential buyers or renters.
- Both Interior cleaning — A clean interior can make the home more attractive to potential buyers or renters and can help it sell faster.
Renovation cost estimate screening
Value-add ROI direction
- Both Paint exterior — Fresh paint can improve the home's curb appeal and make it more attractive to potential buyers or renters. ↑
- Both Clean gutters — Clean gutters can prevent water damage and improve the home's overall appearance. ↑
- Both Landscaping — Well-maintained landscaping can enhance the home's curb appeal and make it more attractive to potential buyers or renters. ↑
- Both HVAC maintenance — Regular HVAC maintenance can improve the home's comfort and energy efficiency, making it more attractive to potential buyers or renters. ↑
- Both Interior cleaning — A clean interior can make the home more attractive to potential buyers or renters and can help it sell faster. ↑
ⓘ Cost ranges are severity-bucket heuristics (US national rule-of-thumb). Get contractor quotes + a written scope before underwriting a rehab budget.
Schools (NCES district)
- District
- Ellicott School District No. 22 In The County Of El Paso A
- NCES district ID
- 0803750
- Math proficiency
- 21% ▼ -5.00%
- Reading proficiency
- 32% ▼ -11.00%
- Median HH income
- $53,227
- Composite
- 23.57/100
- National rank
- #7854
- State rank
- #62 of 86 in CO
Livability — Ellicott
- Score
- 61/100
- State rank
- #226
- US rank
- #18229
Category grades
Schools grade is shown separately in the Schools card above.
Census & demographics
- Census place
- Ellicott, CO
- Population (ZIP)
- 6,670
Population outlook (El Paso County) Hauer SSP2
- Today (2025)
- 768,926 people
- By 2030
- 815,739 · +6.1%
- By 2040
- 903,489 · +17.5%
- By 2050
- 981,204 · +27.6%
- By 2075
- 1,155,542 · +50.3%
- By 2100
- 1,202,070 · +56.3%
Race, ethnicity, and origin ACS 2023
- Neighborhood character
- Predominantly White (74%)
- Race & ethnicity
- White 74% Hispanic / Latino 18% Two or more races 11% Black 2% Asian 1%
- Hispanic origin (detail)
- Mexican 11% Puerto Rican 2%
- Common ancestry
- Italian 3% Slovak 3% Portuguese 2%
- Foreign-born
- 6% · Canada
- Languages at home
- 89% English-only · Spanish 9% German/W. Germanic 1%
Political lean MEDSL · El Paso
- 2024 margin
- Lean R (+9.8) · D 43.8% · R 53.5% · Other 2.7%
- 2008→2024 swing
- +9.0pp toward D · 2008: -18.8pp · 2024: -9.8pp
- All cycles
- 2024: R+9.8 2020: R+10.8 2016: R+22.6 2012: R+21.4 2008: R+18.8
Not yet ingested
- Civics
- —
Market trends
- HPI YoY
- ▼ -21.43%
- Current HPI
- 376.1057
- Rent YoY
- —
- Metro
- —
- State GDP YoY
- ▲ 1.95%
- F500 in state
- 14
Industry mix (Fortune 500 HQ in CO)
| Industry | F500 HQs | Revenue |
|---|---|---|
| Technology Distribution | 1 | $31B |
|
||
| Food / Agriculture | 1 | $18B |
|
||
| Packaging | 1 | $14B |
|
||
| Healthcare | 1 | $13B |
|
||
| Energy | 1 | $10B |
|
||
| Technology | 1 | $4B |
|
||
Price history
1 event — show timeline
- 2026-06-05 Listed $129,900 PARMLS
Cash-flow waterfall
monthlySold comps — $/sqft
last 12 mo · ≤1 miLoading sold comps…