 🏗️ New Construction
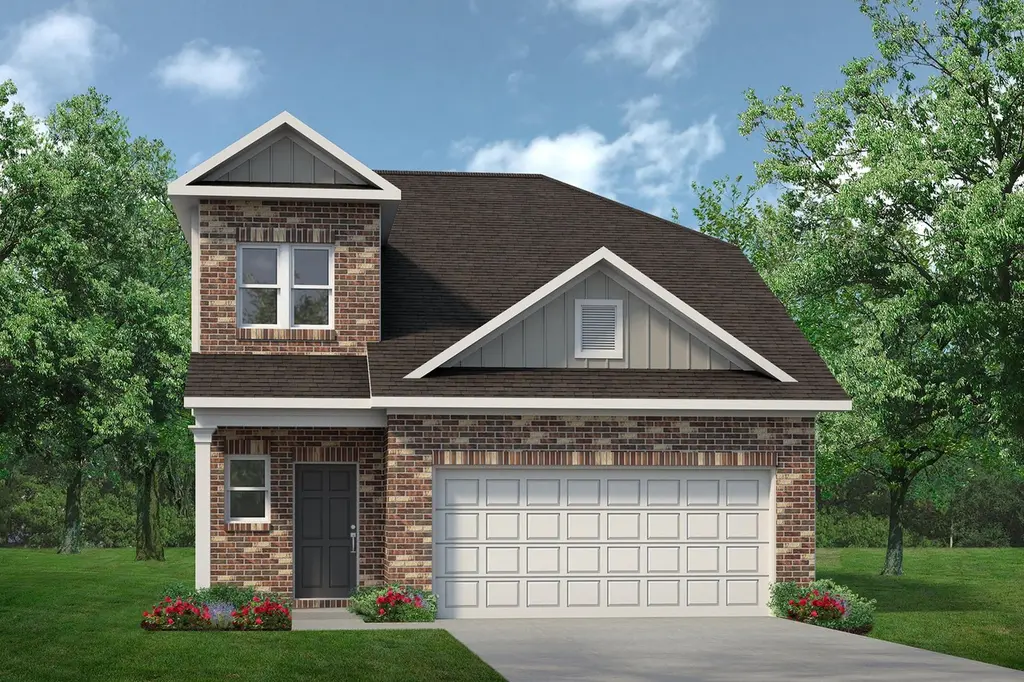
The Robin II Plan · Willis, TX
Flood risk 1/10 · Minimal
- FEMA flood zone
- X (unshaded)
- Chance of flooding over 30 yrs
- 0.0%
- Est. flood insurance / yr
- $507 – $1,088
Fire risk 5/10 · Moderate
- Est. fire insurance / yr
- $1,222 – $2,270
Heat risk 8/10 · Major
- Hot days now (above 111°F)
- 7 days/yr
- Hot days in 30 yrs
- 23 days/yr
Wind risk 8/10 · Major
- Chance of severe wind over 30 yrs
- 99.0%
Air-quality risk 2/10 · Minimal
- Unhealthy air days now
- 1 days/yr
- Unhealthy air days in 30 yrs
- 1 days/yr
Risk factors via First Street. Map © Google.
Why this score? — see what drove the D grade
The composite is a weighted blend of 9 inputs, each scored 0–100. Each bar is that input's sub-score; the figure is the points it added to the 100-point composite (weight × sub-score).
- Cash flow +14.8/30.0
- ARV discount +7.5/15.0
- DSCR +4.5/10.0
- 1% rule +4.1/10.0
- Condition / age +4.0/5.0
- Schools +3.2/10.0
- Livability +3.1/5.0
- Rent growth +2.0/5.0
- Appreciation +0.0/10.0
$242,990
🖨 Deal sheet 📄 Offer letter ✓ Due diligence
Listing remarks MLS
The Robin II is a two-story plan with a spacious primary suite on the main level. A covered front porch greets you as you enter the home, leading to the kitchen, dining area, and attached family room. The primary suite is at the rear of the home on the first floor and includes a generous ensuite and walk-in closet. There are three additional bedrooms, a shared bath, and an oversized loft upstairs. The loft can be optioned as an enclosed media room or a fifth bedroom with an ensuite bath.
Key facts
- Covered front porch
- Oversized loft
- Walk-in closet
Tags
Neighborhood map
What this means for you Summary
Snapshot
- This is a 4-bed/2.5-bath single-family listed at $243k. Condition is rated good.
Deal economics
- At list price, monthly cash flow is $74 ($890/yr) — positive.
- The deal already cash-flows at list — no discount required.
- Meets the 1% rule at list price ($2k rent vs $243k).
- Recommended offer: $239k (1.5% below list) — sets the bar for market timing.
- Cap rate 6.6% vs local median 4.7% in Willis — top-decile yield for the area; either an underpriced asset or a hidden risk that comps aren't pricing in. Stress-test before assuming the spread holds.
Location & tenants
- Location reads 62/100 on livability (#933 in TX) — a middle-class / working-renter tenant base. Strengths: cost of living A+, housing A+; Watch: crime C-, schools D+, employment D+.
- Willis ISD (rural): math 33% / reading 40% proficiency, ranked #458 of 826 in TX (top 55%) — families likely to look elsewhere, expect single-tenant / working-renter base with shorter leases.
- Market conditions: Rents soft (-2.1%/yr); 1189 active listings in the ZIP; 1 comparable units currently listed for rent nearby; solid renter incomes; 13,259 units permitted in Montgomery County in 2024 (1,402 in 5+ unit buildings).
- This rent runs 32% of the median local income ($92k/yr) — at the standard rent-burdened threshold; future hikes will face affordability resistance.
Forward outlook
- Local home prices are declining (-3.0%/yr); year-one equity from $2k of loan paydown is wiped out by about $8k of value loss. Plan a longer hold.
- Montgomery County population projected at +65% by 2050 — long-run rental-demand tailwind backs the buy-and-hold thesis.
Negotiation context
- It's been on market 20 days — a 2% lower offer ($239k) is reasonable based on typical stale-listing flexibility.
Risks & watch-outs
- Climate carrying-cost: severe wind risk, 99% chance of damaging wind over 30y; moderate wildfire risk; extreme-heat days projected 7→23/yr by 2055 (HVAC capex compounding) — expect insurance premiums to compound above CPI over the hold.
Questions for the listing agent
- Is there a deadline driving the sale (1031 exchange, divorce, estate, relocation)? That informs how much negotiation room exists.
- Schools are D-rated, which usually means shorter tenancies and higher turnover. Who's the typical renter profile here, and what's been the actual vacancy rate?
- The area grade is low — what's the realistic commute time and amenity access for the typical tenant pool here? Any planned neighborhood developments (good or bad) we should know about?
- What's the average days-on-market for RENTAL listings here right now (not sales)? A rising rental-DOM trend means longer vacancies and softer asking-rent achievability than the comps imply.
- What's the recent tenant-quality profile in this submarket — average credit score on applications, eviction rate, late-payment / NSF rate, and stable-employment percentage? A property-management company in the area should have these aggregated.
- How much new for-sale + rental construction is in the pipeline within 1–3 miles? Heavy new supply typically softens prices + rents 12–24 months out; constrained supply supports both.
Investment metrics
- 1% rule
- 0.91% ✗
- Cap rate
- 6.62%
- Cash-on-cash
- 1.18%
- DSCR
- 1.05
- GRM
- 9.2
CMA / ARV
- ARV (median comp)
- $269,916
- List price
- $242,990
- Delta
- -9.98%
- Verdict
- FAIR
- Comps
- 20 within 1.0 mi
Show comp detail 12 sales within ~0.75 mi
| Address | Dist | Beds/Ba | Sqft | Sold | Price | $/sf | Match |
|---|---|---|---|---|---|---|---|
| 9749 Enclave Ridge Rd | 0.13mi | 4/2.5 | 2,173 (0%) | 2mo | $282,555 | $130 | 92 |
| 9765 Enclave Ridge Rd | 0.16mi | 4/2.5 | 2,173 (0%) | 4mo | $290,160 | $134 | 89 |
| 9758 Enclave Ridge Rd | 0.16mi | 3/2.5 (-1) | 2,061 (-5%) | 2mo | $259,990 | $126 | 77 |
| 12375 Sunset Canyon Way | 0.27mi | 4/3.5 | 2,253 (+4%) | 1mo | $288,075 | $128 | 76 |
| 12307 Sunset Canyon Way | 0.24mi | 4/3.5 | 2,253 (+4%) | 6mo | $334,910 | $149 | 73 |
| 12739 Woodcreek Dr | 0.41mi | 3/3.0 (-1) | 2,284 (+5%) | 0mo | $340,000 | $149 | 65 |
| 12575 Canyon Falls Blvd | 0.05mi | 4/3.0 | 2,402 (+10%) | 20mo | $310,000 | $129 | 62 |
| 12079 Noble Heart Dr | 0.34mi | 4/3.5 | 2,300 (+6%) | 18mo | $350,000 | $152 | 56 |
| 13074 Falling Oak Dr | 0.60mi | 4/2.0 | 2,128 (-2%) | 21mo | $155,000 | $73 | 49 |
| 13054 Falling Oak Dr | 0.53mi | 5/3.0 (+1) | 2,016 (-7%) | 18mo | $114,950 | $57 | 41 |
| 718 Campbell Crossing Ct | 0.74mi | 3/2.0 (-1) | 2,026 (-7%) | 10mo | $429,900 | $212 | 39 |
| 240 River Grove St | 0.75mi | 5/3.0 (+1) | 2,358 (+8%) | 15mo | $314,990 | $134 | 31 |
Match score weights: distance 35% · size 25% · config 20% · recency 20%. Top-matched comps best support the ARV.
Projected returns pro-forma
-3.0% appreciation · 0.0% rent growth · sell at horizon
- IRR
- -17.8%
- Equity multiple
- 0.39×
- Total profit
- $-46,173
- Equity at exit
- $40,245
- IRR
- -17.2%
- Equity multiple
- 0.18×
- Total profit
- $-61,779
- Equity at exit
- $23,337
Cash invested: $75,576 (down + closing). Projections, not guarantees.
Landlord ↔ Tenant lean methodology
- Overall (STATE)
- 87 Strongly Landlord-Friendly
- State Texas
- 87 Strongly Landlord-Friendly · R+5
- County
- — inherits STATE
- City
- — inherits STATE
ZIP-level market 77318
- Home prices YoY
- -32.7%
- Rents YoY
- -2.1%
- Active inventory
- 1189
- Price-to-rent
- 8.2×
Monthly cashflow live
- Estimated rent
- $2,455 medium interval (Pro) →
- Mortgage (P&I)
- −$1,415
- Tax est. 1.5%
- −$337 /mo · $4,049/yr
- Insurance
- −$112
- HOA
- −$0
- Vacancy / Maint / Mgmt
- −$516
- Net cashflow
- $74
Break-even live
UW: 25.0% down · 7.5% · 30yr · 1.5% tax · 5.0% vac · 8.0% maint · 8.0% mgmt
Financing live
Cash to close
- Down payment
- $67,479
- Closing costs
- $8,097
- Reserves months
- —
- Total cash needed
- —
Loan-product check · same deal, 3 products live
Conventional
25% down · 7.5% · 30yr
- Down + closing
- —
- Monthly P&I
- —
- Monthly cashflow
- —
- DSCR
- —
- Eligible?
- —
Personal DTI + credit; lowest rate.
DSCR
20% down · 8.5% · 30yr
- Down + closing
- —
- Monthly P&I
- —
- Monthly cashflow
- —
- DSCR
- —
- Eligible?
- —
No personal income docs; deal must DSCR.
Hard money
10% down · 12.0% · 12mo
- Down + closing
- —
- Monthly P&I
- —
- Monthly cashflow
- —
- DSCR
- —
- Eligible?
- —
Short-term bridge; refi at stabilization.
Rent comps 1 comps
| Address | Beds | Baths | Sqft | Rent | $/sqft | DOM | Units | Dist |
|---|---|---|---|---|---|---|---|---|
| 347 Skyline Ridge Dr Willis, TX | 3.0 | 3.0 | 3000 | $3,100 | $1.03 | 43d | 1 | 1.50mi |
Listing history 16 events
-
2026-06-18days on market $242,990 Active 20 DOM
-
2026-06-17days on market $242,990 Active 19 DOM
-
2026-06-16days on market $242,990 Active 18 DOM
-
2026-06-15days on market $242,990 Active 17 DOM
-
2026-06-13days on market $242,990 Active 15 DOM
-
2026-06-09days on market $242,990 Active 11 DOM
-
2026-06-08days on market $242,990 Active 10 DOM
-
2026-06-07days on market $242,990 Active 9 DOM
-
2026-06-04days on market $242,990 Active 6 DOM
-
2026-06-03days on market $242,990 Active 5 DOM
-
2026-06-02days on market $242,990 Active 4 DOM
-
2026-06-01days on market $242,990 Active 3 DOM
-
2026-05-31days on market $242,990 Active 2 DOM
-
2026-05-14price $242,990 492-char remark
Show marketing remark (492 chars)
The Robin II is a two-story plan with a spacious primary suite on the main level. A covered front porch greets you as you enter the home, leading to the kitchen, dining area, and attached family room. The primary suite is at the rear of the home on the first floor and includes a generous ensuite and walk-in closet. There are three additional bedrooms, a shared bath, and an oversized loft upstairs. The loft can be optioned as an enclosed media room or a fifth bedroom with an ensuite bath.
-
2026-05-04price $257,990 492-char remark
Show marketing remark (492 chars)
The Robin II is a two-story plan with a spacious primary suite on the main level. A covered front porch greets you as you enter the home, leading to the kitchen, dining area, and attached family room. The primary suite is at the rear of the home on the first floor and includes a generous ensuite and walk-in closet. There are three additional bedrooms, a shared bath, and an oversized loft upstairs. The loft can be optioned as an enclosed media room or a fifth bedroom with an ensuite bath.
-
2026-03-09$254,990 Active 492-char remark
Show marketing remark (492 chars)
The Robin II is a two-story plan with a spacious primary suite on the main level. A covered front porch greets you as you enter the home, leading to the kitchen, dining area, and attached family room. The primary suite is at the rear of the home on the first floor and includes a generous ensuite and walk-in closet. There are three additional bedrooms, a shared bath, and an oversized loft upstairs. The loft can be optioned as an enclosed media room or a fifth bedroom with an ensuite bath.
ⓘ Source: listings_history table (triggers on properties + properties_extension) + one-shot
backfill from property_details.listing_events for pre-trigger history.
Climate risk First Street
- Flood 1/10 Low FEMA zone X (unshaded) · 0% chance over 30 yrs
- Wildfire 5/10 Major
- Heat 8/10 Severe 7 d/yr ≥111°F today · 23 d/yr by 30 yrs out
- Wind 8/10 Severe 99% chance of damaging wind over 30 yrs
- Air quality 2/10 Low 1 unhealthy d/yr today · 1 by 30 yrs out
Nearby sold comps map
Loading sold comps map…
Walkable amenities ~0.75 mi
Loading nearby amenities…
Taxation est. · year 1
- Rental income
- $29,460
- − Mortgage interest
- −$15,119
- − Property taxes
- −$4,049
- − Insurance
- −$1,350
- − Repairs & maintenance
- −$2,357
- − Management
- −$2,357
- − Depreciation
- −$7,852
- Taxable loss
- −$3,623
- Est. tax savings @ 24.0%
- +$870
- After-tax cash flow
- $1,759/yr
For passive investors: Depreciation is non-cash, so a rental often shows a tax loss while cash-flowing — sheltering income. Rental losses are passive: they offset passive income freely, and up to $25,000/yr can offset ordinary (W-2) income if you actively participate and your MAGI is under $100k (phasing out to $0 by $150k); unused losses carry forward. On sale, claimed depreciation is recaptured at up to 25%, and gains may owe capital-gains tax (a 1031 exchange can defer both). Figures are a year-1 estimate at your 24.0% rate — not tax advice; consult a CPA.
Condition & rehab AI · 1 photo
The Robin II Plan is a well-maintained two-story home with good condition and minimal repairs needed. It offers a spacious layout and is ready for a fresh coat of paint and some landscaping to enhance its curb appeal and value.
Value-add opportunities
- Both Painting exterior and interior — Enhances curb appeal and interior aesthetics
- Both Landscaping improvements — Enhances curb appeal and adds value
- Both New flooring in bathrooms and kitchen — Improves functionality and aesthetics
- Both New lighting fixtures — Enhances interior aesthetics and functionality
Renovation cost estimate screening
Value-add ROI direction
- Both Painting exterior and interior — Enhances curb appeal and interior aesthetics ↑
- Both Landscaping improvements — Enhances curb appeal and adds value ↑
- Both New flooring in bathrooms and kitchen — Improves functionality and aesthetics ↑
- Both New lighting fixtures — Enhances interior aesthetics and functionality ↑
ⓘ Cost ranges are severity-bucket heuristics (US national rule-of-thumb). Get contractor quotes + a written scope before underwriting a rehab budget.
Schools (NCES district)
- District
- Willis ISD
- NCES district ID
- 4845900
- Math proficiency
- 33% ▼ -15.00%
- Reading proficiency
- 40% ▼ -2.00%
- Median HH income
- $57,828
- Composite
- 32.32/100
- National rank
- #5746
- State rank
- #458 of 826 in TX
Livability — Willis
- Score
- 62/100
- State rank
- #933
- US rank
- #16579
Category grades
Schools grade is shown separately in the Schools card above.
Census & demographics
- Census place
- Willis, TX
- County
- Montgomery County · 663,713 people
- City population
- 38,421
- Metro
- Houston-The Woodlands-Sugar Land, TX
- Population (ZIP)
- 20,792
- Household income
- $92,415
- Rent vs Own
- Severe rent burden
- 279.0
Population outlook (Montgomery County) Hauer SSP2
- Today (2025)
- 713,896 people
- By 2030
- 805,263 · +12.8%
- By 2040
- 992,708 · +39.1%
- By 2050
- 1,179,590 · +65.2%
- By 2075
- 1,628,084 · +128.1%
- By 2100
- 1,937,880 · +171.5%
Race, ethnicity, and origin ACS 2023
- Neighborhood character
- Predominantly White (72%)
- Race & ethnicity
- White 72% Hispanic / Latino 17% Two or more races 14% Black 3%
- Hispanic origin (detail)
- Mexican 12%
- Common ancestry
- Lithuanian 4% Slovak 2% Serbian 2%
- Foreign-born
- 6% · Canada, Jamaica
- Languages at home
- 88% English-only · Spanish 10%
Political lean MEDSL · Montgomery
- 2024 margin
- Solid R (+45.5) · D 26.8% · R 72.3%
- 2008→2024 swing
- +7.2pp toward D · 2008: -52.7pp · 2024: -45.5pp
- All cycles
- 2024: R+45.5 2020: R+43.8 2016: R+51.4 2012: R+60.7 2008: R+52.7
Not yet ingested
- Civics
- —
Market trends
- HPI YoY
- ▼ -114.58%
- Current HPI
- 236.256
- Rent YoY
- ▼ -2.09%
- Metro
- Houston-The Woodlands-Sugar Land, TX
- State GDP YoY
- ▲ 3.95%
- F500 in state
- 110
Industry mix (Fortune 500 HQ in TX)
| Industry | F500 HQs | Revenue |
|---|---|---|
| Energy | 16 | $1,198B |
|
||
| Technology | 5 | $198B |
|
||
| Engineering / Construction | 4 | $72B |
|
||
| Energy Services | 3 | $60B |
|
||
| Utilities | 3 | $41B |
|
||
| Healthcare | 2 | $330B |
|
||
Price history
-4.7% since first listed3 events — show timeline
- 2026-05-14 Price Changed $242,990 Zillow
- 2026-05-04 Price Changed $257,990 Zillow
- 2026-03-09 Listed $254,990 Zillow
Cash-flow waterfall
monthlySold comps — $/sqft
last 12 mo · ≤1 miLoading sold comps…