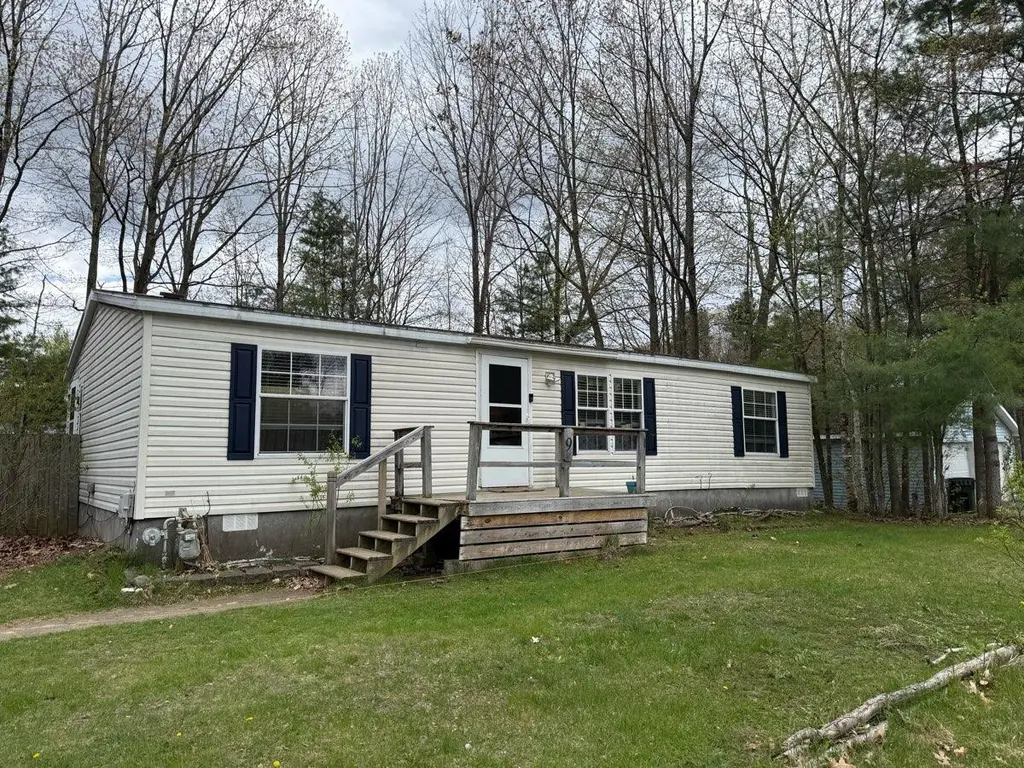
9 Mallard Dr · Plattsburgh West, NY
Flood risk 1/10 · Minimal
- FEMA flood zone
- X (unshaded)
- Chance of flooding over 30 yrs
- 0.0%
- Est. flood insurance / yr
- $507 – $1,088
Fire risk 3/10 · Minor
- Est. fire insurance / yr
- $691 – $1,283
Heat risk 3/10 · Minor
- Hot days now (above 93°F)
- 7 days/yr
- Hot days in 30 yrs
- 15 days/yr
Wind risk 1/10 · Minimal
- Chance of severe wind over 30 yrs
- 1.0%
Air-quality risk 2/10 · Minimal
- Unhealthy air days now
- 1 days/yr
- Unhealthy air days in 30 yrs
- 1 days/yr
Risk factors via First Street. Map © Google.
Why this score? — see what drove the D grade
The composite is a weighted blend of 9 inputs, each scored 0–100. Each bar is that input's sub-score; the figure is the points it added to the 100-point composite (weight × sub-score).
- Cash flow +13.6/30.0
- ARV discount +7.5/15.0
- Schools +4.4/10.0
- 1% rule +4.1/10.0
- DSCR +4.1/10.0
- Livability +3.2/5.0
- Rent growth +2.5/5.0
- Condition / age +2.5/5.0
- Appreciation +0.0/10.0
$179,000
🖨 Deal sheet (PDF) 📄 Offer letter ✓ Due diligence
Listing remarks MLS
Affordable, single floor living! Spacious, fenced in back yard with large deck for enjoying your morning coffee or evening beverage. Close to Town & City amenities. Central air conditioning to keep cool on those hot summer nights. Two sheds for storage. Updated flooring through most of the house. Updated kitchen includes stainless steel appliances! Schedule a showing today!
Key facts
- Large deck
- Single floor living
- Updated flooring
Tags
Neighborhood map
What this means for you Summary
Snapshot
- This is a 3-bed/2.0-bath manufactured listed at $179k.
Deal economics
- At list price, monthly cash flow is $11 ($135/yr) — positive.
- The deal already cash-flows at list — no discount required.
- To meet the 1% rule (rent ≥ 1% of price), the offer needs to be $164k (8.6% below list).
- Recommended offer: $164k (8.6% below list) — sets the bar for 1% rule.
Location & tenants
- Location reads 65/100 on livability (#679 in NY) — a middle-class / working-renter tenant base. Strengths: cost of living A+, housing A+, crime A-; Watch: amenities F, commute F, health & safety D-.
- Beekmantown Central School District (rural): math 45% / reading 57% proficiency, ranked #360 of 590 in NY (top 61%) — acceptable for families but not a draw, mixed tenant base, ~2y average lease.
- Zoned schools: Cumberland Head Elementary School (math 57% / reading 67%, grade B, #675 of 2,108 statewide, top 35%, 538 students, 46% FRL); Beekmantown Middle School (math 30% / reading 53%, grade F, #394 of 729 statewide, top 55%, 450 students, 49% FRL); Beekmantown High School (math 92% / reading 50%, grade B+, #701 of 1,100 statewide, top 64%, 546 students, 49% FRL).
- Market conditions: 184 active listings in the ZIP; 192 units permitted in Clinton County in 2024 (64 in 5+ unit buildings).
Forward outlook
- Local home prices are declining (-3.0%/yr); year-one equity from $1k of loan paydown is wiped out by about $5k of value loss. Plan a longer hold.
- Clinton County population projected at -16% by 2050 — secular population decline; favor cash flow + early exit over multi-decade hold.
Negotiation context
- It's been on market 75 days — a 6% lower offer ($168k) is reasonable based on typical stale-listing flexibility.
- 2 sale attempts since 4y ago; this cycle's ask has dropped $20k (10%) from the opening price — seller is motivated, your offer sets the floor, not the list.
- Current owner paid $129k; 39% above their basis — modest negotiation headroom, anchor on the comps not their cost.
Questions for the listing agent
- It's been on market 75 days. Have you received any prior offers? Is the seller open to a 9% concession, seller financing, or rate buy-down credit?
- Why hasn't it sold? Are there any deal-killer items the seller is aware of (foundation, flood, title, zoning, code violations)?
- Is there a deadline driving the sale (1031 exchange, divorce, estate, relocation)? That informs how much negotiation room exists.
- Schools are F-rated, which usually means shorter tenancies and higher turnover. Who's the typical renter profile here, and what's been the actual vacancy rate?
- The area grade is low — what's the realistic commute time and amenity access for the typical tenant pool here? Any planned neighborhood developments (good or bad) we should know about?
- What's the average days-on-market for RENTAL listings here right now (not sales)? A rising rental-DOM trend means longer vacancies and softer asking-rent achievability than the comps imply.
- What's the recent tenant-quality profile in this submarket — average credit score on applications, eviction rate, late-payment / NSF rate, and stable-employment percentage? A property-management company in the area should have these aggregated.
- How much new for-sale + rental construction is in the pipeline within 1–3 miles? Heavy new supply typically softens prices + rents 12–24 months out; constrained supply supports both.
Investment metrics
- 1% rule
- 0.91% ✗
- Cap rate
- 6.37%
- Cash-on-cash
- 0.27%
- DSCR
- 1.01
- GRM
- 9.1
CMA / ARV
- ARV (median comp)
- $47,499
- List price
- $179,000
- Delta
- 276.85%
- Verdict
- OVERPRICED
- Comps
- 5 within 1.0 mi
Show comp detail 3 sales within ~0.75 mi
| Address | Dist | Beds/Ba | Sqft | Sold | Price | $/sf | Match |
|---|---|---|---|---|---|---|---|
| 1408 Military Tpke | 0.34mi | 3/2.0 | 1,064 (-10%) | 2mo | $75,000 | $70 | 65 |
| 20 Cherry St | 0.47mi | 3/2.0 | 1,120 (-6%) | 6mo | $40,000 | $36 | 64 |
| 1254 Military Tpke | 0.44mi | 3/1.5 | 1,296 (+9%) | 17mo | $94,900 | $73 | 48 |
Match score weights: distance 35% · size 25% · config 20% · recency 20%. Top-matched comps best support the ARV.
Projected returns pro-forma
-3.0% appreciation · 3.0% rent growth · sell at horizon
- IRR
- -15.8%
- Equity multiple
- 0.44×
- Total profit
- $-28,235
- Equity at exit
- $26,689
- IRR
- -7.4%
- Equity multiple
- 0.53×
- Total profit
- $-23,450
- Equity at exit
- $15,477
Cash invested: $50,120 (down + closing). Projections, not guarantees.
Landlord ↔ Tenant lean methodology
- Overall (STATE)
- 15 Strongly Tenant-Friendly
- State New York
- 15 Strongly Tenant-Friendly · D+10
- County
- — inherits STATE
- City
- — inherits STATE
ZIP-level market 12901
- Home prices YoY
- -22.5%
- Active inventory
- 184
- Price-to-rent
- 9.1×
Monthly cashflow live
- Estimated rent
- $1,636 medium interval (Pro) →
- Mortgage (P&I)
- −$939
- Tax from tax record
- −$268 /mo · $3,212/yr
- Insurance
- −$75
- HOA
- −$0
- Vacancy / Maint / Mgmt
- −$344
- Net cashflow
- $11
Break-even live
Sensitivity live
| Price | -10% $113 | -5% $62 | +0% $11 | +5% $-39 | +10% $-90 |
|---|---|---|---|---|---|
| Rent | -10% $-118 | -5% $-53 | +0% $11 | +5% $76 | +10% $141 |
| Rate | -1.0pp $101 | -0.5pp $57 | base $11 | +0.5pp $-35 | +1.0pp $-82 |
UW: 25.0% down · 7.5% · 30yr · 1.5% tax · 5.0% vac · 8.0% maint · 8.0% mgmt
Financing live
Cash to close
- Down payment
- $44,750
- Closing costs
- $5,370
- Reserves months
- —
- Total cash needed
- —
Loan-product check · same deal, 3 products live
Conventional
25% down · 7.5% · 30yr
- Down + closing
- —
- Monthly P&I
- —
- Monthly cashflow
- —
- DSCR
- —
- Eligible?
- —
Personal DTI + credit; lowest rate.
DSCR
20% down · 8.5% · 30yr
- Down + closing
- —
- Monthly P&I
- —
- Monthly cashflow
- —
- DSCR
- —
- Eligible?
- —
No personal income docs; deal must DSCR.
Hard money
10% down · 12.0% · 12mo
- Down + closing
- —
- Monthly P&I
- —
- Monthly cashflow
- —
- DSCR
- —
- Eligible?
- —
Short-term bridge; refi at stabilization.
Listing history 24 events
-
2026-06-22days on market $179,000 Active 75 DOM
-
2026-06-21days on market $179,000 Active 74 DOM
-
2026-06-21pricedays on market $179,000 Active 73 DOM
-
2026-06-18days on market $189,000 Active 71 DOM
-
2026-06-17days on market $189,000 Active 70 DOM
-
2026-06-16days on market $189,000 Active 69 DOM
-
2026-06-15days on market $189,000 Active 68 DOM
-
2026-06-13days on market $189,000 Active 66 DOM
-
2026-06-12days on market $189,000 Active 65 DOM
-
2026-06-09days on market $189,000 Active 62 DOM
-
2026-06-08days on market $189,000 Active 61 DOM
-
2026-06-07days on market $189,000 Active 60 DOM
-
2026-06-07days on market $189,000 Active 59 DOM
-
2026-06-04days on market $189,000 Active 56 DOM
-
2026-06-02days on market $189,000 Active 55 DOM
-
2026-06-01days on market $189,000 Active 54 DOM
-
2026-05-31days on market $189,000 Active 53 DOM
-
2026-05-08price $189,000 382-char remark
Show marketing remark (382 chars)
Affordable, single floor living! Spacious, fenced in back yard with large deck for enjoying your morning coffee or evening beverage. Close to Town & City amenities. Central air conditioning to keep cool on those hot summer nights. Two sheds for storage. Updated flooring through most of the house. Updated kitchen includes stainless steel appliances! Schedule a showing today!
-
2026-04-08$199,000 Active 382-char remark
Show marketing remark (382 chars)
Affordable, single floor living! Spacious, fenced in back yard with large deck for enjoying your morning coffee or evening beverage. Close to Town & City amenities. Central air conditioning to keep cool on those hot summer nights. Two sheds for storage. Updated flooring through most of the house. Updated kitchen includes stainless steel appliances! Schedule a showing today!
-
2022-06-28soldstatus $129,000
-
2022-06-22soldstatus $129,000 143-char remark
Show marketing remark (143 chars)
Well maintained home with an open concept. Primary suite has full bath. Deck overlooks the private backyard. Close to shopping and restaurants.
-
2022-05-03$120,000 143-char remark
Show marketing remark (143 chars)
Well maintained home with an open concept. Primary suite has full bath. Deck overlooks the private backyard. Close to shopping and restaurants.
-
2013-08-15soldstatus $77,000
-
2003-06-17soldstatus $19,900
ⓘ Source: listings_history table (triggers on properties + properties_extension) + one-shot
backfill from property_details.listing_events for pre-trigger history.
Tax reassessment forecast NY · Partial reset (capped growth)
- Current annual tax
- $3,212 · $268/mo
- Projected year-2 tax
- $3,212 · $268/mo
- Expected delta
- $0/yr ($0/mo · 0.0%)
ⓘ Screening estimate from a state-policy table — verify with the county assessor before closing.
Climate risk First Street
- Flood 1/10 Low FEMA zone X (unshaded) · 0% chance over 30 yrs
- Wildfire 3/10 Moderate
- Heat 3/10 Moderate 7 d/yr ≥93°F today · 15 d/yr by 30 yrs out
- Wind 1/10 Low 100% chance of damaging wind over 30 yrs
- Air quality 2/10 Low 1 unhealthy d/yr today · 1 by 30 yrs out
Nearby sold comps map
Loading sold comps map…
Walkable amenities ~0.75 mi
Loading nearby amenities…
Taxation est. · year 1
- Rental income
- $19,629
- − Mortgage interest
- −$10,027
- − Property taxes
- −$3,212
- − Insurance
- −$895
- − Repairs & maintenance
- −$1,570
- − Management
- −$1,570
- − Depreciation
- −$5,207
- Taxable loss
- −$2,853
- Est. tax savings @ 24.0%
- +$685
- After-tax cash flow
- $820/yr
For passive investors: Depreciation is non-cash, so a rental often shows a tax loss while cash-flowing — sheltering income. Rental losses are passive: they offset passive income freely, and up to $25,000/yr can offset ordinary (W-2) income if you actively participate and your MAGI is under $100k (phasing out to $0 by $150k); unused losses carry forward. On sale, claimed depreciation is recaptured at up to 25%, and gains may owe capital-gains tax (a 1031 exchange can defer both). Figures are a year-1 estimate at your 24.0% rate — not tax advice; consult a CPA.
Schools (NCES district)
- District
- Beekmantown Central School District
- NCES district ID
- 3604290
- Math proficiency
- 45% ▲ 2.00%
- Reading proficiency
- 57% ▲ 18.00%
- Median HH income
- $53,577
- Composite
- 43.91/100
- National rank
- #2914
- State rank
- #360 of 590 in NY
Livability — Plattsburgh West
- Score
- 65/100
- State rank
- #679
- US rank
- #12797
Category grades
Schools grade is shown separately in the Schools card above.
Census & demographics
- Census place
- Plattsburgh West, NY
- Population (ZIP)
- 32,012
Population outlook (Clinton County) Hauer SSP2
- Today (2025)
- 78,791 people
- By 2030
- 76,848 · -2.5%
- By 2040
- 71,579 · -9.2%
- By 2050
- 66,471 · -15.6%
- By 2075
- 57,361 · -27.2%
- By 2100
- 47,232 · -40.1%
Race, ethnicity, and origin ACS 2023
- Neighborhood character
- Predominantly White (87%)
- Race & ethnicity
- White 87% Two or more races 5% Hispanic / Latino 4% Black 3% Asian 3%
- Common ancestry
- Lithuanian 15% Romanian 3% Slovak 2%
- Foreign-born
- 6% · Canada, China
- Languages at home
- 92% English-only · Spanish 2% French/Haitian/Cajun 2% Other Indo-European 1%
Political lean MEDSL · Clinton
- 2024 margin
- Toss-up / Even · D 48.9% · R 51.1%
- 2008→2024 swing
- -25.1pp toward R · 2008: 22.9pp · 2024: -2.2pp
- All cycles
- 2024: R+2.2 2020: D+5.2 2016: D+0.9 2012: D+25.6 2008: D+22.9
Not yet ingested
- Civics
- —
Market trends
- HPI YoY
- ▼ -73.55%
- Current HPI
- 252.8692
- Rent YoY
- —
- Metro
- —
- State GDP YoY
- ▲ 2.60%
- F500 in state
- 92
Industry mix (Fortune 500 HQ in NY)
| Industry | F500 HQs | Revenue |
|---|---|---|
| Financial Services | 10 | $950B |
|
||
| Consumer Goods | 9 | $162B |
|
||
| Insurance | 4 | $225B |
|
||
| Telecommunications | 2 | $144B |
|
||
| Pharmaceuticals | 2 | $112B |
|
||
| Media / Entertainment | 2 | $69B |
|
||
Price history
+849.7% since first listed7 events — show timeline
- 2026-05-08 Price Changed $189,000 ACVMLS
- 2026-04-08 Listed $199,000 ACVMLS
- 2022-06-28 Sold (Public Records) $129,000 Public Records
- 2022-06-22 Sold (MLS) $129,000 ACVMLS
- 2022-05-03 Listed $120,000 ACVMLS
- 2013-08-15 Sold (Public Records) $77,000 Public Records
- 2003-06-17 Sold (Public Records) $19,900 Public Records
Property tax history
+6.1%/yrLatest (2025): $3,212 · +9.0% YoY. Source: county tax records.
Cash-flow waterfall
monthlySold comps — $/sqft
last 12 mo · ≤1 miLoading sold comps…