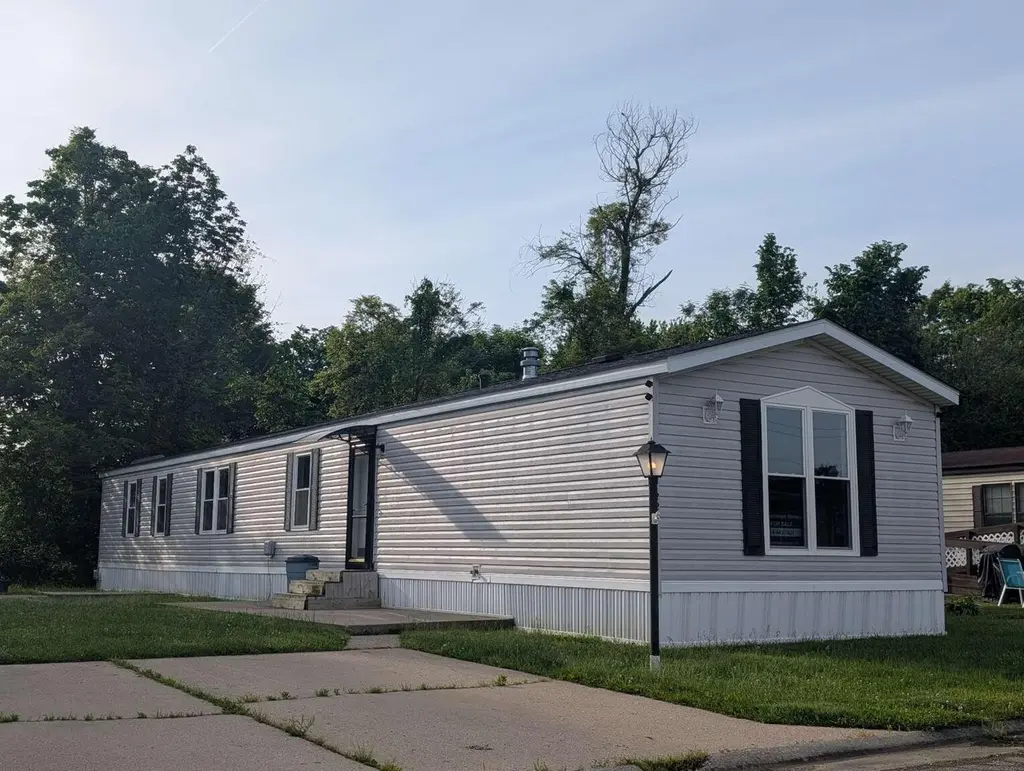
8764 National Rd SW Lot 122 · Etna, OH
Flood risk 1/10 · Minimal
- FEMA flood zone
- X (unshaded)
- Chance of flooding over 30 yrs
- 0.0%
- Est. flood insurance / yr
- $473 – $860
Fire risk 1/10 · Minimal
- Est. fire insurance / yr
- $713 – $1,323
Heat risk 3/10 · Minor
- Hot days now (above 98°F)
- 7 days/yr
- Hot days in 30 yrs
- 18 days/yr
Wind risk 2/10 · Minimal
- Chance of severe wind over 30 yrs
- 1.0%
Air-quality risk 2/10 · Minimal
- Unhealthy air days now
- 1 days/yr
- Unhealthy air days in 30 yrs
- 2 days/yr
Risk factors via First Street. Map © Google.
Why this score? — see what drove the B- grade
The composite is a weighted blend of 9 inputs, each scored 0–100. Each bar is that input's sub-score; the figure is the points it added to the 100-point composite (weight × sub-score).
- Cash flow +30.0/30.0
- 1% rule +10.0/10.0
- DSCR +10.0/10.0
- Schools +5.4/10.0
- Condition / age +3.8/5.0
- Livability +3.7/5.0
- Rent growth +2.5/5.0
- ARV discount +0.0/15.0
- Appreciation +0.0/10.0
$74,900
🖨 Deal sheet 📄 Offer letter ✓ Due diligence
Listing remarks
Welcome home to this beautifully updated 2000 Redman 16x80 manufactured home located in desirable Willowbrook Terrace Manufactured Housing Community! Offering approximately 1,216 sq. ft. of living space, this spacious home features 3 bedrooms and 2 full baths with updates throughout. Enjoy peace of mind with a new roof, new furnace and new central A/C, along with newer windows, fresh paint, and new flooring throughout. This move-in ready home combines comfort, style and value at an affordable price.
Key facts
- New furnace
- Fresh paint
- Newer windows
Tags
Property features AI
Finance
- HOA & community: Homeowners association with a $500 monthly fee; HOA covers trash and snow removal; Association contact: 614-597-1038
Exterior
- Utilities: Public water; Public sewer
- Home design: One-story home; Other residential without deeded land
- Construction: Built in 2000; No common walls
- Exterior features: Other foundation
Interior
- Bedrooms: Three main-level bedrooms
- Bathrooms: Two full bathrooms
- Interior features: Living area approximately 1,216
Neighborhood map
What this means for you Summary
Snapshot
- This is a 3-bed/2.0-bath single-family listed at $75k. Condition is rated good.
Deal economics
- At list price, monthly cash flow is $991 ($12k/yr) — positive.
- The deal already cash-flows at list — no discount required.
- Meets the 1% rule at list price ($3k rent vs $75k).
- Recommended offer: $74k (1.5% below list) — sets the bar for market timing.
Location & tenants
- Location reads 73/100 on livability (#309 in OH) — a middle-class / working-renter tenant base. Strengths: crime A+, employment A+, cost of living A+; Watch: schools D, amenities F, commute F.
- Southwest Licking Local (rural): math 59% / reading 62% proficiency, ranked #243 of 656 in OH (top 37%) — acceptable for families but not a draw, mixed tenant base, ~2y average lease.
- Market conditions: 160 active listings in the ZIP; 2 comparable units currently listed for rent nearby; solid renter incomes; 159 units permitted in Licking County in 2024 (0 in 5+ unit buildings).
Forward outlook
- Local home prices are declining (-3.0%/yr); year-one equity from $518 of loan paydown is wiped out by about $2k of value loss. Plan a longer hold.
- At projected returns (-3.0% appreciation + 3.0% rent growth), your $21k cash investment doubles in ~2 years — after that, you're playing with house money.
Negotiation context
- It's been on market 20 days — a 2% lower offer ($74k) is reasonable based on typical stale-listing flexibility.
Questions for the listing agent
- What does the HOA fee cover, when was the last increase, and are there any pending special assessments or reserve-fund shortfalls?
- Is there a deadline driving the sale (1031 exchange, divorce, estate, relocation)? That informs how much negotiation room exists.
- Schools are D-rated, which usually means shorter tenancies and higher turnover. Who's the typical renter profile here, and what's been the actual vacancy rate?
- What's the average days-on-market for RENTAL listings here right now (not sales)? A rising rental-DOM trend means longer vacancies and softer asking-rent achievability than the comps imply.
- What's the recent tenant-quality profile in this submarket — average credit score on applications, eviction rate, late-payment / NSF rate, and stable-employment percentage? A property-management company in the area should have these aggregated.
- How much new for-sale + rental construction is in the pipeline within 1–3 miles? Heavy new supply typically softens prices + rents 12–24 months out; constrained supply supports both.
Investment metrics
- 1% rule
- 3.40% ✓
- Cap rate
- 22.18%
- Cash-on-cash
- 56.72%
- DSCR
- 3.52
- GRM
- 2.5
CMA / ARV
- ARV (on-the-fly)
- $57,152
- Comps found
- 3
Show comp detail 3 sales within ~0.75 mi
| Address | Dist | Beds/Ba | Sqft | Sold | Price | $/sf | Match |
|---|---|---|---|---|---|---|---|
| 8764 National Rd SW #118 | 0.00mi | 3/2.0 | 1,120 (-8%) | 8mo | $44,850 | $40 | 80 |
| 8764 National Rd SW #143 | 0.17mi | 3/2.0 | 1,216 (0%) | 17mo | $62,500 | $51 | 78 |
| 8764 National Rd SW Lot 105 | 0.08mi | 3/2.0 | 1,216 (0%) | 23mo | $56,850 | $47 | 77 |
Match score weights: distance 35% · size 25% · config 20% · recency 20%. Top-matched comps best support the ARV.
Projected returns pro-forma
-3.0% appreciation · 3.0% rent growth · sell at horizon
- IRR
- 55.3%
- Equity multiple
- 3.45×
- Total profit
- $51,348
- Equity at exit
- $11,168
- IRR
- 60.4%
- Equity multiple
- 7.08×
- Total profit
- $127,419
- Equity at exit
- $6,476
Cash invested: $20,972 (down + closing). Projections, not guarantees.
Landlord ↔ Tenant lean methodology
- Overall (STATE)
- 73 Landlord-Friendly
- State Ohio
- 73 Landlord-Friendly · R+6
- County
- — inherits STATE
- City
- — inherits STATE
ZIP-level market 43062
- Active inventory
- 160
- Price-to-rent
- 2.5×
Monthly cashflow live
- Estimated rent
- $2,543 medium interval (Pro) →
- Mortgage (P&I)
- −$393
- Tax est. 1.5%
- −$94 /mo · $1,124/yr
- Insurance
- −$31
- HOA
- −$500
- Vacancy / Maint / Mgmt
- −$534
- Net cashflow
- $991
Break-even live
UW: 25.0% down · 7.5% · 30yr · 1.5% tax · 5.0% vac · 8.0% maint · 8.0% mgmt
Financing live
Cash to close
- Down payment
- $18,725
- Closing costs
- $2,247
- Reserves months
- —
- Total cash needed
- —
Loan-product check · same deal, 3 products live
Conventional
25% down · 7.5% · 30yr
- Down + closing
- —
- Monthly P&I
- —
- Monthly cashflow
- —
- DSCR
- —
- Eligible?
- —
Personal DTI + credit; lowest rate.
DSCR
20% down · 8.5% · 30yr
- Down + closing
- —
- Monthly P&I
- —
- Monthly cashflow
- —
- DSCR
- —
- Eligible?
- —
No personal income docs; deal must DSCR.
Hard money
10% down · 12.0% · 12mo
- Down + closing
- —
- Monthly P&I
- —
- Monthly cashflow
- —
- DSCR
- —
- Eligible?
- —
Short-term bridge; refi at stabilization.
Rent comps 2 comps
| Address | Beds | Baths | Sqft | Rent | $/sqft | DOM | Units | Dist |
|---|---|---|---|---|---|---|---|---|
| 9526 Watkins Rd SW Etna, OH | 3.0 | 2.0 | 1372 | $2,500 | $1.82 | 21d | 1 | 0.63mi |
| 9760 Ashley River DR Etna, OH | 1.0–3.0 | 1.0–2.0 | 917 | $2,090 | $2.28 | 2d | 1 | 1.45mi |
HOA detail
- Monthly dues
- $500 · $6,000/yr
Listing history 15 events
-
2026-06-18days on market $74,900 Active 20 DOM
-
2026-06-17days on market $74,900 Active 19 DOM
-
2026-06-16days on market $74,900 Active 18 DOM
-
2026-06-15days on market $74,900 Active 17 DOM
-
2026-06-13days on market $74,900 Active 15 DOM
-
2026-06-13days on market $74,900 Active 14 DOM
-
2026-06-09days on market $74,900 Active 11 DOM
-
2026-06-08days on market $74,900 Active 10 DOM
-
2026-06-07days on market $74,900 Active 9 DOM
-
2026-06-05days on market $74,900 Active 6 DOM
-
2026-06-03days on market $74,900 Active 5 DOM
-
2026-06-02days on market $74,900 Active 4 DOM
-
2026-06-01days on market $74,900 Active 3 DOM
-
2026-05-31days on market $74,900 Active 2 DOM
-
2026-05-29$74,900 Active
ⓘ Source: listings_history table (triggers on properties + properties_extension) + one-shot
backfill from property_details.listing_events for pre-trigger history.
Climate risk First Street
- Flood 1/10 Low FEMA zone X (unshaded) · 0% chance over 30 yrs
- Wildfire 1/10 Low
- Heat 3/10 Moderate 7 d/yr ≥98°F today · 18 d/yr by 30 yrs out
- Wind 2/10 Low 100% chance of damaging wind over 30 yrs
- Air quality 2/10 Low 1 unhealthy d/yr today · 2 by 30 yrs out
Nearby sold comps map
Loading sold comps map…
Walkable amenities ~0.75 mi
Loading nearby amenities…
Taxation est. · year 1
- Rental income
- $30,516
- − Mortgage interest
- −$4,196
- − Property taxes
- −$1,124
- − Insurance
- −$374
- − Repairs & maintenance
- −$2,441
- − Management
- −$2,441
- − HOA
- −$6,000
- − Depreciation
- −$2,179
- Taxable income
- $11,761
- Est. tax owed @ 24.0%
- −$2,823
- After-tax cash flow
- $9,074/yr
For passive investors: Depreciation is non-cash, so a rental often shows a tax loss while cash-flowing — sheltering income. Rental losses are passive: they offset passive income freely, and up to $25,000/yr can offset ordinary (W-2) income if you actively participate and your MAGI is under $100k (phasing out to $0 by $150k); unused losses carry forward. On sale, claimed depreciation is recaptured at up to 25%, and gains may owe capital-gains tax (a 1031 exchange can defer both). Figures are a year-1 estimate at your 24.0% rate — not tax advice; consult a CPA.
Condition & rehab AI · 12 photos
This move-in ready manufactured home offers a good condition with minor updates needed to enhance its resale and rental value.
Repairs flagged
- Minor Kitchen cabinets — Worn appearance
- Minor Bathroom fixtures — Dated appearance
Value-add opportunities
- Both Paint fresh coat — Enhances curb appeal and interior
- Both Replace worn cabinets — Improves functionality and aesthetics
- Both Update bathroom fixtures — Enhances functionality and aesthetics
Renovation cost estimate screening
| Repair item | Severity | Est. cost |
|---|---|---|
| Kitchen cabinets · Worn appearance | Minor | $500–3,000 |
| Bathroom fixtures · Dated appearance | Minor | $500–3,000 |
| Total estimated repair cost · 2 items | $1,000–6,000 |
Value-add ROI direction
- Both Paint fresh coat — Enhances curb appeal and interior ↑
- Both Replace worn cabinets — Improves functionality and aesthetics ↑
- Both Update bathroom fixtures — Enhances functionality and aesthetics ↑
ⓘ Cost ranges are severity-bucket heuristics (US national rule-of-thumb). Get contractor quotes + a written scope before underwriting a rehab budget.
Schools (NCES district)
- District
- Southwest Licking Local
- NCES district ID
- 3904804
- Math proficiency
- 59% ▼ -13.00%
- Reading proficiency
- 62% ▼ -9.00%
- Median HH income
- $72,711
- Composite
- 53.66/100
- National rank
- #1432
- State rank
- #243 of 656 in OH
Livability — Etna
- Score
- 73/100
- State rank
- #309
- US rank
- #5007
Category grades
Schools grade is shown separately in the Schools card above.
Census & demographics
- County
- Licking County · 109,194 people
- Metro
- Columbus, OH
- Population (ZIP)
- 32,037
- Household income
- $105,968
- Rent vs Own
- Severe rent burden
- 316.0
Population outlook (Licking County) Hauer SSP2
- Today (2025)
- 178,210 people
- By 2030
- 180,917 · +1.5%
- By 2040
- 183,885 · +3.2%
- By 2050
- 182,985 · +2.7%
- By 2075
- 178,377 · +0.1%
- By 2100
- 161,075 · -9.6%
Race, ethnicity, and origin ACS 2023
- Neighborhood character
- Predominantly White (79%)
- Race & ethnicity
- White 79% Asian 8% Two or more races 6% Black 5% Hispanic / Latino 4%
- Common ancestry
- Slovak 3% Romanian 2% Scotch-Irish 2%
- Foreign-born
- 9% · India, Canada
- Languages at home
- 88% English-only · Other Indo-European 7% Spanish 2% Arabic 1%
Political lean MEDSL · Licking
- 2024 margin
- Solid R (+30.0) · D 34.5% · R 64.6%
- 2008→2024 swing
- -14.2pp toward R · 2008: -15.8pp · 2024: -30.0pp
- All cycles
- 2024: R+30.0 2020: R+28.1 2016: R+28.9 2012: R+14.7 2008: R+15.8
Not yet ingested
- Civics
- —
Market trends
- HPI YoY
- ▼ -255.15%
- Current HPI
- 236.5135
- Rent YoY
- —
- Metro
- Columbus, OH
- State GDP YoY
- ▲ 1.98%
- F500 in state
- 48
Industry mix (Fortune 500 HQ in OH)
| Industry | F500 HQs | Revenue |
|---|---|---|
| Insurance | 3 | $145B |
|
||
| Industrial Machinery | 3 | $49B |
|
||
| Financial Services | 3 | $24B |
|
||
| Consumer Goods | 2 | $93B |
|
||
| Aerospace / Defense | 2 | $47B |
|
||
| Utilities | 2 | $33B |
|
||
Price history
1 event — show timeline
- 2026-05-29 Listed $74,900 CBRMLS
Cash-flow waterfall
monthlySold comps — $/sqft
last 12 mo · ≤1 miLoading sold comps…