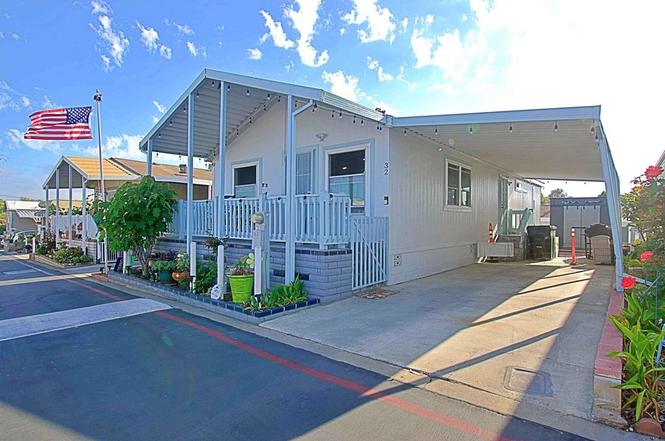
2181 Avenida del Mexico #32 · San Diego, CA
Flood risk 1/10 · Minimal
- FEMA flood zone
- X (unshaded)
- Chance of flooding over 30 yrs
- 0.0%
- Est. flood insurance / yr
- $507 – $1,088
Fire risk 4/10 · Minor
- Est. fire insurance / yr
- $659 – $1,223
Heat risk 4/10 · Minor
- Hot days now (above 86°F)
- 7 days/yr
- Hot days in 30 yrs
- 20 days/yr
Wind risk 1/10 · Minimal
- Chance of severe wind over 30 yrs
- —
Air-quality risk 1/10 · Minimal
- Unhealthy air days now
- 0 days/yr
- Unhealthy air days in 30 yrs
- 0 days/yr
Risk factors via First Street. Map © Google.
Why this score? — see what drove the D grade
The composite is a weighted blend of 9 inputs, each scored 0–100. Each bar is that input's sub-score; the figure is the points it added to the 100-point composite (weight × sub-score).
- Cash flow +18.7/30.0
- DSCR +5.9/10.0
- 1% rule +5.0/10.0
- Schools +3.9/10.0
- Livability +3.8/5.0
- Condition / age +3.8/5.0
- Rent growth +2.4/5.0
- ARV discount +0.0/15.0
- Appreciation +0.0/10.0
$249,900
🖨 Deal sheet 📄 Offer letter ✓ Due diligence
Listing remarks
Nestled in a desirable all-ages manufactured home community in South San Diego, this home was remodeled in 2020 and offers designer finishes, quality craftsmanship, and exceptional value. At the heart of the home, the beautifully redesigned kitchen showcases premium quartzite countertops and backsplash, a stunning quartzite waterfall island, custom-built kitchen cabinetry, and an apron-front farmhouse sink. Additional interior highlights include a functional laundry room featuring custom-built cabinetry for additional storage. Throughout the home, you’ll find smooth-finished walls and ceilings, energy-efficient dual-pane windows with custom window trim, finished window sills, and prem
Key facts
- Remodeled in 2020
- 2,000 sq ft lot
- 2 parking spots
Tags
Property features AI
Finance
- Other: Living area source: Public records; Lot size source: Estimated; Park directions available
- HOA & community: Community features: Urban; Land lease: $1,185
Exterior
- Parking: 2 carport spaces; 2 total parking spaces; Located in Sunset View park
- Utilities: Public sewer
- Home design: Mobile home (20' x 48') remains on site; Single-story
- Construction: Mobile home construction
- Exterior features: No pool; Lot estimated as 0–1 unit/acre
Interior
- Kitchen: Kitchen (public records listed)
- Bathrooms: 2 full bathrooms
- Heating & cooling: Central cooling
- Interior features: One-level home; Front entry; Has a view
- Laundry & utility: Laundry in an individual room
Neighborhood map
What this means for you Summary
Snapshot
- This is a 2-bed/2.0-bath manufactured listed at $250k. Condition is rated good.
Deal economics
- At list price, monthly cash flow is $246 ($3k/yr) — positive.
- The deal already cash-flows at list — no discount required.
- To meet the 1% rule (rent ≥ 1% of price), the offer needs to be $250k (0.1% below list).
- Recommended offer: $250k (0.1% below list) — sets the bar for 1% rule.
- Cap rate 7.5% vs local median 2.0% in San Diego — top-decile yield for the area; either an underpriced asset or a hidden risk that comps aren't pricing in. Stress-test before assuming the spread holds.
Location & tenants
- Location reads 75/100 on livability (#123 in CA, #4,206 nationally) — a middle-class / working-renter tenant base. Strengths: amenities A+, commute A+, employment A+; Watch: health & safety C-, crime D+, cost of living F.
- Sweetwater Union High (suburban): math 36% / reading 52% proficiency, ranked #187 of 517 in CA (top 36%) — families likely to look elsewhere, expect single-tenant / working-renter base with shorter leases.
- Market conditions: Rents soft (-0.5%/yr); 210 active listings in the ZIP; 40 comparable units currently listed for rent nearby; rentals leasing fast (median 2d on market — plan ~1-2 weeks tenant-placement turnaround); solid renter incomes; 11,759 units permitted in San Diego County in 2024 (7,244 in 5+ unit buildings).
- This rent runs 32% of the median local income ($95k/yr) — at the standard rent-burdened threshold; future hikes will face affordability resistance.
Forward outlook
- Local home prices are declining (-3.0%/yr); year-one equity from $2k of loan paydown is wiped out by about $7k of value loss. Plan a longer hold.
- San Diego County population projected at +20% by 2050 — long-run rental-demand tailwind backs the buy-and-hold thesis.
Negotiation context
- Only 1 days on market — expect competitive offers; lowballing is unlikely to land.
Questions for the listing agent
- Is there a deadline driving the sale (1031 exchange, divorce, estate, relocation)? That informs how much negotiation room exists.
- Schools are B-rated — typically a magnet for longer-tenancy family renters. What's the average tenant stay here, and is there a school-zone premium baked into asking?
- Crime grade is D in this area — have there been break-ins, vandalism, or insurance claims at this property in the last 3 years? What carrier currently insures it and at what premium?
- The area grade is low — what's the realistic commute time and amenity access for the typical tenant pool here? Any planned neighborhood developments (good or bad) we should know about?
- What's the average days-on-market for RENTAL listings here right now (not sales)? A rising rental-DOM trend means longer vacancies and softer asking-rent achievability than the comps imply.
- What's the recent tenant-quality profile in this submarket — average credit score on applications, eviction rate, late-payment / NSF rate, and stable-employment percentage? A property-management company in the area should have these aggregated.
- How much new for-sale + rental construction is in the pipeline within 1–3 miles? Heavy new supply typically softens prices + rents 12–24 months out; constrained supply supports both.
Investment metrics
- 1% rule
- 1.00% ✗
- Cap rate
- 7.47%
- Cash-on-cash
- 4.21%
- DSCR
- 1.19
- GRM
- 8.3
CMA / ARV
- ARV (on-the-fly)
- $212,160
- Comps found
- 5
Show comp detail 5 sales within ~0.75 mi
| Address | Dist | Beds/Ba | Sqft | Sold | Price | $/sf | Match |
|---|---|---|---|---|---|---|---|
| 874 Hollister St #54 | 0.15mi | 3/2.0 (+1) | 1,040 (+8%) | 16mo | $230,000 | $221 | 61 |
| 2626 Coronado Ave #4 | 0.67mi | 2/2.0 | 940 (-2%) | 16mo | $242,260 | $258 | 52 |
| 1023 OUTER Rd #56 | 0.40mi | 3/2.0 (+1) | 1,040 (+8%) | 20mo | $230,000 | $221 | 46 |
| 1165 Hollister St Spc 26 | 0.49mi | 3/2.0 (+1) | 840 (-12%) | 7mo | $140,000 | $167 | 45 |
| 2626 Coronado Ave #66 | 0.67mi | 2/2.0 | 1,080 (+12%) | 22mo | $217,000 | $201 | 29 |
Match score weights: distance 35% · size 25% · config 20% · recency 20%. Top-matched comps best support the ARV.
Projected returns pro-forma
-3.0% appreciation · 0.0% rent growth · sell at horizon
- IRR
- -13.1%
- Equity multiple
- 0.54×
- Total profit
- $-32,136
- Equity at exit
- $37,261
- IRR
- -9.7%
- Equity multiple
- 0.49×
- Total profit
- $-35,973
- Equity at exit
- $21,607
Cash invested: $69,972 (down + closing). Projections, not guarantees.
Landlord ↔ Tenant lean methodology
- Overall (STATE)
- 18 Strongly Tenant-Friendly
- State California
- 18 Strongly Tenant-Friendly · D+13
- County
- — inherits STATE
- City
- — inherits STATE
ZIP-level market 92154
- Rents YoY
- -0.5%
- Active inventory
- 210
- Price-to-rent
- 8.3×
Monthly cashflow live
- Estimated rent
- $2,497 high interval (Pro) →
- Mortgage (P&I)
- −$1,311
- Tax est. 1.5%
- −$312 /mo · $3,748/yr
- Insurance
- −$104
- HOA
- −$0
- Vacancy / Maint / Mgmt
- −$524
- Net cashflow
- $246
Break-even live
UW: 25.0% down · 7.5% · 30yr · 1.5% tax · 5.0% vac · 8.0% maint · 8.0% mgmt
Financing live
Cash to close
- Down payment
- $62,475
- Closing costs
- $7,497
- Reserves months
- —
- Total cash needed
- —
Loan-product check · same deal, 3 products live
Conventional
25% down · 7.5% · 30yr
- Down + closing
- —
- Monthly P&I
- —
- Monthly cashflow
- —
- DSCR
- —
- Eligible?
- —
Personal DTI + credit; lowest rate.
DSCR
20% down · 8.5% · 30yr
- Down + closing
- —
- Monthly P&I
- —
- Monthly cashflow
- —
- DSCR
- —
- Eligible?
- —
No personal income docs; deal must DSCR.
Hard money
10% down · 12.0% · 12mo
- Down + closing
- —
- Monthly P&I
- —
- Monthly cashflow
- —
- DSCR
- —
- Eligible?
- —
Short-term bridge; refi at stabilization.
Rent comps 40 comps
| Address | Beds | Baths | Sqft | Rent | $/sqft | DOM | Units | Dist |
|---|---|---|---|---|---|---|---|---|
| 2055 Avenida Del Mexico Apt 208 San Diego, CA | 2.0 | 2.0 | 960 | $2,300 | $2.40 | 16d | 1 | 0.19mi |
| 768 Hollister St San Diego, CA | 2.0 | 2.0 | 840 | $2,300 | $2.74 | 1d | 1 | 0.22mi |
| 1945 Avenida del Mexico #244 San Diego, CA | 1.0 | 1.0 | 650 | $2,395 | $3.68 | 1d | 1 | 0.23mi |
| 1945 Avenida del Mexico #141 San Diego, CA | 1.0 | 1.0 | 650 | $2,195 | $3.38 | 1d | 1 | 0.23mi |
| 1939 Avenida Del Mexico San Diego, CA | 1.0 | 1.0 | 650 | $2,295 | $3.53 | 1d | 2 | 0.24mi |
| 1949 Avenida del Mexico #237 San Diego, CA | 1.0 | 1.0 | 650 | $2,295 | $3.53 | 19d | 1 | 0.24mi |
| 1910 Avenida del Mexico San Diego, CA | 1.0 | 1.0 | 655 | $1,820 | $2.78 | 3d | 1 | 0.30mi |
| 1910 Avenida del Mexico #205 San Diego, CA | 2.0 | 2.0 | 885 | $2,595 | $2.93 | 1d | 1 | 0.30mi |
| 1001 Outer Rd San Diego, CA | 2.0 | 2.0 | 1000 | $2,538 | $2.54 | 1d | 5 | 0.30mi |
| 736 18th St San Diego, CA | 2.0 | 1.0 | 880 | $3,400 | $3.86 | 19d | 1 | 0.44mi |
| 1063 18th St San Diego, CA | 2.0 | 1.0 | 1050 | $3,100 | $2.95 | 1d | 1 | 0.47mi |
| 2367 Grove Ave San Diego, CA | 1.0 | 1.0 | 602 | $2,150 | $3.57 | 17d | 1 | 0.68mi |
| 2367 Grove Ave San Diego, CA | 1.0–2.0 | 1.0 | 741 | $2,495 | $3.36 | 1d | 4 | 0.68mi |
| 933 15th St San Diego, CA | 3.0 | 2.0 | 1050 | $3,350 | $3.19 | 1d | 1 | 0.75mi |
| 1394 Oro Vista Rd San Diego, CA | 2.0–3.0 | 2.0 | 1088 | $2,725 | $2.50 | 1d | 4 | 0.79mi |
| 1042 15th St Unit Del Coronado Villas San Diego, CA | 2.0 | 1.0 | 1000 | $2,300 | $2.30 | 1d | 1 | 0.81mi |
| 1042 15th St Unit 1 bedroom RENT SPECIAL San Diego, CA | 1.0 | 1.0 | 700 | $1,950 | $2.79 | 1d | 1 | 0.82mi |
| 1042 15th St San Diego, CA | 1.0–2.0 | 1.0 | 850 | $2,300 | $2.71 | 4d | 2 | 0.83mi |
| 1485 Elder Ave San Diego, CA | 1.0 | 1.0 | 550 | $1,795 | $3.26 | 1d | 1 | 0.84mi |
| 1435 Elder Ave San Diego, CA | 1.0 | 1.0 | 640 | $1,950 | $3.05 | 1d | 2 | 0.91mi |
| 1055 Georgia St Imperial Beach, CA | 2.0 | 1.0 | 770 | $2,150 | $2.79 | 10d | 4 | 0.97mi |
| 924 Georgia St Imperial Beach, CA | 3.0 | 2.0 | 1083 | $3,295 | $3.04 | 1d | 1 | 0.98mi |
| 1471 Grove Ave Imperial Beach, CA | 2.0 | 2.0 | 850 | $2,675 | $3.15 | 1d | 5 | 1.00mi |
| 835 13th St Unit 851D Imperial Beach, CA | 1.0 | 1.0 | 600 | $1,800 | $3.00 | 1d | 1 | 1.01mi |
| 835 13th St Unit 859F Imperial Beach, CA | 1.0 | 1.0 | 600 | $1,795 | $2.99 | 1d | 1 | 1.01mi |
| 1070 Georgia St Unit D Imperial Beach, CA | 2.0 | 2.0 | 850 | $2,600 | $3.06 | 1d | 1 | 1.02mi |
| 966 13th St Imperial Beach, CA | 2.0 | 1.0 | 900 | $2,850 | $3.17 | 17d | 1 | 1.05mi |
| 1391 27th St San Diego, CA | 1.0–2.0 | 1.0–2.0 | 700 | $2,495 | $3.56 | 1d | 3 | 1.07mi |
| 1422 Holly Ave Imperial Beach, CA | 2.0 | 1.0 | 800 | $2,400 | $3.00 | 1d | 1 | 1.07mi |
| 1411 Holly Ave Unit 1413 Holly Imperial Beach, CA | 2.0 | 1.0 | 900 | $2,500 | $2.78 | 20d | 1 | 1.11mi |
| 1555 Satellite Blvd San Diego, CA | 1.0 | 1.0 | 550 | $2,095 | $3.81 | 1d | 5 | 1.12mi |
| 1415 14th St Unit IB VILLAS Imperial Beach, CA | 1.0 | 1.0 | 525 | $1,750 | $3.33 | 1d | 1 | 1.12mi |
| 1415 14th St Imperial Beach, CA | 1.0 | 1.0 | 525 | $1,750 | $3.33 | 4d | 1 | 1.12mi |
| 1150 13th St Unit 202 Imperial Beach, CA | 2.0 | 1.5 | 1000 | $2,300 | $2.30 | 1d | 1 | 1.12mi |
| 1486 15th St Imperial Beach, CA | 2.0 | 1.0 | 858 | $2,400 | $2.80 | 1d | 1 | 1.13mi |
| 1488 15th St Imperial Beach, CA | 2.0 | 1.0 | 828 | $2,250 | $2.72 | 10d | 1 | 1.13mi |
| 1587 Oro Vista Rd San Diego, CA | 1.0–2.0 | 1.0–2.0 | 805 | $2,495 | $3.10 | 1d | 4 | 1.14mi |
| 1086 Florence St Unit L Imperial Beach, CA | 2.0 | 1.0 | 800 | $2,095 | $2.62 | 1d | 1 | 1.16mi |
| 1451 14th St Unit 4 Imperial Beach, CA | 2.0 | 1.0 | 700 | $2,200 | $3.14 | 10d | 1 | 1.16mi |
| 1451 14th St Unit 2 Imperial Beach, CA | 2.0 | 1.5 | 850 | $2,245 | $2.64 | 14d | 1 | 1.16mi |
Listing history 2 events
-
2026-06-18remarks 693-char remark
-
2026-06-18$249,900 Coming Soon 1 DOM
ⓘ Source: listings_history table (triggers on properties + properties_extension) + one-shot
backfill from property_details.listing_events for pre-trigger history.
Climate risk First Street
- Flood 1/10 Low FEMA zone X (unshaded) · 0% chance over 30 yrs
- Wildfire 4/10 Moderate
- Heat 4/10 Moderate 7 d/yr ≥86°F today · 20 d/yr by 30 yrs out
- Wind 1/10 Low
- Air quality 1/10 Low 0 unhealthy d/yr today · 0 by 30 yrs out
Nearby sold comps map
Loading sold comps map…
Walkable amenities ~0.75 mi
Loading nearby amenities…
Taxation est. · year 1
- Rental income
- $29,963
- − Mortgage interest
- −$13,998
- − Property taxes
- −$3,748
- − Insurance
- −$1,250
- − Repairs & maintenance
- −$2,397
- − Management
- −$2,397
- − Depreciation
- −$7,270
- Taxable loss
- −$1,098
- Est. tax savings @ 24.0%
- +$263
- After-tax cash flow
- $3,210/yr
For passive investors: Depreciation is non-cash, so a rental often shows a tax loss while cash-flowing — sheltering income. Rental losses are passive: they offset passive income freely, and up to $25,000/yr can offset ordinary (W-2) income if you actively participate and your MAGI is under $100k (phasing out to $0 by $150k); unused losses carry forward. On sale, claimed depreciation is recaptured at up to 25%, and gains may owe capital-gains tax (a 1031 exchange can defer both). Figures are a year-1 estimate at your 24.0% rate — not tax advice; consult a CPA.
Condition & rehab AI · 4 photos
This well-maintained mobile home in a desirable community has been recently remodeled and offers premium finishes. It is ready for immediate occupancy and minor updates could further enhance its curb appeal and value.
Value-add opportunities
- Both Painting exterior siding — Enhances curb appeal and value
- Both Landscaping improvements — Enhances curb appeal and value
- Both Replace window screens — Improves energy efficiency and aesthetics
Renovation cost estimate screening
Value-add ROI direction
- Both Painting exterior siding — Enhances curb appeal and value ↑
- Both Landscaping improvements — Enhances curb appeal and value ↑
- Both Replace window screens — Improves energy efficiency and aesthetics ↑
ⓘ Cost ranges are severity-bucket heuristics (US national rule-of-thumb). Get contractor quotes + a written scope before underwriting a rehab budget.
Schools (NCES district)
- District
- Sweetwater Union High
- NCES district ID
- 0638640
- Math proficiency
- 36% ▲ 3.00%
- Reading proficiency
- 52% ▼ -2.00%
- Median HH income
- $59,051
- Composite
- 38.61/100
- National rank
- #4158
- State rank
- #187 of 517 in CA
Livability — San Diego
- Score
- 75/100
- State rank
- #123
- US rank
- #4206
Category grades
Schools grade is shown separately in the Schools card above.
Census & demographics
- Census place
- San Diego, CA
- County
- San Diego County · 3,178,799 people
- City population
- 1,397,612
- Metro
- San Diego-Chula Vista-Carlsbad, CA
- Population (ZIP)
- 80,445
- Household income
- $94,901
- Rent vs Own
- Severe rent burden
- 2959.0
Population outlook (San Diego County) Hauer SSP2
- Today (2025)
- 3,678,185 people
- By 2030
- 3,856,546 · +4.8%
- By 2040
- 4,171,407 · +13.4%
- By 2050
- 4,421,607 · +20.2%
- By 2075
- 4,831,599 · +31.4%
- By 2100
- 4,832,502 · +31.4%
Race, ethnicity, and origin ACS 2023
- Neighborhood character
- Predominantly Hispanic (68%)
- Race & ethnicity
- Hispanic / Latino 68% Two or more races 30% White 12% Asian 12% Black 5% Native American 1%
- Hispanic origin (detail)
- Mexican 65%
- Foreign-born
- 32% · Canada, China
- Languages at home
- 35% English-only · Spanish 56% Tagalog/Filipino 7% Chinese 1%
Political lean MEDSL · San Diego
- 2024 margin
- D (+16.8) · D 56.9% · R 40.1% · Other 2.9%
- 2008→2024 swing
- +6.6pp toward D · 2008: 10.2pp · 2024: 16.8pp
- All cycles
- 2024: D+16.8 2020: D+22.8 2016: D+17.8 2012: D+5.1 2008: D+10.2
Not yet ingested
- Civics
- —
Market trends
- HPI YoY
- ▼ -568.62%
- Current HPI
- 393.1836
- Rent YoY
- ▼ -0.52%
- Metro
- San Diego-Chula Vista-Carlsbad, CA
- State GDP YoY
- ▲ 3.21%
- F500 in state
- 116
Industry mix (Fortune 500 HQ in CA)
| Industry | F500 HQs | Revenue |
|---|---|---|
| Technology | 27 | $1,492B |
|
||
| Financial Services | 3 | $174B |
|
||
| Retail | 3 | $44B |
|
||
| Insurance | 3 | $26B |
|
||
| Media / Entertainment | 2 | $115B |
|
||
| Pharmaceuticals / Biotech | 2 | $62B |
|
||
Price history
1 event — show timeline
- 2026-06-17 Coming Soon $249,900 CRMLS
Cash-flow waterfall
monthlySold comps — $/sqft
last 12 mo · ≤1 miLoading sold comps…