1545 Letty Ln · Corpus Christi, TX
Flood risk No data
- FEMA flood zone
- —
- Chance of flooding over 30 yrs
- —
- Est. flood insurance / yr
- —
Fire risk No data
- Est. fire insurance / yr
- —
Heat risk No data
- Hot days now (above threshold)
- —
- Hot days in 30 yrs
- —
Wind risk No data
- Chance of severe wind over 30 yrs
- —
Air-quality risk No data
- Unhealthy air days now
- —
- Unhealthy air days in 30 yrs
- —
Risk factors via First Street. Map © Google.
Why this score? — see what drove the C grade
The composite is a weighted blend of 9 inputs, each scored 0–100. Each bar is that input's sub-score; the figure is the points it added to the 100-point composite (weight × sub-score).
- Cash flow +16.1/30.0
- ARV discount +15.0/15.0
- DSCR +5.0/10.0
- Schools +5.0/10.0
- 1% rule +4.4/10.0
- Condition / age +4.0/5.0
- Livability +3.9/5.0
- Rent growth +2.4/5.0
- Appreciation +0.0/10.0
$284,400
🖨 Deal sheet 📄 Offer letter ✓ Due diligence
Listing remarks
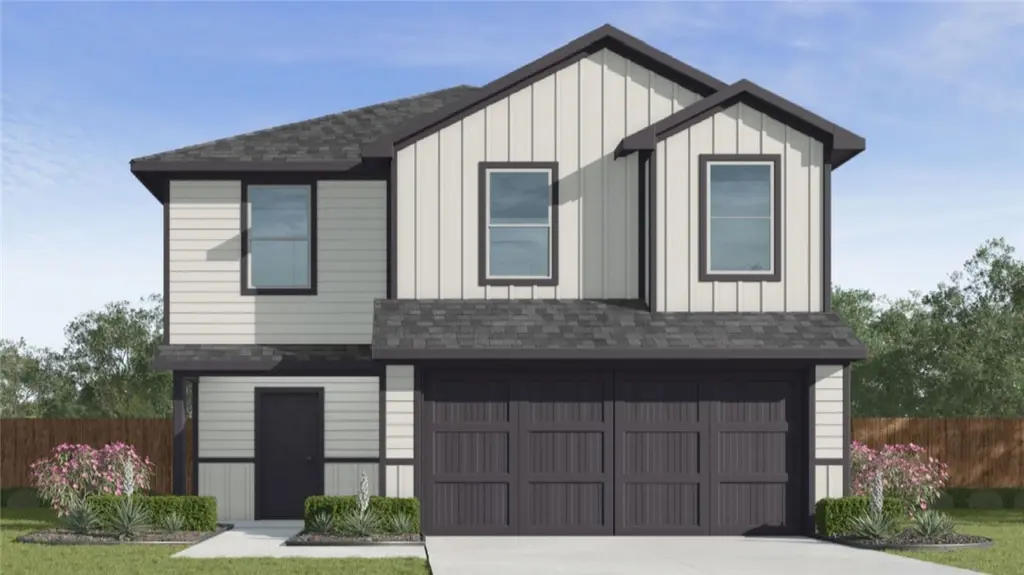
A covered front porch welcomes you into the foyer, which opens to a spacious main living area. The open-concept layout seamlessly connects the gathering room, dining area, and kitchen, creating an inviting atmosphere for everyday living and entertaining. The kitchen features a large granite center island, pantry, quality cabinetry, stainless steel appliances, and ample granite countertop space. Conveniently located on the first floor is a powder room for guests, while all five bedrooms are situated upstairs for added privacy. The primary suite offers a spacious bedroom, an ensuite bathroom, and a large walk-in closet. Four additional bedrooms provide flexibility for a home office, hobby roo
Key facts
- Covered front porch
- Quality cabinetry
- Open concept layout
Tags
Property features AI
Exterior
- Parking: 2-car garage; Concrete driveway/parking
- Utilities: Public water; Public sewer; Utilities available
- Home design: 2-story house; Under construction
- Construction: HardiPlank exterior; Shingle roof; Slab foundation; Built recently / currently under construction
- Exterior features: Wood fencing
Interior
- Kitchen: Dishwasher; Gas oven; Gas range; Microwave
- Flooring: Carpet; Vinyl
- Bathrooms: 2 full bathrooms; 1 half bathroom
- Heating & cooling: Central heating (electric); Central air conditioning
- Interior features: Open floorplan; Kitchen island
- Laundry & utility: Washer hookup; Dryer hookup
Neighborhood map
What this means for you Summary
Snapshot
- This is a 5-bed/2.5-bath single-family listed at $284k. Condition is rated good.
Deal economics
- At list price, monthly cash flow is $148 ($2k/yr) — positive.
- The deal already cash-flows at list — no discount required.
- To meet the 1% rule (rent ≥ 1% of price), the offer needs to be $267k (6.0% below list).
- Recommended offer: $267k (6.0% below list) — sets the bar for 1% rule.
- Cap rate 6.9% vs local median 3.6% in Corpus Christi — top-decile yield for the area; either an underpriced asset or a hidden risk that comps aren't pricing in. Stress-test before assuming the spread holds.
Location & tenants
- Location reads 78/100 on livability (#66 in TX, #2,404 nationally) — a middle-class / working-renter tenant base. Strengths: commute A+, cost of living A+, housing A+; Watch: crime F.
- Market conditions: Rents soft (-0.6%/yr); 685 active listings in the ZIP; 2 comparable units currently listed for rent nearby; solid renter incomes; 1,397 units permitted in Nueces County in 2024 (47 in 5+ unit buildings).
- This rent runs 35% of the median local income ($92k/yr) — at the standard rent-burdened threshold; future hikes will face affordability resistance.
Forward outlook
- Local home prices are declining (-3.0%/yr); year-one equity from $2k of loan paydown is wiped out by about $9k of value loss. Plan a longer hold.
- Nueces County population projected at +36% by 2050 — long-run rental-demand tailwind backs the buy-and-hold thesis.
Negotiation context
- Only 14 days on market — expect competitive offers; lowballing is unlikely to land.
Questions for the listing agent
- Is there a deadline driving the sale (1031 exchange, divorce, estate, relocation)? That informs how much negotiation room exists.
- Crime grade is F in this area — have there been break-ins, vandalism, or insurance claims at this property in the last 3 years? What carrier currently insures it and at what premium?
- What's the average days-on-market for RENTAL listings here right now (not sales)? A rising rental-DOM trend means longer vacancies and softer asking-rent achievability than the comps imply.
- What's the recent tenant-quality profile in this submarket — average credit score on applications, eviction rate, late-payment / NSF rate, and stable-employment percentage? A property-management company in the area should have these aggregated.
- How much new for-sale + rental construction is in the pipeline within 1–3 miles? Heavy new supply typically softens prices + rents 12–24 months out; constrained supply supports both.
Investment metrics
- 1% rule
- 0.94% ✗
- Cap rate
- 6.92%
- Cash-on-cash
- 2.22%
- DSCR
- 1.10
- GRM
- 8.9
CMA / ARV
- ARV (on-the-fly)
- $378,400
- Comps found
- 1
Show comp detail 1 sale within ~0.75 mi
| Address | Dist | Beds/Ba | Sqft | Sold | Price | $/sf | Match |
|---|---|---|---|---|---|---|---|
| 121 Clearview Dr | 0.60mi | 4/2.0 (-1) | 1,837 (-3%) | 18mo | $368,000 | $200 | 45 |
Match score weights: distance 35% · size 25% · config 20% · recency 20%. Top-matched comps best support the ARV.
Projected returns pro-forma
-3.0% appreciation · 0.0% rent growth · sell at horizon
- IRR
- -16.2%
- Equity multiple
- 0.44×
- Total profit
- $-44,484
- Equity at exit
- $42,405
- IRR
- -14.4%
- Equity multiple
- 0.29×
- Total profit
- $-56,762
- Equity at exit
- $24,590
Cash invested: $79,632 (down + closing). Projections, not guarantees.
Landlord ↔ Tenant lean methodology
- Overall (STATE)
- 87 Strongly Landlord-Friendly
- State Texas
- 87 Strongly Landlord-Friendly · R+5
- County
- — inherits STATE
- City
- — inherits STATE
ZIP-level market 78418
- Rents YoY
- -0.6%
- Active inventory
- 685
- Price-to-rent
- 8.9×
Monthly cashflow live
- Estimated rent
- $2,675 medium interval (Pro) →
- Mortgage (P&I)
- −$1,491
- Tax est. 1.5%
- −$356 /mo · $4,266/yr
- Insurance
- −$118
- HOA
- −$0
- Vacancy / Maint / Mgmt
- −$562
- Net cashflow
- $148
Break-even live
UW: 25.0% down · 7.5% · 30yr · 1.5% tax · 5.0% vac · 8.0% maint · 8.0% mgmt
Financing live
Cash to close
- Down payment
- $71,100
- Closing costs
- $8,532
- Reserves months
- —
- Total cash needed
- —
Loan-product check · same deal, 3 products live
Conventional
25% down · 7.5% · 30yr
- Down + closing
- —
- Monthly P&I
- —
- Monthly cashflow
- —
- DSCR
- —
- Eligible?
- —
Personal DTI + credit; lowest rate.
DSCR
20% down · 8.5% · 30yr
- Down + closing
- —
- Monthly P&I
- —
- Monthly cashflow
- —
- DSCR
- —
- Eligible?
- —
No personal income docs; deal must DSCR.
Hard money
10% down · 12.0% · 12mo
- Down + closing
- —
- Monthly P&I
- —
- Monthly cashflow
- —
- DSCR
- —
- Eligible?
- —
Short-term bridge; refi at stabilization.
Rent comps 2 comps
| Address | Beds | Baths | Sqft | Rent | $/sqft | DOM | Units | Dist |
|---|---|---|---|---|---|---|---|---|
| 557 Yorktown Blvd Corpus Christi, TX | 3.0–5.0 | 2.0 | 1714 | $2,337 | $1.36 | 13d | 1 | 1.35mi |
| 538 Vega Dr Corpus Christi, TX | 4.0 | 2.0 | 1539 | $1,925 | $1.25 | 43d | 1 | 1.39mi |
Listing history 11 events
-
2026-06-18days on market $284,400 Active 14 DOM
-
2026-06-17days on market $284,400 Active 13 DOM
-
2026-06-16days on market $284,400 Active 12 DOM
-
2026-06-15days on market $284,400 Active 11 DOM
-
2026-06-14days on market $284,400 Active 9 DOM
-
2026-06-13days on market $284,400 Active 8 DOM
-
2026-06-10days on market $284,400 Active 6 DOM
-
2026-06-09days on market $284,400 Active 5 DOM
-
2026-06-08days on market $284,400 Active 4 DOM
-
2026-06-07remarks 699-char remark
-
2026-06-07$284,400 Active 3 DOM
ⓘ Source: listings_history table (triggers on properties + properties_extension) + one-shot
backfill from property_details.listing_events for pre-trigger history.
Nearby sold comps map
Loading sold comps map…
Walkable amenities ~0.75 mi
Loading nearby amenities…
Taxation est. · year 1
- Rental income
- $32,096
- − Mortgage interest
- −$15,931
- − Property taxes
- −$4,266
- − Insurance
- −$1,422
- − Repairs & maintenance
- −$2,568
- − Management
- −$2,568
- − Depreciation
- −$8,273
- Taxable loss
- −$2,932
- Est. tax savings @ 24.0%
- +$704
- After-tax cash flow
- $2,474/yr
For passive investors: Depreciation is non-cash, so a rental often shows a tax loss while cash-flowing — sheltering income. Rental losses are passive: they offset passive income freely, and up to $25,000/yr can offset ordinary (W-2) income if you actively participate and your MAGI is under $100k (phasing out to $0 by $150k); unused losses carry forward. On sale, claimed depreciation is recaptured at up to 25%, and gains may owe capital-gains tax (a 1031 exchange can defer both). Figures are a year-1 estimate at your 24.0% rate — not tax advice; consult a CPA.
Condition & rehab AI · 8 photos
This home is in good condition with a good exterior and interior. Painting the interior walls would be a low-cost update that could significantly increase its value.
Value-add opportunities
- Both Paint the interior walls — Painting the interior walls can improve the home's curb appeal and make it more attractive to potential buyers or renters.
Renovation cost estimate screening
Value-add ROI direction
- Both Paint the interior walls — Painting the interior walls can improve the home's curb appeal and make it more attractive to potential buyers or renters. ↑
ⓘ Cost ranges are severity-bucket heuristics (US national rule-of-thumb). Get contractor quotes + a written scope before underwriting a rehab budget.
Schools (NCES district)
No district data.
Livability — Corpus Christi
- Score
- 78/100
- State rank
- #66
- US rank
- #2404
Category grades
Schools grade is shown separately in the Schools card above.
Census & demographics
- Census place
- Corpus Christi, TX
- County
- Nueces County · 296,836 people
- City population
- 296,836
- Metro
- Corpus Christi, TX
- Population (ZIP)
- 29,790
- Household income
- $92,445
- Rent vs Own
- Severe rent burden
- 808.0
Population outlook (Nueces County) Hauer SSP2
- Today (2025)
- 418,037 people
- By 2030
- 447,123 · +7.0%
- By 2040
- 505,911 · +21.0%
- By 2050
- 567,522 · +35.8%
- By 2075
- 729,686 · +74.6%
- By 2100
- 847,087 · +102.6%
Race, ethnicity, and origin ACS 2023
- Neighborhood character
- Majority White (61%)
- Race & ethnicity
- White 61% Hispanic / Latino 29% Two or more races 19% Asian 3% Black 3%
- Hispanic origin (detail)
- Mexican 25%
- Common ancestry
- Romanian 2% Lithuanian 2% Slovak 2%
- Foreign-born
- 7% · Canada, China
- Languages at home
- 83% English-only · Spanish 14% Tagalog/Filipino 2%
Political lean MEDSL · Nueces
- 2024 margin
- R (+11.5) · D 43.8% · R 55.3%
- 2008→2024 swing
- -7.1pp toward R · 2008: -4.4pp · 2024: -11.5pp
- All cycles
- 2024: R+11.5 2020: R+2.9 2016: R+1.5 2012: R+3.2 2008: R+4.4
Not yet ingested
- Civics
- —
Market trends
- HPI YoY
- ▼ -168.81%
- Current HPI
- 193.902
- Rent YoY
- ▼ -0.57%
- Metro
- Corpus Christi, TX
- State GDP YoY
- ▲ 3.95%
- F500 in state
- 110
Industry mix (Fortune 500 HQ in TX)
| Industry | F500 HQs | Revenue |
|---|---|---|
| Energy | 16 | $1,198B |
|
||
| Technology | 5 | $198B |
|
||
| Engineering / Construction | 4 | $72B |
|
||
| Energy Services | 3 | $60B |
|
||
| Utilities | 3 | $41B |
|
||
| Healthcare | 2 | $330B |
|
||
Price history
1 event — show timeline
- 2026-06-04 Listed $284,400 CBMLS
Cash-flow waterfall
monthlySold comps — $/sqft
last 12 mo · ≤1 miLoading sold comps…