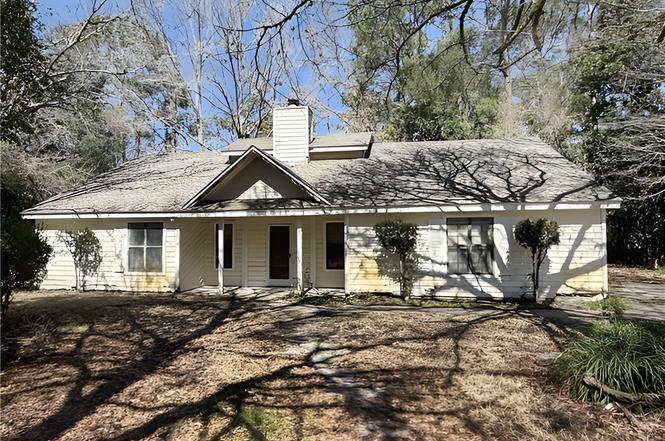
137 Landover Cir · Country Club Estates, GA
Flood risk 4/10 · Minor
- FEMA flood zone
- X (unshaded)
- Chance of flooding over 30 yrs
- 0.16%
- Est. flood insurance / yr
- $507 – $1,088
Fire risk 4/10 · Minor
- Est. fire insurance / yr
- $963 – $1,789
Heat risk 10/10 · Severe
- Hot days now (above 108°F)
- 7 days/yr
- Hot days in 30 yrs
- 20 days/yr
Wind risk 9/10 · Severe
- Chance of severe wind over 30 yrs
- 99.0%
Air-quality risk 4/10 · Minor
- Unhealthy air days now
- 5 days/yr
- Unhealthy air days in 30 yrs
- 5 days/yr
Risk factors via First Street. Map © Google.
Why this score? — see what drove the B grade
The composite is a weighted blend of 9 inputs, each scored 0–100. Each bar is that input's sub-score; the figure is the points it added to the 100-point composite (weight × sub-score).
- Cash flow +27.7/30.0
- ARV discount +15.0/15.0
- DSCR +9.8/10.0
- 1% rule +6.5/10.0
- Schools +3.4/10.0
- Livability +3.3/5.0
- Rent growth +2.5/5.0
- Condition / age +2.5/5.0
- Appreciation +0.0/10.0
$153,500
🖨 Deal sheet 📄 Offer letter ✓ Due diligence
Listing remarks
137 Landover Cir, Brunswick, GA is a single family home that contains 1,519 sq ft and was built in 1988. It contains 3 bedrooms and 2 full bathrooms. This home is located in a cul-de-sac of a quiet established neighborhood. The home has a nice sized backyard that is semi-fenced. Home has a new shingled roof.
Key facts
- New shingled roof
- Semi-fenced
- Nice sized backyard
Tags
Property features AI
Exterior
- Exterior features: Lot approximately 0.26 acres
Interior
- Bathrooms: 2 full bathrooms
- Interior features: 5 total rooms; Virtual tour available
Neighborhood map
What this means for you Summary
Snapshot
- This is a 3-bed/2.0-bath single-family listed at $154k.
Deal economics
- At list price, monthly cash flow is $464 ($6k/yr) — positive.
- The deal already cash-flows at list — no discount required.
- Meets the 1% rule at list price ($2k rent vs $154k).
- Recommended offer: $144k (6.0% below list) — sets the bar for market timing.
- Cap rate 9.9% vs local median 3.5% in Country Club Estates — top-decile yield for the area; either an underpriced asset or a hidden risk that comps aren't pricing in. Stress-test before assuming the spread holds.
Location & tenants
- Location reads 66/100 on livability (#179 in GA) — a middle-class / working-renter tenant base. Strengths: cost of living A+, housing A+; Watch: employment D, schools F, amenities F.
- Glynn County (other): math 37% / reading 42% proficiency, ranked #47 of 174 in GA (top 27%) — families likely to look elsewhere, expect single-tenant / working-renter base with shorter leases.
- Market conditions: Rents soft (-0.2%/yr); 353 active listings in the ZIP; 7 comparable units currently listed for rent nearby; rentals lingering (median 44d on market — plan ~5-8 weeks vacancy on turnover, expect pricing pressure); 100% of comp listings sitting > 30 days — soft ceiling on asking rent; 734 units permitted in Glynn County in 2024 (136 in 5+ unit buildings).
- This rent runs 30% of the median local income ($69k/yr) — at the standard rent-burdened threshold; future hikes will face affordability resistance.
Forward outlook
- Local home prices are declining (-3.0%/yr); year-one equity from $1k of loan paydown is wiped out by about $5k of value loss. Plan a longer hold.
- Glynn County population projected at +13% by 2050 — modest demand growth; plan on rents tracking national, not racing it.
Negotiation context
- It's been on market 64 days — a 6% lower offer ($144k) is reasonable based on typical stale-listing flexibility.
- 2 sale attempts; this cycle's ask has dropped $11k (7%) from the opening price — seller is motivated, your offer sets the floor, not the list.
Risks & watch-outs
- Climate carrying-cost: severe wind risk, 99% chance of damaging wind over 30y; extreme-heat days projected 7→20/yr by 2055 (HVAC capex compounding) — expect insurance premiums to compound above CPI over the hold.
Questions for the listing agent
- It's been on market 64 days. Have you received any prior offers? Is the seller open to a 6% concession, seller financing, or rate buy-down credit?
- Why hasn't it sold? Are there any deal-killer items the seller is aware of (foundation, flood, title, zoning, code violations)?
- Is there a deadline driving the sale (1031 exchange, divorce, estate, relocation)? That informs how much negotiation room exists.
- Schools are F-rated, which usually means shorter tenancies and higher turnover. Who's the typical renter profile here, and what's been the actual vacancy rate?
- What's the average days-on-market for RENTAL listings here right now (not sales)? A rising rental-DOM trend means longer vacancies and softer asking-rent achievability than the comps imply.
- What's the recent tenant-quality profile in this submarket — average credit score on applications, eviction rate, late-payment / NSF rate, and stable-employment percentage? A property-management company in the area should have these aggregated.
- How much new for-sale + rental construction is in the pipeline within 1–3 miles? Heavy new supply typically softens prices + rents 12–24 months out; constrained supply supports both.
Investment metrics
- 1% rule
- 1.15% ✓
- Cap rate
- 9.92%
- Cash-on-cash
- 12.97%
- DSCR
- 1.58
- GRM
- 7.2
CMA / ARV
- ARV (on-the-fly)
- $223,293
- Comps found
- 12
Show comp detail 12 sales within ~0.75 mi
| Address | Dist | Beds/Ba | Sqft | Sold | Price | $/sf | Match |
|---|---|---|---|---|---|---|---|
| 52 Hornet Dr | 0.34mi | 3/2.0 | 1,551 (+2%) | 7mo | $200,000 | $129 | 74 |
| 173 Fairway Oaks Dr | 0.43mi | 3/2.0 | 1,486 (-2%) | 3mo | $202,700 | $136 | 74 |
| 116 Chatford Cir | 0.09mi | 3/2.0 | 1,680 (+11%) | 6mo | $249,000 | $148 | 74 |
| 155 Mcdowell Ave | 0.33mi | 3/2.0 | 1,428 (-6%) | 2mo | $315,000 | $221 | 73 |
| 170 Zachary Dr | 0.25mi | 4/2.0 (+1) | 1,597 (+5%) | 8mo | $227,500 | $142 | 68 |
| 209 Cardinal Rd | 0.75mi | 3/2.0 | 1,514 (-0%) | 4mo | $292,000 | $193 | 61 |
| 356 Knox Dr | 0.71mi | 3/2.0 | 1,481 (-2%) | 8mo | $249,000 | $168 | 56 |
| 118 Saxon St | 0.52mi | 4/1.0 (+1) | 1,592 (+5%) | 5mo | $204,500 | $128 | 54 |
| 167 Zachary Dr | 0.28mi | 4/3.0 (+1) | 1,714 (+13%) | 3mo | $252,700 | $147 | 54 |
| 1107 Fairway Rd | 0.63mi | 3/2.0 | 1,659 (+9%) | 6mo | $322,000 | $194 | 50 |
| 103 N Palm Dr | 0.42mi | 4/1.0 (+1) | 1,300 (-14%) | 1mo | $180,000 | $138 | 47 |
| 632 Halsey St | 0.66mi | 3/2.0 | 1,306 (-14%) | 8mo | $130,000 | $100 | 39 |
Match score weights: distance 35% · size 25% · config 20% · recency 20%. Top-matched comps best support the ARV.
Projected returns pro-forma
-3.0% appreciation · 0.0% rent growth · sell at horizon
- IRR
- -0.3%
- Equity multiple
- 0.99×
- Total profit
- $-516
- Equity at exit
- $22,887
- IRR
- 6.2%
- Equity multiple
- 1.41×
- Total profit
- $17,437
- Equity at exit
- $13,272
Cash invested: $42,980 (down + closing). Projections, not guarantees.
Landlord ↔ Tenant lean methodology
- Overall (STATE)
- 90 Strongly Landlord-Friendly
- State Georgia
- 90 Strongly Landlord-Friendly · R+3
- County
- — inherits STATE
- City
- — inherits STATE
ZIP-level market 31525
- Rents YoY
- -0.2%
- Active inventory
- 353
- Price-to-rent
- 7.2×
Monthly cashflow live
- Estimated rent
- $1,765 high interval (Pro) →
- Mortgage (P&I)
- −$805
- Tax from tax record
- −$61 /mo · $730/yr
- Insurance
- −$64
- HOA
- −$0
- Vacancy / Maint / Mgmt
- −$371
- Net cashflow
- $464
Break-even live
UW: 25.0% down · 7.5% · 30yr · 1.5% tax · 5.0% vac · 8.0% maint · 8.0% mgmt
Financing live
Cash to close
- Down payment
- $38,375
- Closing costs
- $4,605
- Reserves months
- —
- Total cash needed
- —
Loan-product check · same deal, 3 products live
Conventional
25% down · 7.5% · 30yr
- Down + closing
- —
- Monthly P&I
- —
- Monthly cashflow
- —
- DSCR
- —
- Eligible?
- —
Personal DTI + credit; lowest rate.
DSCR
20% down · 8.5% · 30yr
- Down + closing
- —
- Monthly P&I
- —
- Monthly cashflow
- —
- DSCR
- —
- Eligible?
- —
No personal income docs; deal must DSCR.
Hard money
10% down · 12.0% · 12mo
- Down + closing
- —
- Monthly P&I
- —
- Monthly cashflow
- —
- DSCR
- —
- Eligible?
- —
Short-term bridge; refi at stabilization.
Rent comps 7 comps
| Address | Beds | Baths | Sqft | Rent | $/sqft | DOM | Units | Dist |
|---|---|---|---|---|---|---|---|---|
| 111 S Palm Dr Brunswick, GA | 1.0–3.0 | 1.0–2.0 | 1077 | $1,589 | $1.48 | 43d | 11 | 0.58mi |
| 100 Towne Sq Brunswick, GA | 2.0–3.0 | 2.0–2.5 | 1874 | $1,969 | $1.05 | 43d | 5 | 0.71mi |
| 3500 Grand Pointe Way Brunswick, GA | 2.0 | 2.0 | 1170 | $1,442 | $1.23 | 43d | 5 | 0.76mi |
| 820 Scranton Rd Brunswick, GA | 1.0–3.0 | 1.0–2.5 | 797 | $1,696 | $2.13 | 43d | 5 | 0.84mi |
| 500 Beverly Villas Dr Brunswick, GA | 2.0 | 2.0 | 1336 | $1,712 | $1.28 | 43d | 4 | 0.99mi |
| 171 Drayton Cir Brunswick, GA | 3.0 | 2.5 | 1800 | $1,700 | $0.94 | 43d | 1 | 1.15mi |
| 500 Coastal Club Cir Brunswick, GA | 2.0 | 2.0 | 1153 | $1,314 | $1.14 | 43d | 5 | 1.37mi |
Listing history 6 events
-
2026-05-01status Pending
-
2026-04-22price $153,500
-
2026-03-25price $159,900
-
2026-02-24$164,500 Active
-
2025-08-28$185,000 Active
-
2025-01-16soldstatus $186,900
ⓘ Source: listings_history table (triggers on properties + properties_extension) + one-shot
backfill from property_details.listing_events for pre-trigger history.
Tax reassessment forecast GA · Resets to sale price
- Current annual tax
- $730 · $61/mo
- Projected year-2 tax
- $1,412 · $118/mo
- Expected delta
- +$682/yr (+$57/mo · 93.5%)
ⓘ Screening estimate from a state-policy table — verify with the county assessor before closing.
Climate risk First Street
- Flood 4/10 Moderate FEMA zone X (unshaded) · 16% chance over 30 yrs
- Wildfire 4/10 Moderate
- Heat 10/10 Extreme 7 d/yr ≥108°F today · 20 d/yr by 30 yrs out
- Wind 9/10 Extreme 99% chance of damaging wind over 30 yrs
- Air quality 4/10 Moderate 5 unhealthy d/yr today · 5 by 30 yrs out
Nearby sold comps map
Loading sold comps map…
Walkable amenities ~0.75 mi
Loading nearby amenities…
Taxation est. · year 1
- Rental income
- $21,178
- − Mortgage interest
- −$8,598
- − Property taxes
- −$730
- − Insurance
- −$768
- − Repairs & maintenance
- −$1,694
- − Management
- −$1,694
- − Depreciation
- −$4,465
- Taxable income
- $3,229
- Est. tax owed @ 24.0%
- −$775
- After-tax cash flow
- $4,799/yr
For passive investors: Depreciation is non-cash, so a rental often shows a tax loss while cash-flowing — sheltering income. Rental losses are passive: they offset passive income freely, and up to $25,000/yr can offset ordinary (W-2) income if you actively participate and your MAGI is under $100k (phasing out to $0 by $150k); unused losses carry forward. On sale, claimed depreciation is recaptured at up to 25%, and gains may owe capital-gains tax (a 1031 exchange can defer both). Figures are a year-1 estimate at your 24.0% rate — not tax advice; consult a CPA.
Schools (NCES district)
- District
- Glynn County
- NCES district ID
- 1302400
- Math proficiency
- 37% ▼ -9.00%
- Reading proficiency
- 42% ▼ -7.00%
- Median HH income
- $47,554
- Composite
- 33.83/100
- National rank
- #5359
- State rank
- #47 of 174 in GA
Livability — Country Club Estates
- Score
- 66/100
- State rank
- #179
- US rank
- #11222
Category grades
Schools grade is shown separately in the Schools card above.
Census & demographics
- Census place
- Country Club Estates, GA
- County
- Glynn County · 69,019 people
- Metro
- Brunswick, GA
- Population (ZIP)
- 28,926
- Household income
- $69,493
- Rent vs Own
- Severe rent burden
- 924.0
Population outlook (Glynn County) Hauer SSP2
- Today (2025)
- 91,404 people
- By 2030
- 94,806 · +3.7%
- By 2040
- 100,060 · +9.5%
- By 2050
- 103,258 · +13.0%
- By 2075
- 107,970 · +18.1%
- By 2100
- 103,363 · +13.1%
Race, ethnicity, and origin ACS 2023
- Neighborhood character
- Diverse neighborhood (Simpson 0.56)
- Race & ethnicity
- White 61% Black 23% Hispanic / Latino 9% Two or more races 7%
- Hispanic origin (detail)
- Mexican 4%
- Common ancestry
- Italian 3% Slovak 1% Lithuanian 1%
- Foreign-born
- 6% · Canada
- Languages at home
- 92% English-only · Spanish 7%
Political lean MEDSL · Glynn
- 2024 margin
- Strong R (+26.0) · D 36.8% · R 62.8%
- 2008→2024 swing
- -2.6pp toward R · 2008: -23.4pp · 2024: -26.0pp
- All cycles
- 2024: R+26.0 2020: R+23.2 2016: R+28.6 2012: R+27.0 2008: R+23.4
Not yet ingested
- Civics
- —
Market trends
- HPI YoY
- ▼ -133.03%
- Current HPI
- 162.2528
- Rent YoY
- ▼ -0.16%
- Metro
- Brunswick, GA
- State GDP YoY
- ▲ 2.66%
- F500 in state
- 28
Industry mix (Fortune 500 HQ in GA)
| Industry | F500 HQs | Revenue |
|---|---|---|
| Paper / Packaging | 2 | $29B |
|
||
| Retail | 1 | $160B |
|
||
| Transportation / Logistics | 1 | $91B |
|
||
| Airlines | 1 | $62B |
|
||
| Consumer Goods | 1 | $47B |
|
||
| Utilities | 1 | $25B |
|
||
Price history
-17.9% since first listed6 events — show timeline
- 2026-05-01 Pending — GIAR
- 2026-04-22 Price Changed $153,500 GIAR
- 2026-03-25 Price Changed $159,900 GIAR
- 2026-02-24 Listed $164,500 GIAR
- 2025-08-28 Listed $185,000 GIAR
- 2025-01-16 Sold (Public Records) $186,900 Public Records
Property tax history
-1.6%/yrLatest (2025): $730 · -0.0% YoY. Source: county tax records.
Cash-flow waterfall
monthlySold comps — $/sqft
last 12 mo · ≤1 miLoading sold comps…