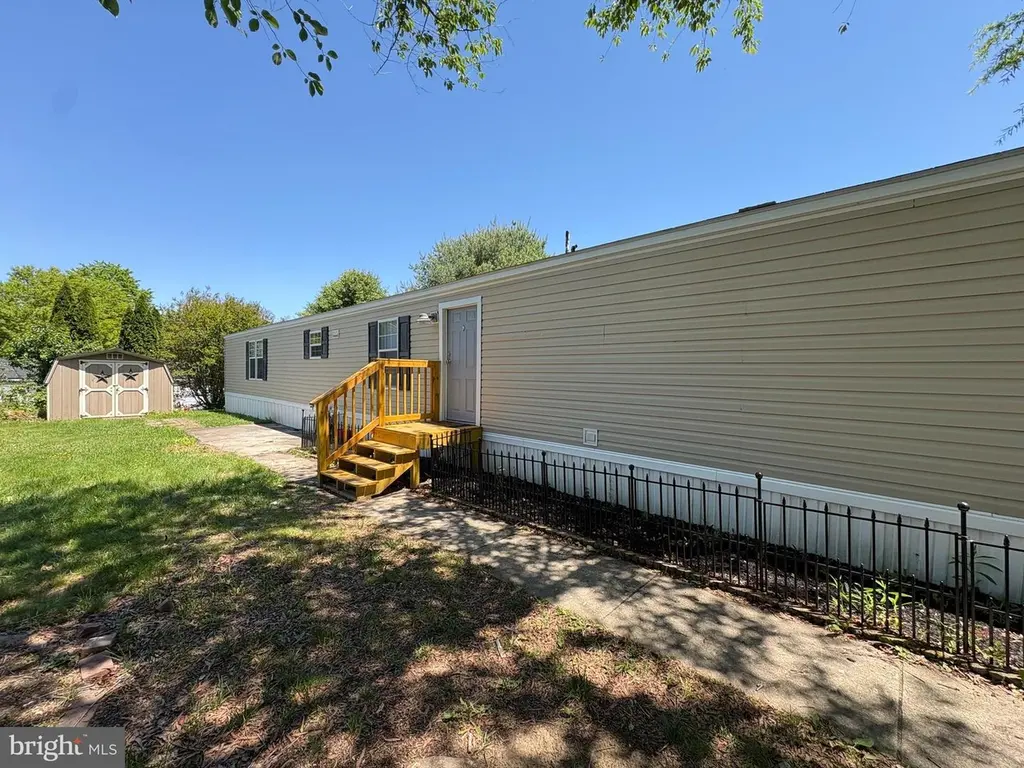
925 Decoy Way Unit A192 · St. Georges, DE
Flood risk No data
- FEMA flood zone
- —
- Chance of flooding over 30 yrs
- —
- Est. flood insurance / yr
- —
Fire risk No data
- Est. fire insurance / yr
- —
Heat risk No data
- Hot days now (above threshold)
- —
- Hot days in 30 yrs
- —
Wind risk No data
- Chance of severe wind over 30 yrs
- —
Air-quality risk No data
- Unhealthy air days now
- —
- Unhealthy air days in 30 yrs
- —
Risk factors via First Street. Map © Google.
Why this score? — see what drove the C+ grade
The composite is a weighted blend of 9 inputs, each scored 0–100. Each bar is that input's sub-score; the figure is the points it added to the 100-point composite (weight × sub-score).
- Cash flow +30.0/30.0
- 1% rule +10.0/10.0
- DSCR +10.0/10.0
- Rent growth +4.8/5.0
- Condition / age +4.0/5.0
- Livability +2.5/5.0
- Schools +2.1/10.0
- ARV discount +0.0/15.0
- Appreciation +0.0/10.0
$95,000
🖨 Deal sheet 📄 Offer letter ✓ Due diligence
Listing remarks
SOLD FULLY FURNISHED! Step into this beautifully renovated 3-bedroom, 2-bath manufactured home in the heart of Bear, DE—where modern updates meet everyday comfort. From the moment you enter, you’ll love the bright, open-concept layout filled with natural light, fresh paint, and sleek, contemporary finishes throughout. The stunning kitchen is the centerpiece of the home, featuring brand-new appliances, ample cabinet space, and a seamless flow into the cozy dining and living areas—perfect for entertaining or relaxing at home. The private owner’s suite offers a true retreat, complete with a full bath and soaking tub, while two additional bedrooms provide flexible space
Key facts
- Private owners suite
- Renovated home
- Full bath
Tags
Property features AI
Finance
- Other: Ownership: Land lease; Living area reported as estimated
- Financial info: Land lease years remaining: 0
- HOA & community: Land lease with monthly ground rent of $955; Ground rent exists
Exterior
- Parking: Driveway parking; Two driveway spaces (total 2 garage/parking spaces)
- Utilities: Public water; Public sewer; Electric hot water
- Home design: Manufactured home; Single-wide mobile home; Estimated year built
- Construction: Aluminum siding; Shingle roof; Crawl space foundation
- Exterior features: No basement; 2+ access exits; Above-grade structures
Interior
- Kitchen: Dishwasher; Disposal; Microwave; Single oven; Stove; Refrigerator; Stainless steel appliances
- Bedrooms: Three main-level bedrooms
- Flooring: Vinyl flooring; Laminate flooring
- Bathrooms: Two full bathrooms (both on main level)
- Heating & cooling: 90% efficient forced air heating; Propane (metered) heating fuel; Central air conditioning; Central A/C
- Interior features: Soaking tub; Ceiling fans; Combination kitchen and living area; Walk-in closet(s); Furnished
- Laundry & utility: Washer and dryer hookups; Dryer included
Neighborhood map
What this means for you Summary
Snapshot
- This is a 3-bed/2.0-bath single-family listed at $95k. Condition is rated good.
Deal economics
- At list price, monthly cash flow is $1k ($15k/yr) — positive.
- The deal already cash-flows at list — no discount required.
- Meets the 1% rule at list price ($2k rent vs $95k).
- Recommended offer: $92k (3.0% below list) — sets the bar for market timing.
- Cap rate 21.9% vs local median 3.0% in St. Georges — top-decile yield for the area; either an underpriced asset or a hidden risk that comps aren't pricing in. Stress-test before assuming the spread holds.
Location & tenants
- Location reads: area grade C — affects rentability + tenant quality, not the cash-flow math above.
- Colonial School District (suburban): math 15% / reading 30% proficiency, ranked #23 of 26 in DE (top 88%) — low school quality limits family demand, transient renter base, plan for 1-2y turnover.
- Market conditions: Rents rising fast (+9.0%/yr); 103 active listings in the ZIP; high-income renter base; 1,367 units permitted in New Castle County in 2024 (201 in 5+ unit buildings).
Forward outlook
- Local home prices are declining (-3.0%/yr); year-one equity from $657 of loan paydown is wiped out by about $3k of value loss. Plan a longer hold.
- New Castle County population projected at +9% by 2050 — modest demand growth; plan on rents tracking national, not racing it.
- At projected returns (-3.0% appreciation + 8.0% rent growth), your $27k cash investment doubles in ~2 years — after that, you're playing with house money.
Negotiation context
- It's been on market 37 days — a 3% lower offer ($92k) is reasonable based on typical stale-listing flexibility.
Questions for the listing agent
- It's been on market 37 days. Have you received any prior offers? Is the seller open to a 3% concession, seller financing, or rate buy-down credit?
- Is there a deadline driving the sale (1031 exchange, divorce, estate, relocation)? That informs how much negotiation room exists.
- What's the average days-on-market for RENTAL listings here right now (not sales)? A rising rental-DOM trend means longer vacancies and softer asking-rent achievability than the comps imply.
- What's the recent tenant-quality profile in this submarket — average credit score on applications, eviction rate, late-payment / NSF rate, and stable-employment percentage? A property-management company in the area should have these aggregated.
- How much new for-sale + rental construction is in the pipeline within 1–3 miles? Heavy new supply typically softens prices + rents 12–24 months out; constrained supply supports both.
Investment metrics
- 1% rule
- 2.52% ✓
- Cap rate
- 21.85%
- Cash-on-cash
- 55.56%
- DSCR
- 3.47
- GRM
- 3.3
CMA / ARV
- ARV (median comp)
- $71,062
- List price
- $95,000
- Delta
- 33.69%
- Verdict
- OVERPRICED
- Comps
- 20 within 1.0 mi
Show comp detail 6 sales within ~0.75 mi
| Address | Dist | Beds/Ba | Sqft | Sold | Price | $/sf | Match |
|---|---|---|---|---|---|---|---|
| 13 N Dragon Dr Unit A008 | 0.38mi | 4/2.0 (+1) | 1,100 (-4%) | 1mo | $56,000 | $51 | 70 |
| 918 Decoy Way #171 | 0.05mi | 2/2.0 (-1) | 980 (-14%) | 3mo | $61,775 | $63 | 67 |
| 841 Trophy Way | 0.11mi | 3/2.0 | 1,064 (-7%) | 23mo | $50,000 | $47 | 65 |
| 97 N Dragon Dr | 0.26mi | 3/2.0 | 1,000 (-12%) | 9mo | $50,000 | $50 | 60 |
| 27 N Dragon Dr Unit A016 | 0.33mi | 3/2.0 | 1,055 (-8%) | 19mo | $85,000 | $81 | 57 |
| 1110 Colt Cir #728 | 0.23mi | 3/2.0 | 1,269 (+11%) | 19mo | $75,000 | $59 | 55 |
Match score weights: distance 35% · size 25% · config 20% · recency 20%. Top-matched comps best support the ARV.
Projected returns pro-forma
-3.0% appreciation · 8.0% rent growth · sell at horizon
- IRR
- 59.5%
- Equity multiple
- 3.85×
- Total profit
- $75,719
- Equity at exit
- $14,165
- IRR
- 66.0%
- Equity multiple
- 9.44×
- Total profit
- $224,583
- Equity at exit
- $8,214
Cash invested: $26,600 (down + closing). Projections, not guarantees.
Landlord ↔ Tenant lean methodology
- Overall (STATE)
- 70 Landlord-Friendly
- State Delaware
- 70 Landlord-Friendly · D+7
- County
- — inherits STATE
- City
- — inherits STATE
ZIP-level market 19701
- Rents YoY
- 9.0%
- Active inventory
- 103
- Price-to-rent
- 3.3×
Monthly cashflow live
- Estimated rent
- $2,390 medium interval (Pro) →
- Mortgage (P&I)
- −$498
- Tax est. 1.5%
- −$119 /mo · $1,425/yr
- Insurance
- −$40
- HOA
- −$0
- Vacancy / Maint / Mgmt
- −$502
- Net cashflow
- $1,232
Break-even live
UW: 25.0% down · 7.5% · 30yr · 1.5% tax · 5.0% vac · 8.0% maint · 8.0% mgmt
Financing live
Cash to close
- Down payment
- $23,750
- Closing costs
- $2,850
- Reserves months
- —
- Total cash needed
- —
Loan-product check · same deal, 3 products live
Conventional
25% down · 7.5% · 30yr
- Down + closing
- —
- Monthly P&I
- —
- Monthly cashflow
- —
- DSCR
- —
- Eligible?
- —
Personal DTI + credit; lowest rate.
DSCR
20% down · 8.5% · 30yr
- Down + closing
- —
- Monthly P&I
- —
- Monthly cashflow
- —
- DSCR
- —
- Eligible?
- —
No personal income docs; deal must DSCR.
Hard money
10% down · 12.0% · 12mo
- Down + closing
- —
- Monthly P&I
- —
- Monthly cashflow
- —
- DSCR
- —
- Eligible?
- —
Short-term bridge; refi at stabilization.
Listing history 15 events
-
2026-06-18days on market $95,000 Active 37 DOM
-
2026-06-17days on market $95,000 Active 36 DOM
-
2026-06-16days on market $95,000 Active 35 DOM
-
2026-06-15days on market $95,000 Active 34 DOM
-
2026-06-13days on market $95,000 Active 32 DOM
-
2026-06-09days on market $95,000 Active 28 DOM
-
2026-06-08days on market $95,000 Active 27 DOM
-
2026-06-08price $95,000 Active 26 DOM
-
2026-06-07days on market $99,000 Active 26 DOM
-
2026-06-04days on market $99,000 Active 23 DOM
-
2026-06-03days on market $99,000 Active 22 DOM
-
2026-06-02days on market $99,000 Active 21 DOM
-
2026-06-01days on market $99,000 Active 20 DOM
-
2026-05-31days on market $99,000 Active 19 DOM
-
2026-05-12$105,000 Active 1617-char remark
ⓘ Source: listings_history table (triggers on properties + properties_extension) + one-shot
backfill from property_details.listing_events for pre-trigger history.
Nearby sold comps map
Loading sold comps map…
Walkable amenities ~0.75 mi
Loading nearby amenities…
Taxation est. · year 1
- Rental income
- $28,681
- − Mortgage interest
- −$5,321
- − Property taxes
- −$1,425
- − Insurance
- −$475
- − Repairs & maintenance
- −$2,295
- − Management
- −$2,295
- − Depreciation
- −$2,764
- Taxable income
- $14,107
- Est. tax owed @ 24.0%
- −$3,386
- After-tax cash flow
- $11,394/yr
For passive investors: Depreciation is non-cash, so a rental often shows a tax loss while cash-flowing — sheltering income. Rental losses are passive: they offset passive income freely, and up to $25,000/yr can offset ordinary (W-2) income if you actively participate and your MAGI is under $100k (phasing out to $0 by $150k); unused losses carry forward. On sale, claimed depreciation is recaptured at up to 25%, and gains may owe capital-gains tax (a 1031 exchange can defer both). Figures are a year-1 estimate at your 24.0% rate — not tax advice; consult a CPA.
Condition & rehab AI · 1 photo
This beautifully renovated 3-bedroom, 2-bath manufactured home is move-in ready with modern updates and fresh finishes. The property offers a bright, open-concept layout and is situated in a desirable location.
Value-add opportunities
- Both Painting exterior siding — Enhances curb appeal and value.
- Both Landscaping improvements — Enhances curb appeal and value.
- Both New flooring in bathrooms — Improves aesthetics and functionality.
- Both New window treatments — Enhances curb appeal and value.
- Both New lighting fixtures — Enhances curb appeal and value.
Renovation cost estimate screening
Value-add ROI direction
- Both Painting exterior siding — Enhances curb appeal and value. ↑
- Both Landscaping improvements — Enhances curb appeal and value. ↑
- Both New flooring in bathrooms — Improves aesthetics and functionality. ↑
- Both New window treatments — Enhances curb appeal and value. ↑
- Both New lighting fixtures — Enhances curb appeal and value. ↑
ⓘ Cost ranges are severity-bucket heuristics (US national rule-of-thumb). Get contractor quotes + a written scope before underwriting a rehab budget.
Schools (NCES district)
- District
- Colonial School District
- NCES district ID
- 1000230
- Math proficiency
- 15% ▼ -10.00%
- Reading proficiency
- 30% ▼ -9.00%
- Median HH income
- $58,622
- Composite
- 20.75/100
- National rank
- #8517
- State rank
- #23 of 26 in DE
Livability — St. Georges
No livability data for this city. (Only ~50 U.S. cities are tracked.)
Census & demographics
- County
- New Castle County · 483,412 people
- City population
- 182
- Metro
- Philadelphia-Camden-Wilmington, PA-NJ-DE-MD
- Population (ZIP)
- 42,984
- Household income
- $111,198
- Rent vs Own
- Severe rent burden
- 619.0
Population outlook (New Castle County) Hauer SSP2
- Today (2025)
- 594,686 people
- By 2030
- 609,164 · +2.4%
- By 2040
- 632,154 · +6.3%
- By 2050
- 649,068 · +9.1%
- By 2075
- 687,771 · +15.7%
- By 2100
- 694,961 · +16.9%
Race, ethnicity, and origin ACS 2023
- Neighborhood character
- Diverse neighborhood (Simpson 0.67)
- Race & ethnicity
- White 50% Black 26% Hispanic / Latino 11% Asian 10% Two or more races 7%
- Hispanic origin (detail)
- Mexican 4% Puerto Rican 4%
- Common ancestry
- Romanian 4% Lithuanian 2% Slovak 1%
- Foreign-born
- 17% · Canada, China, Vietnam
- Languages at home
- 78% English-only · Spanish 8% Other Asian/Pacific 3% Other Indo-European 3%
Political lean MEDSL · New Castle
- 2024 margin
- Solid D (+32.6) · D 65.5% · R 32.9% · Other 1.6%
- 2008→2024 swing
- -8.1pp toward R · 2008: 40.6pp · 2024: 32.6pp
- All cycles
- 2024: D+32.6 2020: D+37.1 2016: D+29.6 2012: D+34.1 2008: D+40.6
Not yet ingested
- Civics
- —
Market trends
- HPI YoY
- ▼ -159.00%
- Current HPI
- 261.2988
- Rent YoY
- ▲ 9.03%
- Metro
- Philadelphia-Camden-Wilmington, PA-NJ-DE-MD
- State GDP YoY
- —
- F500 in state
- 0
Price history
-9.5% since first listed4 events — show timeline
- 2026-06-08 Price Changed $95,000 BRIGHT MLS
- 2026-05-29 Price Changed $99,000 BRIGHT MLS
- 2026-05-24 Price Changed $104,000 BRIGHT MLS
- 2026-05-12 Listed $105,000 BRIGHT MLS
Cash-flow waterfall
monthlySold comps — $/sqft
last 12 mo · ≤1 miLoading sold comps…