 Multi-family
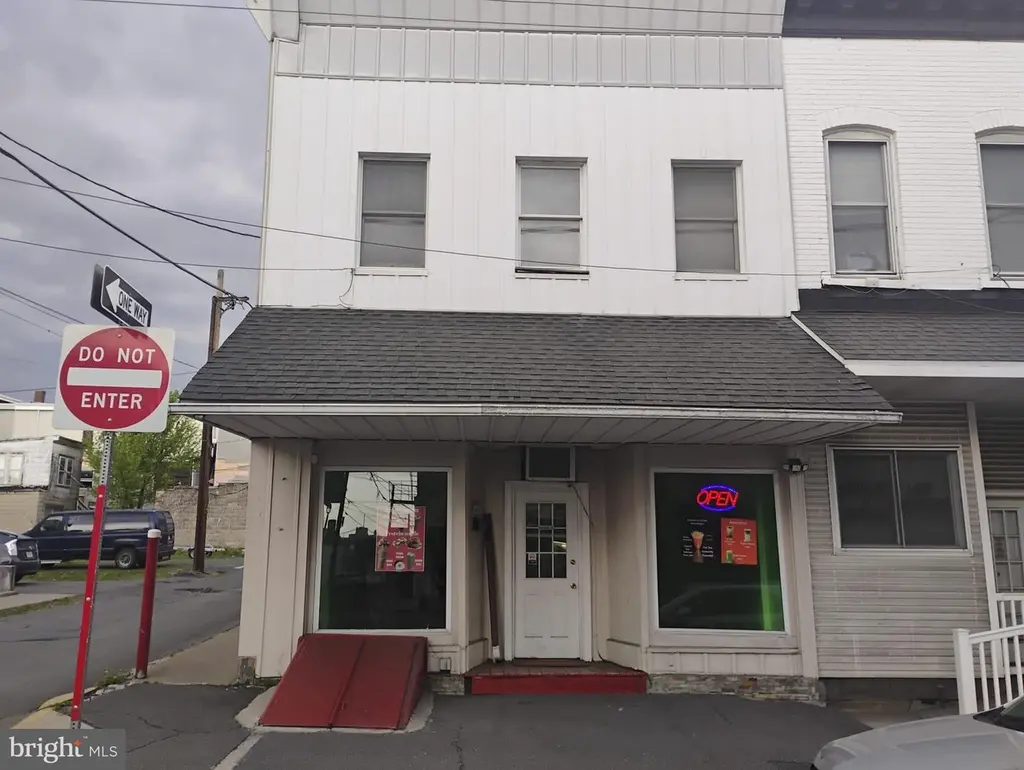
21 E Centre St · Shenandoah, PA
Flood risk No data
- FEMA flood zone
- —
- Chance of flooding over 30 yrs
- —
- Est. flood insurance / yr
- —
Fire risk No data
- Est. fire insurance / yr
- —
Heat risk No data
- Hot days now (above threshold)
- —
- Hot days in 30 yrs
- —
Wind risk No data
- Chance of severe wind over 30 yrs
- —
Air-quality risk No data
- Unhealthy air days now
- —
- Unhealthy air days in 30 yrs
- —
Risk factors via First Street. Map © Google.
Why this score? — see what drove the B+ grade
The composite is a weighted blend of 9 inputs, each scored 0–100. Each bar is that input's sub-score; the figure is the points it added to the 100-point composite (weight × sub-score).
- Cash flow +30.0/30.0
- 1% rule +10.0/10.0
- DSCR +10.0/10.0
- ARV discount +7.5/15.0
- Appreciation +6.9/10.0
- Livability +3.6/5.0
- Rent growth +2.5/5.0
- Condition / age +2.5/5.0
- Schools +2.4/10.0
$224,900
🖨 Deal sheet (PDF) 📄 Offer letter ✓ Due diligence
Multi-family units
County records classify this as Multi-Family (2-4 Unit). Listing-text estimate: 1 unit. estimate disagrees with records
Listing remarks
WELCOME TO – MIXED USE COMMERCIAL & RESIDENTIAL PROPERTY 21 E Centre St, Shenandoah, PA 17976 Excellent investment opportunity located on a high-traffic corner lot in the heart of the City of Shenandoah! This mixed-use property offers both commercial and residential potential. The first floor features a commercial storefront with front entrance with 770 SQFT area with access to an extra living room are with a half bathroom , ideal for a retail shop, office, or small business. Also on the main level, you will find a spacious living room and a huge eat-in kitchen area designed for shared use by tenant room renters. The second floor offers 3 private bedrooms and 2 full bathrooms
Key facts
- 2,614 sq ft lot
- Garage
- Built 1915
Property features AI
Finance
- Other: Living area and above/below grade area sources: Assessor
- Financial info: Total units: 2; Multi-unit details: 3 single-room units and 3 one-bedroom units (note: unit counts reflect unit types listed); Vacant units: 2; Month-to-month units: 2
- HOA & community: Information not provided
Exterior
- Parking: Detached garage (side entry, oversized) with garage door opener — 1 garage space
- Security: Information not provided
- Utilities: Public water; Public sewer; Electric service available
- Home design: Semi-detached property; Fee simple ownership; Major renovation in 2018 (effective year)
- Construction: Combination of frame, shingle siding, and vinyl siding; Other type foundation; Estimated year built
- Exterior features: Tidal water: No; Other above- and below-grade structures
Interior
- Kitchen: Built-in microwave; Stove; Refrigerator
- Bedrooms: Three one-bedroom units; Three single-room units
- Flooring: Information not provided
- Bathrooms: Information not provided
- Heating & cooling: Electric baseboard heating; 200+ amp electric service
- Interior features: Multiple access exits (2+); Semi-detached structure
- Laundry & utility: Washer; Dryer; Electric hot water
Neighborhood map
What this means for you Summary
Snapshot
- This is a 3-bed/?-bath multifamily listed at $225k.
Deal economics
- At list price, monthly cash flow is $1k ($14k/yr) — positive.
- The deal already cash-flows at list — no discount required.
- Meets the 1% rule at list price ($3k rent vs $225k).
- Recommended offer: $218k (3.0% below list) — sets the bar for market timing.
Location & tenants
- Location reads 71/100 on livability (#720 in PA) — a middle-class / working-renter tenant base. Strengths: amenities A+, cost of living A+, health & safety A+; Watch: commute F, employment F.
- Shenandoah Valley SD (town): math 20% / reading 38% proficiency, ranked #454 of 539 in PA (top 84%) — low school quality limits family demand, transient renter base, plan for 1-2y turnover; 66% free/reduced lunch — lower-income household profile, screen leases tightly.
- Zoned schools: Shenandoah Valley El Sch (math 21% / reading 41%, grade F, #1,116 of 1,518 statewide, top 74%, 667 students, 100% FRL); Shenandoah Valley Jshs (math 22% / reading 32%, grade F, #365 of 437 statewide, top 85%, 539 students, 96% FRL) — zoned schools average 98% FRL vs 66% district-wide (32 pts higher); higher-poverty schools than district average — tighter screening recommended.
- Market conditions: 63 active listings in the ZIP; 3 comparable units currently listed for rent nearby; rentals lingering (median 45d on market — plan ~5-8 weeks vacancy on turnover, expect pricing pressure); 100% of comp listings sitting > 30 days — soft ceiling on asking rent; 169 units permitted in Schuylkill County in 2024 (0 in 5+ unit buildings).
Forward outlook
- In year one you build about $10k of equity ($2k loan paydown + $9k appreciation (3.8% local appreciation)).
- Schuylkill County population projected at -16% by 2050 — secular population decline; favor cash flow + early exit over multi-decade hold.
- At projected returns (3.8% appreciation + 3.0% rent growth), your $63k cash investment doubles in ~3 years — after that, you're playing with house money.
- By year 4, paydown + projected appreciation supports a ~$34k cash-out refi (75% LTV) — recoverable capital for the next deal without selling this one.
Negotiation context
- It's been on market 45 days — a 3% lower offer ($218k) is reasonable based on typical stale-listing flexibility.
- 3 sale attempts since 15y ago with the ask held roughly flat each time — persistent listings suggest the price (not the market) is what's stuck; bring a comps-based counter.
Risks & watch-outs
- Watch-outs: built in 1915 — expect roof / HVAC / electrical / plumbing capex.
Questions for the listing agent
- It's been on market 45 days. Have you received any prior offers? Is the seller open to a 3% concession, seller financing, or rate buy-down credit?
- Built in 1915 — when were the roof, HVAC, electrical panel, plumbing, and water heater last replaced?
- Is there a deadline driving the sale (1031 exchange, divorce, estate, relocation)? That informs how much negotiation room exists.
- Schools are D-rated, which usually means shorter tenancies and higher turnover. Who's the typical renter profile here, and what's been the actual vacancy rate?
- What's the average days-on-market for RENTAL listings here right now (not sales)? A rising rental-DOM trend means longer vacancies and softer asking-rent achievability than the comps imply.
- What's the recent tenant-quality profile in this submarket — average credit score on applications, eviction rate, late-payment / NSF rate, and stable-employment percentage? A property-management company in the area should have these aggregated.
- How much new apartment / multifamily construction is in the pipeline within 1–3 miles? Heavy new supply (>2% of stock underway) typically softens rents 12–24 months out; light construction supports rent growth.
Investment metrics
- 1% rule
- 1.55% ✓
- Cap rate
- 12.69%
- Cash-on-cash
- 22.85%
- DSCR
- 2.02
- GRM
- 5.4
CMA / ARV
- ARV (median comp)
- $143,146
- List price
- $224,900
- Delta
- 57.11%
- Verdict
- OVERPRICED
- Comps
- 13 within 1.0 mi
Show comp detail 2 sales within ~0.75 mi
| Address | Dist | Beds/Ba | Sqft | Sold | Price | $/sf | Match |
|---|---|---|---|---|---|---|---|
| 212 E Lloyd St | 0.13mi | 3/— | 1,200 | 9mo | $30,000 | $25 | 74 |
| 318 W Centre St | 0.26mi | 2/— (-1) | — | 9mo | $110,000 | — | 63 |
Match score weights: distance 35% · size 25% · config 20% · recency 20%. Top-matched comps best support the ARV.
Projected returns pro-forma
3.84% appreciation · 3.0% rent growth · sell at horizon
- IRR
- 30.6%
- Equity multiple
- 2.81×
- Total profit
- $113,713
- Equity at exit
- $111,985
- IRR
- 30.3%
- Equity multiple
- 5.54×
- Total profit
- $285,720
- Equity at exit
- $181,549
Cash invested: $62,972 (down + closing). Projections, not guarantees.
Landlord ↔ Tenant lean methodology
- Overall (STATE)
- 62 Landlord-Friendly
- State Pennsylvania
- 62 Landlord-Friendly · EVEN
- County
- — inherits STATE
- City
- — inherits STATE
ZIP-level market 17976
- Home prices YoY
- 1.3%
- Active inventory
- 63
- Price-to-rent
- 21.5×
Monthly cashflow live
- Estimated rent
- $3,485 medium interval (Pro) →
- Mortgage (P&I)
- −$1,179
- Tax est. 1.5%
- −$281 /mo · $3,374/yr
- Insurance
- −$94
- HOA
- −$0
- Vacancy / Maint / Mgmt
- −$732
- Net cashflow
- $1,199
Break-even live
Sensitivity live
| Price | -10% $1,354 | -5% $1,277 | +0% $1,199 | +5% $1,121 | +10% $1,043 |
|---|---|---|---|---|---|
| Rent | -10% $924 | -5% $1,061 | +0% $1,199 | +5% $1,337 | +10% $1,474 |
| Rate | -1.0pp $1,312 | -0.5pp $1,256 | base $1,199 | +0.5pp $1,141 | +1.0pp $1,081 |
4-unit breakdown (identical units grouped — click to expand)
| Units | Beds | Baths | Est. rent |
|---|---|---|---|
| 4× units | 1 | 1 | $3,484 |
| #1 | 1 | 1 | $871 |
| #2 | 1 | 1 | $871 |
| #3 | 1 | 1 | $871 |
| #4 | 1 | 1 | $871 |
| Total (4 units) | $3,485 | ||
UW: 25.0% down · 7.5% · 30yr · 1.5% tax · 5.0% vac · 8.0% maint · 8.0% mgmt
Financing live
Cash to close
- Down payment
- $56,225
- Closing costs
- $6,747
- Reserves months
- —
- Total cash needed
- —
Loan-product check · same deal, 3 products live
Conventional
25% down · 7.5% · 30yr
- Down + closing
- —
- Monthly P&I
- —
- Monthly cashflow
- —
- DSCR
- —
- Eligible?
- —
Personal DTI + credit; lowest rate.
DSCR
20% down · 8.5% · 30yr
- Down + closing
- —
- Monthly P&I
- —
- Monthly cashflow
- —
- DSCR
- —
- Eligible?
- —
No personal income docs; deal must DSCR.
Hard money
10% down · 12.0% · 12mo
- Down + closing
- —
- Monthly P&I
- —
- Monthly cashflow
- —
- DSCR
- —
- Eligible?
- —
Short-term bridge; refi at stabilization.
Rent comps 3 comps
| Address | Beds | Baths | Sqft | Rent | $/sqft | DOM | Units | Dist |
|---|---|---|---|---|---|---|---|---|
| 25 E Oak St Shenandoah, PA | 4.0 | 1.5 | 2220 | $1,450 | $0.65 | 45d | 1 | 0.09mi |
| 5 S Jardin St Unit 1 Shenandoah, PA | 2.0 | 1.0 | 550 | $725 | $1.32 | 45d | 1 | 0.14mi |
| 230 W Arlington St Shenandoah, PA | 3.0 | 1.0 | 1143 | $1,400 | $1.22 | 45d | 1 | 0.24mi |
Listing history 22 events
-
2026-06-21days on market $224,900 Active 45 DOM
-
2026-06-21days on market $224,900 Active 44 DOM
-
2026-06-18days on market $224,900 Active 42 DOM
-
2026-06-17days on market $224,900 Active 41 DOM
-
2026-06-16days on market $224,900 Active 40 DOM
-
2026-06-15days on market $224,900 Active 39 DOM
-
2026-06-13days on market $224,900 Active 37 DOM
-
2026-06-12days on market $224,900 Active 36 DOM
-
2026-06-09days on market $224,900 Active 33 DOM
-
2026-06-08days on market $224,900 Active 32 DOM
-
2026-06-08days on market $224,900 Active 31 DOM
-
2026-06-07days on market $224,900 Active 30 DOM
-
2026-06-04days on market $224,900 Active 27 DOM
-
2026-06-02days on market $224,900 Active 26 DOM
-
2026-06-01days on market $224,900 Active 25 DOM
-
2026-05-31days on market $224,900 Active 24 DOM
-
2026-05-08$224,900 Active 1018-char remark
-
2026-05-06historical $224,900 1018-char remark
-
2015-12-14$38,000
-
2015-12-14historical
-
2011-06-13$38,000
-
2011-06-13historical
ⓘ Source: listings_history table (triggers on properties + properties_extension) + one-shot
backfill from property_details.listing_events for pre-trigger history.
Nearby sold comps map
Loading sold comps map…
Walkable amenities ~0.75 mi
Loading nearby amenities…
Taxation est. · year 1
- Rental income
- $41,820
- − Mortgage interest
- −$12,598
- − Property taxes
- −$3,374
- − Insurance
- −$1,124
- − Repairs & maintenance
- −$3,346
- − Management
- −$3,346
- − Depreciation
- −$6,543
- Taxable income
- $11,490
- Est. tax owed @ 24.0%
- −$2,758
- After-tax cash flow
- $11,629/yr
For passive investors: Depreciation is non-cash, so a rental often shows a tax loss while cash-flowing — sheltering income. Rental losses are passive: they offset passive income freely, and up to $25,000/yr can offset ordinary (W-2) income if you actively participate and your MAGI is under $100k (phasing out to $0 by $150k); unused losses carry forward. On sale, claimed depreciation is recaptured at up to 25%, and gains may owe capital-gains tax (a 1031 exchange can defer both). Figures are a year-1 estimate at your 24.0% rate — not tax advice; consult a CPA.
Schools (NCES district)
- District
- Shenandoah Valley SD
- NCES district ID
- 4221490
- Math proficiency
- 20% ▼ -8.00%
- Reading proficiency
- 38% ▼ -6.00%
- Median HH income
- $31,968
- Composite
- 23.58/100
- National rank
- #7851
- State rank
- #454 of 539 in PA
Livability — Shenandoah
- Score
- 71/100
- State rank
- #720
- US rank
- #7134
Category grades
Schools grade is shown separately in the Schools card above.
Census & demographics
- Census place
- Shenandoah, PA
- City population
- 5,988
- Population (ZIP)
- 5,988
Population outlook (Schuylkill County) Hauer SSP2
- Today (2025)
- 137,447 people
- By 2030
- 133,121 · -3.1%
- By 2040
- 124,172 · -9.7%
- By 2050
- 115,611 · -15.9%
- By 2075
- 100,796 · -26.7%
- By 2100
- 86,667 · -36.9%
Race, ethnicity, and origin ACS 2023
- Neighborhood character
- Majority White (63%)
- Race & ethnicity
- White 63% Hispanic / Latino 34% Two or more races 12% Black 2%
- Hispanic origin (detail)
- Mexican 10% Puerto Rican 8% Dominican 11%
- Common ancestry
- Romanian 20% Iranian 2% Scotch-Irish 2%
- Foreign-born
- 10% · Canada
- Languages at home
- 68% English-only · Spanish 30% Russian/Polish/Slavic 1%
Political lean MEDSL · Schuylkill
- 2024 margin
- Solid R (+42.1) · D 28.5% · R 70.6%
- 2008→2024 swing
- -33.4pp toward R · 2008: -8.7pp · 2024: -42.1pp
- All cycles
- 2024: R+42.1 2020: R+39.9 2016: R+43.4 2012: R+13.4 2008: R+8.7
Not yet ingested
- Civics
- —
Market trends
- HPI YoY
- ▲ 3.84%
- Current HPI
- 308.8036
- Rent YoY
- —
- Metro
- —
- State GDP YoY
- ▲ 1.68%
- F500 in state
- 34
Industry mix (Fortune 500 HQ in PA)
| Industry | F500 HQs | Revenue |
|---|---|---|
| Healthcare | 2 | $309B |
|
||
| Insurance | 2 | $27B |
|
||
| Telecommunications / Media | 1 | $124B |
|
||
| Industrial Distribution | 1 | $22B |
|
||
| Financial Services | 1 | $20B |
|
||
| Chemicals / Materials | 1 | $18B |
|
||
Price history
+491.8% since first listed6 events — show timeline
- 2026-05-08 Listed $224,900 BRIGHT MLS
- 2026-05-06 Coming Soon $224,900 BRIGHT MLS
- 2015-12-14 Listing Removed — BRIGHT MLS
- 2015-12-14 Listed $38,000 BRIGHT MLS
- 2011-06-13 Listing Removed — BRIGHT MLS
- 2011-06-13 Listed $38,000 BRIGHT MLS
Cash-flow waterfall
monthlySold comps — $/sqft
last 12 mo · ≤1 miLoading sold comps…