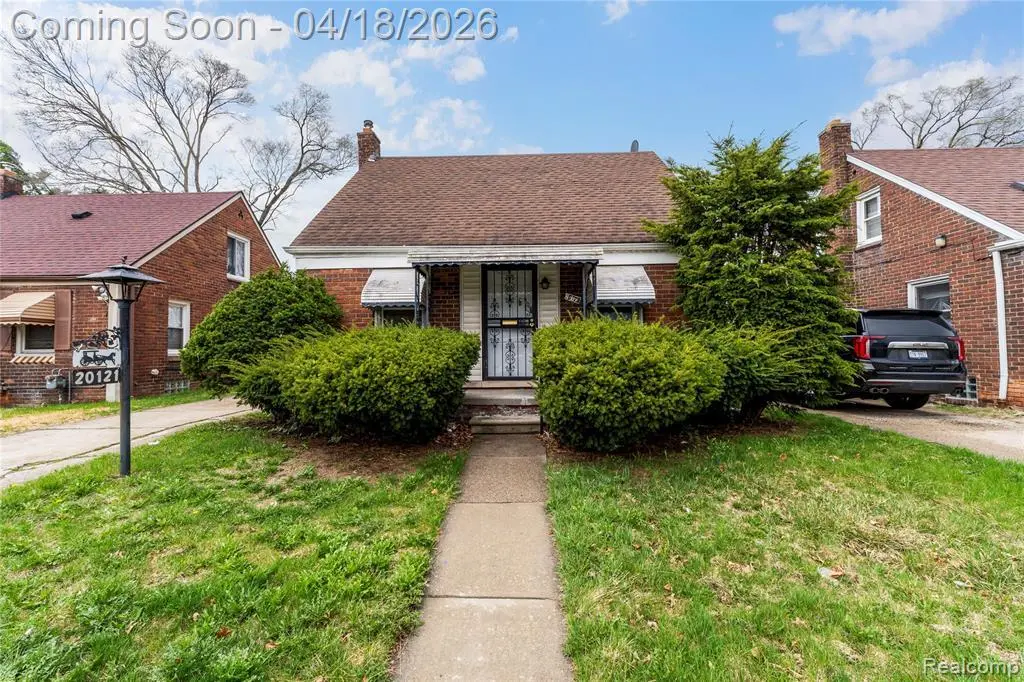
20121 Mitchell St · Detroit, MI
Flood risk 6/10 · Moderate
- FEMA flood zone
- X (unshaded)
- Chance of flooding over 30 yrs
- 0.67%
- Est. flood insurance / yr
- $473 – $860
Fire risk 1/10 · Minimal
- Est. fire insurance / yr
- $784 – $1,456
Heat risk 3/10 · Minor
- Hot days now (above 97°F)
- 7 days/yr
- Hot days in 30 yrs
- 15 days/yr
Wind risk 2/10 · Minimal
- Chance of severe wind over 30 yrs
- —
Air-quality risk 4/10 · Minor
- Unhealthy air days now
- 4 days/yr
- Unhealthy air days in 30 yrs
- 6 days/yr
Risk factors via First Street. Map © Google.
Why this score? — see what drove the B- grade
The composite is a weighted blend of 9 inputs, each scored 0–100. Each bar is that input's sub-score; the figure is the points it added to the 100-point composite (weight × sub-score).
- Cash flow +30.0/30.0
- 1% rule +10.0/10.0
- DSCR +10.0/10.0
- ARV discount +7.6/15.0
- Rent growth +4.2/5.0
- Livability +3.7/5.0
- Condition / age +2.5/5.0
- Schools +1.3/10.0
- Appreciation +0.0/10.0
$69,900
🖨 Deal sheet 📄 Offer letter ✓ Due diligence
Listing remarks MLS
Welcome to this classic Detroit brick bungalow full of character and possibility. Step inside to find a warm and inviting atmosphere with plenty of natural light, hardwood accents, and comfortable living spaces designed for everyday life. The kitchen offers a cozy place for meals, while the bright sunroom is ideal for morning coffee or quiet evenings at home. A full basement adds storage and flexibility, giving you room to expand or create the space you’ve been imagining. This home is move-in ready while also offering the opportunity to add your own personal style over time. Whether it’s cosmetic updates or thoughtful upgrades, the solid structure and timeless design make it a great foundation for your vision. Conveniently located near shopping, schools, and healthcare, with parks and recreation like Palmer Park, Belle Isle, and the Detroit Zoo just a short drive away, this home combines comfort with accessibility. A wonderful option for buyers looking for charm, value, and the chance to make a home truly their own.
Key facts
- 4,356 sq ft lot
- Built 1943
- Listed 61 days
Neighborhood map
What this means for you Summary
Snapshot
- This is a 3-bed/1.0-bath single-family listed at $70k.
Deal economics
- At list price, monthly cash flow is $497 ($6k/yr) — positive.
- The deal already cash-flows at list — no discount required.
- Meets the 1% rule at list price ($1k rent vs $70k).
- Recommended offer: $66k (6.0% below list) — sets the bar for market timing.
- Cap rate 14.8% vs local median 10.2% in Detroit — top-decile yield for the area; either an underpriced asset or a hidden risk that comps aren't pricing in. Stress-test before assuming the spread holds.
Location & tenants
- Location reads 73/100 on livability (#218 in MI) — a middle-class / working-renter tenant base. Strengths: amenities A+, commute A+, cost of living A+; Watch: schools F, crime F, employment F.
- Detroit Public Schools Community District (urban): math 10% / reading 24% proficiency, ranked #499 of 540 in MI (top 92%) — low school quality limits family demand, transient renter base, plan for 1-2y turnover; 90% free/reduced lunch — lower-income household profile, screen leases tightly.
- Market conditions: Rents rising fast (+6.7%/yr); 226 active listings in the ZIP; 31 comparable units currently listed for rent nearby; rentals at typical pace (median 18d on market — plan ~3-4 weeks tenant-placement turnaround); lower-income renter base — watch delinquency; 2,639 units permitted in Wayne County in 2024 (1,216 in 5+ unit buildings).
- At $1,338/mo this rent would consume 45% of the median local household income ($35k/yr) (locally 2372% of renters already pay >50% of income on rent) — very limited rent-growth headroom before tenants either downsize or default.
Forward outlook
- Local home prices are declining (-3.0%/yr); year-one equity from $483 of loan paydown is wiped out by about $2k of value loss. Plan a longer hold.
- Wayne County population projected at -17% by 2050 — secular population decline; favor cash flow + early exit over multi-decade hold.
- At projected returns (-3.0% appreciation + 6.7% rent growth), your $20k cash investment doubles in ~4 years — after that, you're playing with house money.
Negotiation context
- It's been on market 62 days — a 6% lower offer ($66k) is reasonable based on typical stale-listing flexibility.
- 17 sale attempts since 9y ago with the ask held roughly flat each time — persistent listings suggest the price (not the market) is what's stuck; bring a comps-based counter.
- Current owner paid $60k; 16% above their basis — modest negotiation headroom, anchor on the comps not their cost.
Risks & watch-outs
- Watch-outs: property tax is 2.8% of price; built in 1943 — expect roof / HVAC / electrical / plumbing capex.
- Climate carrying-cost: major flood risk — expect insurance premiums to compound above CPI over the hold.
Questions for the listing agent
- It's been on market 62 days. Have you received any prior offers? Is the seller open to a 6% concession, seller financing, or rate buy-down credit?
- Built in 1943 — when were the roof, HVAC, electrical panel, plumbing, and water heater last replaced?
- Property tax is high relative to price — has the assessment been appealed recently, and will the sale trigger a re-assessment?
- Why hasn't it sold? Are there any deal-killer items the seller is aware of (foundation, flood, title, zoning, code violations)?
- Is there a deadline driving the sale (1031 exchange, divorce, estate, relocation)? That informs how much negotiation room exists.
- Schools are F-rated, which usually means shorter tenancies and higher turnover. Who's the typical renter profile here, and what's been the actual vacancy rate?
- Crime grade is F in this area — have there been break-ins, vandalism, or insurance claims at this property in the last 3 years? What carrier currently insures it and at what premium?
- What's the average days-on-market for RENTAL listings here right now (not sales)? A rising rental-DOM trend means longer vacancies and softer asking-rent achievability than the comps imply.
- What's the recent tenant-quality profile in this submarket — average credit score on applications, eviction rate, late-payment / NSF rate, and stable-employment percentage? A property-management company in the area should have these aggregated.
- How much new for-sale + rental construction is in the pipeline within 1–3 miles? Heavy new supply typically softens prices + rents 12–24 months out; constrained supply supports both.
Investment metrics
- 1% rule
- 1.91% ✓
- Cap rate
- 14.83%
- Cash-on-cash
- 30.50%
- DSCR
- 2.36
- GRM
- 4.4
CMA / ARV
- ARV (median comp)
- $70,098
- List price
- $69,900
- Delta
- -0.28%
- Verdict
- FAIR
- Comps
- 20 within 1.0 mi
Show comp detail 12 sales within ~0.75 mi
| Address | Dist | Beds/Ba | Sqft | Sold | Price | $/sf | Match |
|---|---|---|---|---|---|---|---|
| 20180 Charest St | 0.09mi | 3/1.0 | 840 (+0%) | 4mo | $45,000 | $54 | 92 |
| 20156 Gallagher St | 0.13mi | 2/1.0 (-1) | 850 (+1%) | 8mo | $67,000 | $79 | 80 |
| 20012 Binder St | 0.44mi | 3/1.0 | 871 (+4%) | 3mo | $50,500 | $58 | 70 |
| 20270 Dean Ave | 0.56mi | 3/1.0 | 792 (-6%) | 7mo | $55,000 | $69 | 59 |
| 19619 Norwood St | 0.43mi | 3/1.0 | 941 (+12%) | 2mo | $30,500 | $32 | 58 |
| 19444 Yonka St | 0.51mi | 3/1.0 | 900 (+7%) | 8mo | $85,000 | $94 | 57 |
| 19300 Binder St | 0.68mi | 2/1.0 (-1) | 820 (-2%) | 4mo | $10,000 | $12 | 56 |
| 19227 Ryan Rd | 0.74mi | 3/1.0 | 919 (+10%) | 1mo | $38,000 | $41 | 48 |
| 20499 Binder St | 0.47mi | 3/1.0 | 712 (-15%) | 6mo | $72,100 | $101 | 48 |
| 19667 Sunset St | 0.65mi | 3/1.5 | 752 (-10%) | 4mo | $28,500 | $38 | 47 |
| 19255 Binder St | 0.69mi | 2/1.0 (-1) | 719 (-14%) | 3mo | $38,500 | $54 | 36 |
| 19235 Fleming St | 0.65mi | 2/1.0 (-1) | 720 (-14%) | 6mo | $57,000 | $79 | 36 |
Match score weights: distance 35% · size 25% · config 20% · recency 20%. Top-matched comps best support the ARV.
Projected returns pro-forma
-3.0% appreciation · 6.72% rent growth · sell at horizon
- IRR
- 29.7%
- Equity multiple
- 2.31×
- Total profit
- $25,616
- Equity at exit
- $10,422
- IRR
- 39.2%
- Equity multiple
- 5.41×
- Total profit
- $86,392
- Equity at exit
- $6,044
Cash invested: $19,572 (down + closing). Projections, not guarantees.
Landlord ↔ Tenant lean methodology
- Overall (STATE)
- 62 Landlord-Friendly
- State Michigan
- 62 Landlord-Friendly · EVEN
- County
- — inherits STATE
- City
- — inherits STATE
ZIP-level market 48234
- Home prices YoY
- -11.9%
- Rents YoY
- 6.7%
- Active inventory
- 226
- Price-to-rent
- 4.4×
Monthly cashflow live
- Estimated rent
- $1,338 high interval (Pro) →
- Mortgage (P&I)
- −$367
- Tax from tax record
- −$164 /mo · $1,969/yr
- Insurance
- −$29
- HOA
- −$0
- Vacancy / Maint / Mgmt
- −$281
- Net cashflow
- $497
Break-even live
UW: 25.0% down · 7.5% · 30yr · 1.5% tax · 5.0% vac · 8.0% maint · 8.0% mgmt
Financing live
Cash to close
- Down payment
- $17,475
- Closing costs
- $2,097
- Reserves months
- —
- Total cash needed
- —
Loan-product check · same deal, 3 products live
Conventional
25% down · 7.5% · 30yr
- Down + closing
- —
- Monthly P&I
- —
- Monthly cashflow
- —
- DSCR
- —
- Eligible?
- —
Personal DTI + credit; lowest rate.
DSCR
20% down · 8.5% · 30yr
- Down + closing
- —
- Monthly P&I
- —
- Monthly cashflow
- —
- DSCR
- —
- Eligible?
- —
No personal income docs; deal must DSCR.
Hard money
10% down · 12.0% · 12mo
- Down + closing
- —
- Monthly P&I
- —
- Monthly cashflow
- —
- DSCR
- —
- Eligible?
- —
Short-term bridge; refi at stabilization.
Rent comps 31 comps
| Address | Beds | Baths | Sqft | Rent | $/sqft | DOM | Units | Dist |
|---|---|---|---|---|---|---|---|---|
| 20255 Harned St Detroit, MI | 3.0 | 1.0 | 1000 | $1,374 | $1.37 | 16d | 1 | 0.14mi |
| 19694 Gallagher St Detroit, MI | 3.0 | 1.0 | 1000 | $1,150 | $1.15 | 14d | 1 | 0.29mi |
| 19930 Binder St Detroit, MI | 3.0 | 1.0 | 1000 | $1,450 | $1.45 | 16d | 1 | 0.46mi |
| 19450 Norwood St Detroit, MI | 3.0 | 1.0 | 1000 | $1,200 | $1.20 | 4d | 1 | 0.47mi |
| 19360 Revere St Detroit, MI | 3.0 | 1.0 | 1050 | $1,250 | $1.19 | 24d | 1 | 0.51mi |
| 21155 Warner Ave Warren, MI | 2.0 | 1.0 | 756 | $1,029 | $1.36 | 24d | 1 | 0.59mi |
| 2034 John B Ave Warren, MI | 3.0 | 1.0 | 920 | $1,261 | $1.37 | 43d | 1 | 0.61mi |
| 21516 Dequindre Rd Warren, MI | 1.0–2.0 | 1.0 | 837 | $1,375 | $1.64 | 21d | 1 | 0.85mi |
| 18666 Joseph Campau St Detroit, MI | 3.0 | 1.0 | 1000 | $1,400 | $1.40 | 16d | 1 | 0.87mi |
| 18629 Fleming St Detroit, MI | 3.0 | 1.5 | 900 | $1,150 | $1.28 | 24d | 1 | 0.95mi |
| 18882 Marx St Highland Park, MI | 2.0 | 1.0 | 1000 | $1,300 | $1.30 | 43d | 1 | 0.96mi |
| 1621 E Evelyn Ave Hazel Park, MI | 2.0 | 1.0 | 749 | $1,295 | $1.73 | 17d | 1 | 1.03mi |
| 19450 Fenelon St Detroit, MI | 3.0 | 1.0 | 1062 | $1,384 | $1.30 | 4d | 1 | 1.04mi |
| 18551 Saint Aubin St Detroit, MI | 3.0 | 1.0 | 962 | $1,200 | $1.25 | 16d | 1 | 1.06mi |
| 18662 Sunset St Detroit, MI | 2.0 | 1.0 | 726 | $1,250 | $1.72 | 17d | 1 | 1.07mi |
| 20794 Audrey Ave Warren, MI | 3.0 | 1.0 | 954 | $1,350 | $1.42 | 43d | 1 | 1.10mi |
| 1211 E Bernhard Ave Hazel Park, MI | 2.0 | 1.0 | 721 | $1,500 | $2.08 | 24d | 1 | 1.13mi |
| 18084 Goddard St Detroit, MI | 2.0 | 1.5 | 790 | $1,050 | $1.33 | 16d | 1 | 1.13mi |
| 1326 E Evelyn Ave Unit 1032332P Hazel Park, MI | 3.0 | 2.0 | 1097 | $6,448 | $5.88 | 1d | 1 | 1.15mi |
| 1019 E Hayes Ave Unit 1032331P Hazel Park, MI | 3.0 | 1.0 | 1033 | $5,301 | $5.13 | 1d | 1 | 1.16mi |
| 19162 Conley St Detroit, MI | 2.0 | 1.0 | 1000 | $1,300 | $1.30 | 43d | 1 | 1.21mi |
| 19361 Moenart St Unit 1 Detroit, MI | 2.0 | 1.0 | 1000 | $1,100 | $1.10 | 23d | 1 | 1.22mi |
| 1731 E Pearl Ave Hazel Park, MI | 3.0 | 1.0 | 844 | $1,500 | $1.78 | 20d | 1 | 1.24mi |
| 20263 Caldwell St Detroit, MI | 3.0 | 1.0 | 909 | $1,350 | $1.49 | 16d | 1 | 1.30mi |
| 19260 Bloom St Detroit, MI | 3.0 | 1.0 | 1100 | $1,350 | $1.23 | 4d | 1 | 1.33mi |
| 18891 Moenart St Detroit, MI | 3.0 | 1.0 | 870 | $1,195 | $1.37 | 16d | 1 | 1.35mi |
| 18884 Bloom St Detroit, MI | 3.0 | 1.0 | 979 | $975 | $1.00 | 43d | 1 | 1.42mi |
| 18884 Bloom St Detroit, MI | 3.0 | 1.0 | 979 | $975 | $1.00 | 21d | 1 | 1.42mi |
| 21410 Panama St Warren, MI | 3.0 | 1.0 | 900 | $1,600 | $1.78 | 24d | 1 | 1.42mi |
| 19703 Keating St Highland Park, MI | 3.0 | 1.0 | 1000 | $1,200 | $1.20 | 16d | 1 | 1.45mi |
| 407 E Hayes Ave Hazel Park, MI | 3.0 | 1.0 | 1000 | $1,750 | $1.75 | 24d | 1 | 1.49mi |
Listing history 50 events
-
2026-06-18days on market $69,900 Active 62 DOM
-
2026-06-17days on market $69,900 Active 61 DOM
-
2026-06-15days on market $69,900 Active 59 DOM
-
2026-06-13days on market $69,900 Active 57 DOM
-
2026-06-13days on market $69,900 Active 56 DOM
-
2026-06-09days on market $69,900 Active 53 DOM
-
2026-06-08days on market $69,900 Active 52 DOM
-
2026-06-07days on market $69,900 Active 51 DOM
-
2026-06-04days on market $69,900 Active 48 DOM
-
2026-06-03days on market $69,900 Active 47 DOM
-
2026-06-02days on market $69,900 Active 46 DOM
-
2026-06-01days on market $69,900 Active 45 DOM
-
2026-05-31days on market $69,900 Active 44 DOM
-
2026-04-18$69,900 Active 1043-char remark
Show marketing remark (1031 chars)
Welcome to this classic Detroit brick bungalow full of character and possibility. Step inside to find a warm and inviting atmosphere with plenty of natural light, hardwood accents, and comfortable living spaces designed for everyday life. The kitchen offers a cozy place for meals, while the bright sunroom is ideal for morning coffee or quiet evenings at home. A full basement adds storage and flexibility, giving you room to expand or create the space you've been imagining. This home is move-in ready while also offering the opportunity to add your own personal style over time. Whether it's cosmetic updates or thoughtful upgrades, the solid structure and timeless design make it a great foundation for your vision. Conveniently located near shopping, schools, and healthcare, with parks and recreation like Palmer Park, Belle Isle, and the Detroit Zoo just a short drive away, this home combines comfort with accessibility. A wonderful option for buyers looking for charm, value, and the chance to make a home truly their own.
-
2026-04-18$69,900 Active 1031-char remark
Show marketing remark (1031 chars)
Welcome to this classic Detroit brick bungalow full of character and possibility. Step inside to find a warm and inviting atmosphere with plenty of natural light, hardwood accents, and comfortable living spaces designed for everyday life. The kitchen offers a cozy place for meals, while the bright sunroom is ideal for morning coffee or quiet evenings at home. A full basement adds storage and flexibility, giving you room to expand or create the space you've been imagining. This home is move-in ready while also offering the opportunity to add your own personal style over time. Whether it's cosmetic updates or thoughtful upgrades, the solid structure and timeless design make it a great foundation for your vision. Conveniently located near shopping, schools, and healthcare, with parks and recreation like Palmer Park, Belle Isle, and the Detroit Zoo just a short drive away, this home combines comfort with accessibility. A wonderful option for buyers looking for charm, value, and the chance to make a home truly their own.
-
2026-04-16historical $69,900 1031-char remark
Show marketing remark (1031 chars)
Welcome to this classic Detroit brick bungalow full of character and possibility. Step inside to find a warm and inviting atmosphere with plenty of natural light, hardwood accents, and comfortable living spaces designed for everyday life. The kitchen offers a cozy place for meals, while the bright sunroom is ideal for morning coffee or quiet evenings at home. A full basement adds storage and flexibility, giving you room to expand or create the space you've been imagining. This home is move-in ready while also offering the opportunity to add your own personal style over time. Whether it's cosmetic updates or thoughtful upgrades, the solid structure and timeless design make it a great foundation for your vision. Conveniently located near shopping, schools, and healthcare, with parks and recreation like Palmer Park, Belle Isle, and the Detroit Zoo just a short drive away, this home combines comfort with accessibility. A wonderful option for buyers looking for charm, value, and the chance to make a home truly their own.
-
2025-12-09historical
-
2025-12-09historical
-
2025-09-26price $84,900
-
2025-09-25price $84,900
-
2025-09-04$99,900 Active
-
2025-09-04$99,900 Active
-
2024-09-02historical $1,000
-
2024-08-01$1,000
-
2024-08-01historical $1,000
-
2024-08-01$1,000
-
2024-07-24historical $1,000
-
2024-07-22$1,000
-
2023-08-23historical
-
2023-08-23historical
-
2023-08-07$89,900 Active
-
2023-08-07$89,900 Active
-
2023-03-02soldstatus $60,000
-
2021-10-19soldstatus $60,000 Sold
-
2021-10-19soldstatus $60,000 Closed
-
2021-10-18status Pending
-
2021-10-18status Pending
-
2021-09-29status Active
-
2021-09-29status Active
-
2021-09-20status Pending
-
2021-09-20status Pending
-
2021-09-07price $59,900
-
2021-09-07price $59,900
-
2021-08-28$64,900 Active
-
2021-08-28$64,900 Active
-
2021-08-27historical $64,900
-
2021-08-27historical $64,900
-
2021-03-05soldstatus $46,500
-
2020-10-21soldstatus $46,000 Sold
-
2020-10-21soldstatus $46,000 Closed
ⓘ Source: listings_history table (triggers on properties + properties_extension) + one-shot
backfill from property_details.listing_events for pre-trigger history.
Tax reassessment forecast MI · Partial reset (capped growth)
- Current annual tax
- $1,969 · $164/mo
- Projected year-2 tax
- $1,969 · $164/mo
- Expected delta
- $0/yr ($0/mo · 0.0%)
ⓘ Screening estimate from a state-policy table — verify with the county assessor before closing.
Climate risk First Street
- Flood 6/10 Major FEMA zone X (unshaded) · 67% chance over 30 yrs
- Wildfire 1/10 Low
- Heat 3/10 Moderate 7 d/yr ≥97°F today · 15 d/yr by 30 yrs out
- Wind 2/10 Low
- Air quality 4/10 Moderate 4 unhealthy d/yr today · 6 by 30 yrs out
Nearby sold comps map
Loading sold comps map…
Walkable amenities ~0.75 mi
Loading nearby amenities…
Taxation est. · year 1
- Rental income
- $16,058
- − Mortgage interest
- −$3,915
- − Property taxes
- −$1,969
- − Insurance
- −$350
- − Repairs & maintenance
- −$1,285
- − Management
- −$1,285
- − Depreciation
- −$2,033
- Taxable income
- $5,222
- Est. tax owed @ 24.0%
- −$1,253
- After-tax cash flow
- $4,716/yr
For passive investors: Depreciation is non-cash, so a rental often shows a tax loss while cash-flowing — sheltering income. Rental losses are passive: they offset passive income freely, and up to $25,000/yr can offset ordinary (W-2) income if you actively participate and your MAGI is under $100k (phasing out to $0 by $150k); unused losses carry forward. On sale, claimed depreciation is recaptured at up to 25%, and gains may owe capital-gains tax (a 1031 exchange can defer both). Figures are a year-1 estimate at your 24.0% rate — not tax advice; consult a CPA.
Schools (NCES district)
- District
- Detroit Public Schools Community District
- NCES district ID
- 2601103
- Math proficiency
- 10% ▼ -2.00%
- Reading proficiency
- 24% ▲ 6.00%
- Median HH income
- $25,815
- Composite
- 13.06/100
- National rank
- #9564
- State rank
- #499 of 540 in MI
Livability — Detroit
- Score
- 73/100
- State rank
- #218
- US rank
- #5427
Category grades
Schools grade is shown separately in the Schools card above.
Census & demographics
- Census place
- Detroit, MI
- County
- Wayne County · 1,562,939 people
- City population
- 572,865
- Metro
- Detroit-Warren-Dearborn, MI
- Population (ZIP)
- 32,760
- Household income
- $35,322
- Rent vs Own
- Severe rent burden
- 2372.0
Population outlook (Wayne County) Hauer SSP2
- Today (2025)
- 1,675,273 people
- By 2030
- 1,620,300 · -3.3%
- By 2040
- 1,502,341 · -10.3%
- By 2050
- 1,384,039 · -17.4%
- By 2075
- 1,124,592 · -32.9%
- By 2100
- 881,193 · -47.4%
Race, ethnicity, and origin ACS 2023
- Neighborhood character
- Predominantly Black (94%)
- Race & ethnicity
- Black 94% White 3% Two or more races 1%
- Common ancestry
- Romanian 1%
- Foreign-born
- 2% · Canada, Vietnam, Philippines
- Languages at home
- 97% English-only · French/Haitian/Cajun 1%
Political lean MEDSL · Wayne
- 2024 margin
- Strong D (+29.0) · D 62.7% · R 33.7% · Other 3.6%
- 2008→2024 swing
- -20.5pp toward R · 2008: 49.5pp · 2024: 29.0pp
- All cycles
- 2024: D+29.0 2020: D+38.1 2016: D+37.3 2012: D+46.9 2008: D+49.5
Not yet ingested
- Civics
- —
Market trends
- HPI YoY
- ▼ -44.65%
- Current HPI
- 328.8978
- Rent YoY
- ▲ 6.72%
- Metro
- Detroit-Warren-Dearborn, MI
- State GDP YoY
- ▲ 1.37%
- F500 in state
- 28
Industry mix (Fortune 500 HQ in MI)
| Industry | F500 HQs | Revenue |
|---|---|---|
| Automotive Parts | 3 | $48B |
|
||
| Automotive | 2 | $372B |
|
||
| Chemicals | 1 | $45B |
|
||
| Automotive Retail | 1 | $29B |
|
||
| Healthcare / Medical Devices | 1 | $23B |
|
||
| Automotive Technology | 1 | $20B |
|
||
Price history
+57.1% since first listed48 events — show timeline
- 2026-04-18 Listed $69,900 REALCOMP
- 2026-04-18 Listed $69,900 MiRealSource-MiMLS
- 2026-04-16 Coming Soon $69,900 MiRealSource-MiMLS
- 2025-12-09 Listing Removed — REALCOMP
- 2025-12-09 Listing Removed — MiRealSource-MiMLS
- 2025-09-26 Price Changed $84,900 MiRealSource-MiMLS
- 2025-09-25 Price Changed $84,900 REALCOMP
- 2025-09-04 Listed $99,900 REALCOMP
- 2025-09-04 Listed $99,900 MiRealSource-MiMLS
- 2024-09-02 Rental Removed $1,000 REALSOURCE
- 2024-08-01 Listed for Rent $1,000 REALSOURCE
- 2024-08-01 Rental Removed $1,000 REALCOMP
- 2024-08-01 Listed for Rent $1,000 REALCOMP
- 2024-07-24 Rental Removed $1,000 REALSOURCE
- 2024-07-22 Listed for Rent $1,000 REALSOURCE
- 2023-08-23 Listing Removed — MiRealSource-MiMLS
- 2023-08-23 Listing Removed — REALCOMP
- 2023-08-07 Listed $89,900 MiRealSource-MiMLS
- 2023-08-07 Listed $89,900 REALCOMP
- 2023-03-02 Sold (Public Records) $60,000 Public Records
- 2021-10-19 Sold (MLS) $60,000 MiRealSource-MiMLS
- 2021-10-19 Sold (MLS) $60,000 REALCOMP
- 2021-10-18 Pending — MiRealSource-MiMLS
- 2021-10-18 Pending — REALCOMP
- 2021-09-29 Relisted — MiRealSource-MiMLS
- 2021-09-29 Relisted — REALCOMP
- 2021-09-20 Pending — MiRealSource-MiMLS
- 2021-09-20 Pending — REALCOMP
- 2021-09-07 Price Changed $59,900 MiRealSource-MiMLS
- 2021-09-07 Price Changed $59,900 REALCOMP
- 2021-08-28 Listed $64,900 MiRealSource-MiMLS
- 2021-08-28 Listed $64,900 REALCOMP
- 2021-08-27 Coming Soon $64,900 MiRealSource-MiMLS
- 2021-08-27 Coming Soon $64,900 REALCOMP
- 2021-03-05 Sold (Public Records) $46,500 Public Records
- 2020-10-21 Sold (MLS) $46,000 MiRealSource-MiMLS
- 2020-10-21 Sold (MLS) $46,000 REALCOMP
- 2020-10-05 Pending — MiRealSource-MiMLS
- 2020-10-05 Pending — REALCOMP
- 2020-09-24 Contingent — MiRealSource-MiMLS
- 2020-09-24 Contingent — REALCOMP
- 2020-08-19 Listed $54,999 MiRealSource-MiMLS
- 2020-08-19 Listed $54,999 REALCOMP
- 2018-05-07 Sold (Public Records) $45,000 Public Records
- 2017-11-27 Listing Removed — REALCOMP
- 2017-11-27 Listing Removed — MiRealSource-MiMLS
- 2017-11-14 Listed $44,500 MiRealSource-MiMLS
- 2017-11-14 Listed $44,500 REALCOMP
Property tax history
+0.1%/yrLatest (2025): $1,969 · +1.2% YoY. Source: county tax records.
Cash-flow waterfall
monthlySold comps — $/sqft
last 12 mo · ≤1 miLoading sold comps…