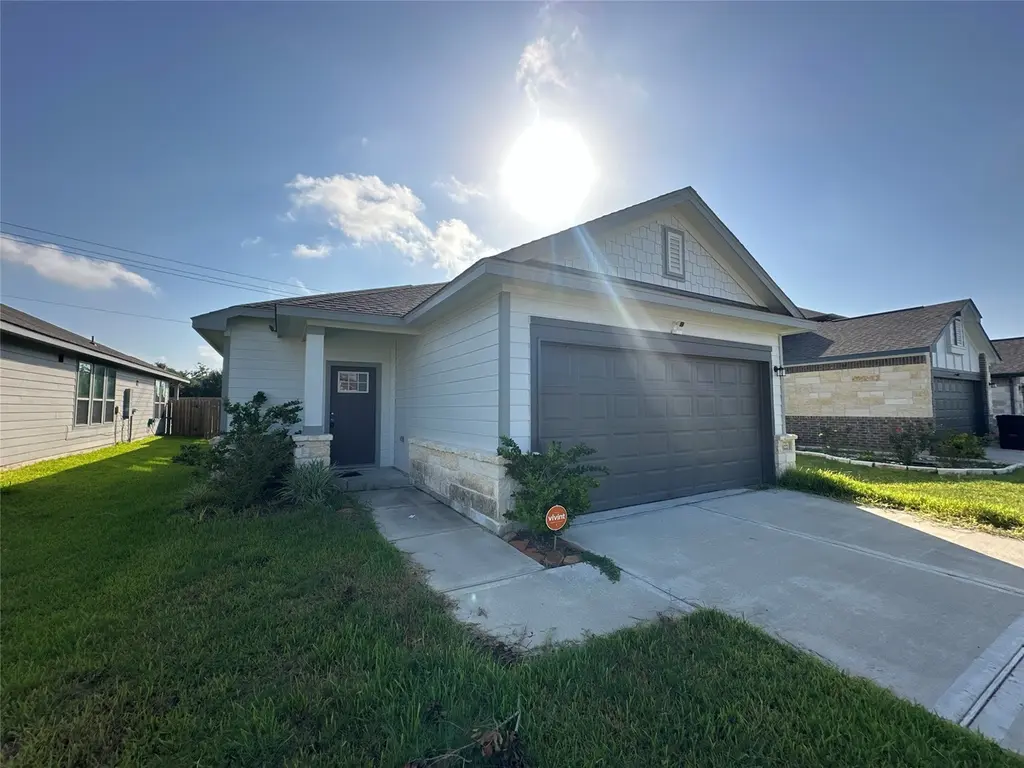
122 Tejas Village Pkwy · Beasley, TX
Flood risk 4/10 · Minor
- FEMA flood zone
- X (unshaded)
- Chance of flooding over 30 yrs
- 0.22%
- Est. flood insurance / yr
- $507 – $1,088
Fire risk 4/10 · Minor
- Est. fire insurance / yr
- $1,222 – $2,270
Heat risk 9/10 · Severe
- Hot days now (above 110°F)
- 7 days/yr
- Hot days in 30 yrs
- 22 days/yr
Wind risk 9/10 · Severe
- Chance of severe wind over 30 yrs
- 99.0%
Air-quality risk 2/10 · Minimal
- Unhealthy air days now
- 1 days/yr
- Unhealthy air days in 30 yrs
- 1 days/yr
Risk factors via First Street. Map © Google.
Why this score? — see what drove the C grade
The composite is a weighted blend of 9 inputs, each scored 0–100. Each bar is that input's sub-score; the figure is the points it added to the 100-point composite (weight × sub-score).
- Cash flow +15.6/30.0
- ARV discount +11.1/15.0
- Appreciation +7.1/10.0
- 1% rule +4.9/10.0
- DSCR +4.8/10.0
- Schools +4.6/10.0
- Condition / age +4.0/5.0
- Livability +2.9/5.0
- Rent growth +2.5/5.0
$245,000
🖨 Deal sheet 📄 Offer letter ✓ Due diligence
Listing remarks
Welcome to this beautifully built 2023 home in the desirable Tejas Village community. This modern 3-bedroom, 3-bathroom residence offers a thoughtfully designed layout with spacious living areas and stylish finishes throughout. The kitchen features contemporary cabinetry, sleek countertops, and like-new appliances, perfect for both everyday living and entertaining. Conveniently located near major roadways. This home is move-in ready and ideal for those seeking both comfort and convenience.
Key facts
- 5,248 sq ft lot
- 2 garage spots
- Built 2023
Property features AI
Finance
- Other: Special Addendum disclosure
- HOA & community: Tejas Village HOA/CMI Association with $350 annual fee
Exterior
- Parking: Attached 2-car garage
- Utilities: Public water; Public sewer
- Home design: Residential property; Built in 2023; Slab foundation
- Construction: Brick and wood siding construction; Composition roof
- Exterior features: Subdivision lot
Interior
- Bedrooms: Bedroom on second level (12 x 11); Bedroom on second level (12 x 1); Primary bedroom on first level (13 x 12)
- Bathrooms: 2 full bathrooms
- Heating & cooling: Central electric heating; Central electric cooling (central air)
- Interior features: 3 total rooms
Neighborhood map
What this means for you Summary
Snapshot
- This is a 3-bed/2.0-bath single-family listed at $245k. Condition is rated good.
Deal economics
- At list price, monthly cash flow is $102 ($1k/yr) — positive.
- The deal already cash-flows at list — no discount required.
- To meet the 1% rule (rent ≥ 1% of price), the offer needs to be $243k (0.8% below list).
- Recommended offer: $238k (3.0% below list) — sets the bar for market timing.
- Cap rate 6.8% vs local median 5.4% in Beasley — meaningfully above typical; check what's discounted (condition, days-on-market, listing class) to confirm the premium yield is real.
Location & tenants
- Location reads 57/100 on livability (#1,273 in TX) — a working-class tenant base; expect higher turnover. Strengths: cost of living A+, crime A; Watch: employment C-, schools D-, amenities F.
- Lamar CISD (suburban): math 50% / reading 53% proficiency, ranked #116 of 826 in TX (top 14%) — acceptable for families but not a draw, mixed tenant base, ~2y average lease.
- Market conditions: 232 active listings in the ZIP; 2 comparable units currently listed for rent nearby; 12,093 units permitted in Fort Bend County in 2024 (815 in 5+ unit buildings).
Forward outlook
- In year one you build about $12k of equity ($2k loan paydown + $10k appreciation (4.2% local appreciation)).
- Fort Bend County population projected at +75% by 2050 — long-run rental-demand tailwind backs the buy-and-hold thesis.
- At projected returns (4.2% appreciation + 3.0% rent growth), your $69k cash investment doubles in ~5 years — after that, you're playing with house money.
- By year 4, paydown + projected appreciation supports a ~$40k cash-out refi (75% LTV) — recoverable capital for the next deal without selling this one.
Negotiation context
- It's been on market 50 days — a 3% lower offer ($238k) is reasonable based on typical stale-listing flexibility.
- 3 sale attempts with the ask held roughly flat each time — persistent listings suggest the price (not the market) is what's stuck; bring a comps-based counter.
Risks & watch-outs
- Climate carrying-cost: severe wind risk, 99% chance of damaging wind over 30y; extreme-heat days projected 7→22/yr by 2055 (HVAC capex compounding) — expect insurance premiums to compound above CPI over the hold.
Questions for the listing agent
- It's been on market 50 days. Have you received any prior offers? Is the seller open to a 3% concession, seller financing, or rate buy-down credit?
- What does the HOA fee cover, when was the last increase, and are there any pending special assessments or reserve-fund shortfalls?
- Is there a deadline driving the sale (1031 exchange, divorce, estate, relocation)? That informs how much negotiation room exists.
- Schools are D-rated, which usually means shorter tenancies and higher turnover. Who's the typical renter profile here, and what's been the actual vacancy rate?
- What's the average days-on-market for RENTAL listings here right now (not sales)? A rising rental-DOM trend means longer vacancies and softer asking-rent achievability than the comps imply.
- What's the recent tenant-quality profile in this submarket — average credit score on applications, eviction rate, late-payment / NSF rate, and stable-employment percentage? A property-management company in the area should have these aggregated.
- How much new for-sale + rental construction is in the pipeline within 1–3 miles? Heavy new supply typically softens prices + rents 12–24 months out; constrained supply supports both.
Investment metrics
- 1% rule
- 0.99% ✗
- Cap rate
- 6.79%
- Cash-on-cash
- 1.78%
- DSCR
- 1.08
- GRM
- 8.4
CMA / ARV
- ARV (median comp)
- $266,235
- List price
- $245,000
- Delta
- -7.98%
- Verdict
- FAIR
- Comps
- 20 within 1.0 mi
Show comp detail 12 sales within ~0.75 mi
| Address | Dist | Beds/Ba | Sqft | Sold | Price | $/sf | Match |
|---|---|---|---|---|---|---|---|
| 214 N 8th St | 0.14mi | 3/1.5 | 1,404 (-1%) | 7mo | $110,000 | $78 | 85 |
| 8014 Alamo Ct | 0.27mi | 3/2.0 | 1,364 (-4%) | 9mo | $272,987 | $200 | 74 |
| 215 N 8th St N | 0.10mi | 3/2.0 | 1,467 (+4%) | 19mo | $295,000 | $201 | 73 |
| 319 N 9th St | 0.12mi | 3/1.0 | 1,301 (-8%) | 9mo | $124,900 | $96 | 69 |
| 403 N 5th St | 0.31mi | 3/2.0 | 1,368 (-3%) | 13mo | $294,999 | $216 | 69 |
| 8015 Jim Bowie Ct | 0.18mi | 4/2.0 (+1) | 1,535 (+8%) | 6mo | $288,103 | $188 | 68 |
| 7615 Avenue J | 0.41mi | 2/1.0 (-1) | 1,386 (-2%) | 3mo | $275,000 | $198 | 65 |
| 810 Tejas Village Pkwy | 0.40mi | 3/2.0 | 1,364 (-4%) | 12mo | $275,612 | $202 | 65 |
| 8015 Alamo Ct | 0.25mi | 4/2.0 (+1) | 1,535 (+8%) | 10mo | $278,843 | $182 | 61 |
| 231 N 5th St | 0.28mi | 3/2.0 | 1,226 (-13%) | 19mo | $209,000 | $170 | 49 |
| 210 S 2nd St | 0.50mi | 3/1.0 | 1,500 (+6%) | 18mo | $180,000 | $120 | 47 |
| 7025 Loop 540 | 0.61mi | 4/2.0 (+1) | 1,517 (+7%) | 16mo | $220,000 | $145 | 42 |
Match score weights: distance 35% · size 25% · config 20% · recency 20%. Top-matched comps best support the ARV.
Projected returns pro-forma
4.15% appreciation · 3.0% rent growth · sell at horizon
- IRR
- 12.3%
- Equity multiple
- 1.75×
- Total profit
- $51,388
- Equity at exit
- $126,419
- IRR
- 13.7%
- Equity multiple
- 3.28×
- Total profit
- $156,097
- Equity at exit
- $208,545
Cash invested: $68,600 (down + closing). Projections, not guarantees.
Landlord ↔ Tenant lean methodology
- Overall (STATE)
- 87 Strongly Landlord-Friendly
- State Texas
- 87 Strongly Landlord-Friendly · R+5
- County
- — inherits STATE
- City
- — inherits STATE
ZIP-level market 77417
- Home prices YoY
- 1.2%
- Active inventory
- 232
- Price-to-rent
- 8.4×
Monthly cashflow live
- Estimated rent
- $2,432 medium interval (Pro) →
- Mortgage (P&I)
- −$1,285
- Tax from tax record
- −$403 /mo · $4,840/yr
- Insurance
- −$102
- HOA
- −$29
- Vacancy / Maint / Mgmt
- −$511
- Net cashflow
- $102
Break-even live
UW: 25.0% down · 7.5% · 30yr · 1.5% tax · 5.0% vac · 8.0% maint · 8.0% mgmt
Financing live
Cash to close
- Down payment
- $61,250
- Closing costs
- $7,350
- Reserves months
- —
- Total cash needed
- —
Loan-product check · same deal, 3 products live
Conventional
25% down · 7.5% · 30yr
- Down + closing
- —
- Monthly P&I
- —
- Monthly cashflow
- —
- DSCR
- —
- Eligible?
- —
Personal DTI + credit; lowest rate.
DSCR
20% down · 8.5% · 30yr
- Down + closing
- —
- Monthly P&I
- —
- Monthly cashflow
- —
- DSCR
- —
- Eligible?
- —
No personal income docs; deal must DSCR.
Hard money
10% down · 12.0% · 12mo
- Down + closing
- —
- Monthly P&I
- —
- Monthly cashflow
- —
- DSCR
- —
- Eligible?
- —
Short-term bridge; refi at stabilization.
Rent comps 2 comps
| Address | Beds | Baths | Sqft | Rent | $/sqft | DOM | Units | Dist |
|---|---|---|---|---|---|---|---|---|
| 119 S 8th St Beasley, TX | 3.0 | 2.0 | 1680 | $1,680 | $1.00 | 24d | 1 | 0.22mi |
| 402 N 4th St Beasley, TX | 3.0 | 2.5 | 1700 | $3,750 | $2.21 | 1d | 1 | 0.38mi |
HOA detail
- Monthly dues
- $29 · $348/yr
Listing history 21 events
-
2026-06-18days on market $245,000 Active 50 DOM
-
2026-06-17days on market $245,000 Active 49 DOM
-
2026-06-16days on market $245,000 Active 48 DOM
-
2026-06-15days on market $245,000 Active 47 DOM
-
2026-06-13days on market $245,000 Active 45 DOM
-
2026-06-10days on market $245,000 Active 41 DOM
-
2026-06-08days on market $245,000 Active 40 DOM
-
2026-06-07days on market $245,000 Active 39 DOM
-
2026-06-04days on market $245,000 Active 36 DOM
-
2026-06-03days on market $245,000 Active 35 DOM
-
2026-06-02days on market $245,000 Active 34 DOM
-
2026-06-01days on market $245,000 Active 33 DOM
-
2026-05-31days on market $245,000 Active 32 DOM
-
2026-04-29$245,000 Active 495-char remark
-
2026-03-03historical
-
2026-02-05price $245,900
-
2025-12-05$249,900 Active
-
2025-07-14status Pending
-
2025-07-03historical
-
2025-06-24price $250,000
-
2025-05-13$270,000 Active
ⓘ Source: listings_history table (triggers on properties + properties_extension) + one-shot
backfill from property_details.listing_events for pre-trigger history.
Tax reassessment forecast TX · Resets to sale price
- Current annual tax
- $4,840 · $403/mo
- Projected year-2 tax
- $4,840 · $403/mo
- Expected delta
- $0/yr ($0/mo · 0.0%)
ⓘ Screening estimate from a state-policy table — verify with the county assessor before closing.
Climate risk First Street
- Flood 4/10 Moderate FEMA zone X (unshaded) · 22% chance over 30 yrs
- Wildfire 4/10 Moderate
- Heat 9/10 Extreme 7 d/yr ≥110°F today · 22 d/yr by 30 yrs out
- Wind 9/10 Extreme 99% chance of damaging wind over 30 yrs
- Air quality 2/10 Low 1 unhealthy d/yr today · 1 by 30 yrs out
Nearby sold comps map
Loading sold comps map…
Walkable amenities ~0.75 mi
Loading nearby amenities…
Taxation est. · year 1
- Rental income
- $29,179
- − Mortgage interest
- −$13,724
- − Property taxes
- −$4,840
- − Insurance
- −$1,225
- − Repairs & maintenance
- −$2,334
- − Management
- −$2,334
- − HOA
- −$348
- − Depreciation
- −$7,127
- Taxable loss
- −$2,754
- Est. tax savings @ 24.0%
- +$661
- After-tax cash flow
- $1,882/yr
For passive investors: Depreciation is non-cash, so a rental often shows a tax loss while cash-flowing — sheltering income. Rental losses are passive: they offset passive income freely, and up to $25,000/yr can offset ordinary (W-2) income if you actively participate and your MAGI is under $100k (phasing out to $0 by $150k); unused losses carry forward. On sale, claimed depreciation is recaptured at up to 25%, and gains may owe capital-gains tax (a 1031 exchange can defer both). Figures are a year-1 estimate at your 24.0% rate — not tax advice; consult a CPA.
Condition & rehab AI · 13 photos
This 2023-built home in Tejas Village is move-in ready with modern finishes and a good condition score. It offers a good investment opportunity with potential for minor updates to enhance its curb appeal and value.
Value-add opportunities
- Both Painting the exterior and interior walls — Fresh paint can enhance curb appeal and interior aesthetics.
- Both Landscaping improvements — A well-maintained yard can increase both resale and rental value.
- Both Adding smart home features — Smart home features can increase both resale and rental value by making the home more modern and convenient.
Renovation cost estimate screening
Value-add ROI direction
- Both Painting the exterior and interior walls — Fresh paint can enhance curb appeal and interior aesthetics. ↑
- Both Landscaping improvements — A well-maintained yard can increase both resale and rental value. ↑
- Both Adding smart home features — Smart home features can increase both resale and rental value by making the home more modern and convenient. ↑
ⓘ Cost ranges are severity-bucket heuristics (US national rule-of-thumb). Get contractor quotes + a written scope before underwriting a rehab budget.
Schools (NCES district)
- District
- Lamar CISD
- NCES district ID
- 4826580
- Math proficiency
- 50% ▼ -12.00%
- Reading proficiency
- 53% ▼ -4.00%
- Median HH income
- $75,213
- Composite
- 46.43/100
- National rank
- #2452
- State rank
- #116 of 826 in TX
Livability — Beasley
- Score
- 57/100
- State rank
- #1273
- US rank
- #22130
Category grades
Schools grade is shown separately in the Schools card above.
Census & demographics
- Census place
- Beasley, TX
- Population (ZIP)
- 3,232
Population outlook (Fort Bend County) Hauer SSP2
- Today (2025)
- 1,004,526 people
- By 2030
- 1,153,104 · +14.8%
- By 2040
- 1,453,718 · +44.7%
- By 2050
- 1,753,781 · +74.6%
- By 2075
- 2,455,772 · +144.5%
- By 2100
- 2,930,528 · +191.7%
Race, ethnicity, and origin ACS 2023
- Neighborhood character
- Predominantly Hispanic (67%)
- Race & ethnicity
- Hispanic / Latino 67% Two or more races 49% White 22% Black 8%
- Hispanic origin (detail)
- Mexican 54%
- Common ancestry
- Italian 2% Romanian 1%
- Foreign-born
- 3% · Canada
- Languages at home
- 76% English-only · Spanish 24%
Political lean MEDSL · Fort Bend
- 2024 margin
- Toss-up / Even · D 49.5% · R 47.9% · Other 2.6%
- 2008→2024 swing
- +4.0pp toward D · 2008: -2.4pp · 2024: 1.6pp
- All cycles
- 2024: D+1.6 2020: D+10.6 2016: D+6.6 2012: R+6.8 2008: R+2.4
Not yet ingested
- Civics
- —
Market trends
- HPI YoY
- ▲ 4.15%
- Current HPI
- 337.8236
- Rent YoY
- —
- Metro
- —
- State GDP YoY
- ▲ 3.95%
- F500 in state
- 110
Industry mix (Fortune 500 HQ in TX)
| Industry | F500 HQs | Revenue |
|---|---|---|
| Energy | 16 | $1,198B |
|
||
| Technology | 5 | $198B |
|
||
| Engineering / Construction | 4 | $72B |
|
||
| Energy Services | 3 | $60B |
|
||
| Utilities | 3 | $41B |
|
||
| Healthcare | 2 | $330B |
|
||
Price history
-9.3% since first listed8 events — show timeline
- 2026-04-29 Listed $245,000 HARMLS
- 2026-03-03 Listing Removed — HARMLS
- 2026-02-05 Price Changed $245,900 HARMLS
- 2025-12-05 Listed $249,900 HARMLS
- 2025-07-14 Pending — HARMLS
- 2025-07-03 Listing Removed — HARMLS
- 2025-06-24 Price Changed $250,000 HARMLS
- 2025-05-13 Listed $270,000 HARMLS
Property tax history
+125.7%/yrLatest (2025): $4,840 · -13.1% YoY. Source: county tax records.
Cash-flow waterfall
monthlySold comps — $/sqft
last 12 mo · ≤1 miLoading sold comps…