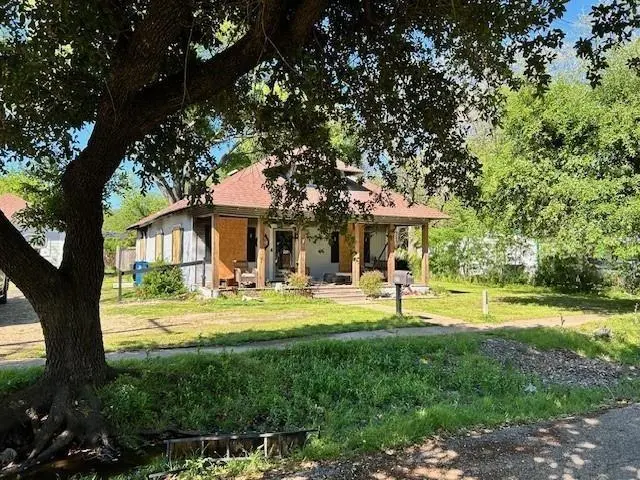
207 E Elmo St · Kaufman, TX
Flood risk 1/10 · Minimal
- FEMA flood zone
- X (unshaded)
- Chance of flooding over 30 yrs
- 0.0%
- Est. flood insurance / yr
- $507 – $1,088
Fire risk 6/10 · Moderate
- Est. fire insurance / yr
- $1,222 – $2,270
Heat risk 7/10 · Major
- Hot days now (above 110°F)
- 7 days/yr
- Hot days in 30 yrs
- 24 days/yr
Wind risk 6/10 · Moderate
- Chance of severe wind over 30 yrs
- 27.0%
Air-quality risk 2/10 · Minimal
- Unhealthy air days now
- 1 days/yr
- Unhealthy air days in 30 yrs
- 1 days/yr
Risk factors via First Street. Map © Google.
Why this score? — see what drove the B- grade
The composite is a weighted blend of 9 inputs, each scored 0–100. Each bar is that input's sub-score; the figure is the points it added to the 100-point composite (weight × sub-score).
- Cash flow +30.0/30.0
- 1% rule +10.0/10.0
- DSCR +10.0/10.0
- ARV discount +7.5/15.0
- Livability +3.4/5.0
- Schools +3.3/10.0
- Rent growth +2.5/5.0
- Condition / age +2.5/5.0
- Appreciation +0.0/10.0
$90,000
🖨 Deal sheet 📄 Offer letter ✓ Due diligence
Listing remarks MLS
Investor or developer special!! Home has severe fire damage, value is in the lot! Mature trees, convenient location to downtown Kaufman! Home has a beautiful .41 acre lot with mature trees. Home has a detached garage that needs to be cleaned out but could otherwise stay! Demo the old home and build new! Property is being sold AS-IS.
Key facts
- Convenient location
- Detached garage
- 0.41 acre lot
Tags
Property features AI
Finance
- Other: County: Kaufman; Country: United States; Geocode confidence: High
- Financial info: Listing terms: Cash; Treat as clear loan type; No second mortgage indicated
- HOA & community: No homeowners association
Exterior
- Parking: Covered parking for 2 vehicles; 2-car single door carport/covered parking; 2-car garage (approx. 20' x 20')
- Utilities: City water; City sewer; Cable available; No municipal utility district
- Home design: Single family residence; One story; Residential property, not attached
- Construction: Built in 1920
- Exterior features: Lot less than 0.5 acre (approximately 0.41 acre); Subdivision: Kaufman Rev; Use GPS for directions
Interior
- Kitchen: No appliances listed
- Bedrooms: 4 bedrooms (primary bedroom on main level)
- Bathrooms: 2 full bathrooms
- Interior features: Cable TV available; One living area; One dining area; Two total rooms (per listing)
- Laundry & utility: No laundry/utility appliances listed
Neighborhood map
What this means for you Summary
Snapshot
- This is a 4-bed/2.0-bath single-family listed at $90k.
Deal economics
- At list price, monthly cash flow is $457 ($5k/yr) — positive.
- The deal already cash-flows at list — no discount required.
- Meets the 1% rule at list price ($2k rent vs $90k).
- Cap rate 12.4% vs local median 4.1% in Kaufman — top-decile yield for the area; either an underpriced asset or a hidden risk that comps aren't pricing in. Stress-test before assuming the spread holds.
Location & tenants
- Location reads 68/100 on livability (#478 in TX) — a middle-class / working-renter tenant base. Strengths: cost of living A+, housing A+, crime A-; Watch: amenities F, commute F, employment D-.
- Kaufman ISD (town): math 38% / reading 39% proficiency, ranked #437 of 826 in TX (top 53%) — families likely to look elsewhere, expect single-tenant / working-renter base with shorter leases.
- Zoned schools: J W Monday El (math 37% / reading 42%, grade F, #1,545 of 4,322 statewide, top 38%, 469 students, 69% FRL).
- Market conditions: 274 active listings in the ZIP; 3 comparable units currently listed for rent nearby; rentals lingering (median 44d on market — plan ~5-8 weeks vacancy on turnover, expect pricing pressure); 100% of comp listings sitting > 30 days — soft ceiling on asking rent; 1,747 units permitted in Kaufman County in 2024 (180 in 5+ unit buildings).
Forward outlook
- Local home prices are declining (-3.0%/yr); year-one equity from $622 of loan paydown is wiped out by about $3k of value loss. Plan a longer hold.
- Kaufman County population projected at +43% by 2050 — long-run rental-demand tailwind backs the buy-and-hold thesis.
- At projected returns (-3.0% appreciation + 3.0% rent growth), your $25k cash investment doubles in ~6 years — after that, you're playing with house money.
Negotiation context
- Only 1 days on market — expect competitive offers; lowballing is unlikely to land.
- 3 sale attempts since 7y ago with the ask held roughly flat each time — persistent listings suggest the price (not the market) is what's stuck; bring a comps-based counter.
Risks & watch-outs
- Watch-outs: property tax is 3.5% of price; built in 1920 — expect roof / HVAC / electrical / plumbing capex.
- Climate carrying-cost: major wind risk, 27% chance of damaging wind over 30y; major wildfire risk; extreme-heat days projected 7→24/yr by 2055 (HVAC capex compounding) — expect insurance premiums to compound above CPI over the hold.
Questions for the listing agent
- Built in 1920 — when were the roof, HVAC, electrical panel, plumbing, and water heater last replaced?
- Property tax is high relative to price — has the assessment been appealed recently, and will the sale trigger a re-assessment?
- Is there a deadline driving the sale (1031 exchange, divorce, estate, relocation)? That informs how much negotiation room exists.
- Schools are D-rated, which usually means shorter tenancies and higher turnover. Who's the typical renter profile here, and what's been the actual vacancy rate?
- What's the average days-on-market for RENTAL listings here right now (not sales)? A rising rental-DOM trend means longer vacancies and softer asking-rent achievability than the comps imply.
- What's the recent tenant-quality profile in this submarket — average credit score on applications, eviction rate, late-payment / NSF rate, and stable-employment percentage? A property-management company in the area should have these aggregated.
- How much new for-sale + rental construction is in the pipeline within 1–3 miles? Heavy new supply typically softens prices + rents 12–24 months out; constrained supply supports both.
Investment metrics
- 1% rule
- 1.73% ✓
- Cap rate
- 12.38%
- Cash-on-cash
- 21.75%
- DSCR
- 1.97
- GRM
- 4.8
CMA / ARV
- ARV (on-the-fly)
- $272,320
- Comps found
- 12
Show comp detail 12 sales within ~0.75 mi
| Address | Dist | Beds/Ba | Sqft | Sold | Price | $/sf | Match |
|---|---|---|---|---|---|---|---|
| 805 N Dallas St | 0.08mi | 4/2.5 | 1,553 (+6%) | 11mo | $375,000 | $241 | 76 |
| 600 Pridmore St | 0.63mi | 3/2.0 (-1) | 1,450 (-2%) | 3mo | $225,000 | $155 | 61 |
| 704 N Wilson St | 0.12mi | 3/2.0 (-1) | 1,308 (-11%) | 13mo | $250,000 | $191 | 60 |
| 203 E Hickory St | 0.15mi | 3/2.0 (-1) | 1,280 (-13%) | 8mo | $150,000 | $117 | 60 |
| 106 W 2nd North St | 0.14mi | 3/1.0 (-1) | 1,255 (-15%) | 3mo | $179,900 | $143 | 58 |
| 1307 E First North St | 0.52mi | 3/2.0 (-1) | 1,517 (+3%) | 10mo | $309,900 | $204 | 57 |
| 202 S Nash St | 0.39mi | 3/2.0 (-1) | 1,624 (+10%) | 9mo | $300,000 | $185 | 52 |
| 1505 E 1st North St | 0.60mi | 3/2.0 (-1) | 1,379 (-6%) | 8mo | $195,000 | $141 | 50 |
| 1408 E 1st North | 0.57mi | 4/2.5 | 1,655 (+12%) | 2mo | $330,000 | $199 | 49 |
| 605 S Wilson St | 0.56mi | 4/1.0 | 1,325 (-10%) | 5mo | $175,000 | $132 | 49 |
| 203 S Wilson St | 0.38mi | 3/2.0 (-1) | 1,624 (+10%) | 13mo | $300,000 | $185 | 49 |
| 101 N Shannon St | 0.52mi | 3/2.0 (-1) | 1,291 (-12%) | 3mo | $179,900 | $139 | 47 |
Match score weights: distance 35% · size 25% · config 20% · recency 20%. Top-matched comps best support the ARV.
Projected returns pro-forma
-3.0% appreciation · 3.0% rent growth · sell at horizon
- IRR
- 14.5%
- Equity multiple
- 1.58×
- Total profit
- $14,624
- Equity at exit
- $13,419
- IRR
- 23.3%
- Equity multiple
- 3.01×
- Total profit
- $50,665
- Equity at exit
- $7,782
Cash invested: $25,200 (down + closing). Projections, not guarantees.
Landlord ↔ Tenant lean methodology
- Overall (STATE)
- 87 Strongly Landlord-Friendly
- State Texas
- 87 Strongly Landlord-Friendly · R+5
- County
- — inherits STATE
- City
- — inherits STATE
ZIP-level market 75142
- Home prices YoY
- -19.8%
- Active inventory
- 274
- Price-to-rent
- 4.8×
Monthly cashflow live
- Estimated rent
- $1,555 medium interval (Pro) →
- Mortgage (P&I)
- −$472
- Tax from tax record
- −$262 /mo · $3,145/yr
- Insurance
- −$38
- HOA
- −$0
- Vacancy / Maint / Mgmt
- −$327
- Net cashflow
- $457
Break-even live
UW: 25.0% down · 7.5% · 30yr · 1.5% tax · 5.0% vac · 8.0% maint · 8.0% mgmt
Financing live
Cash to close
- Down payment
- $22,500
- Closing costs
- $2,700
- Reserves months
- —
- Total cash needed
- —
Loan-product check · same deal, 3 products live
Conventional
25% down · 7.5% · 30yr
- Down + closing
- —
- Monthly P&I
- —
- Monthly cashflow
- —
- DSCR
- —
- Eligible?
- —
Personal DTI + credit; lowest rate.
DSCR
20% down · 8.5% · 30yr
- Down + closing
- —
- Monthly P&I
- —
- Monthly cashflow
- —
- DSCR
- —
- Eligible?
- —
No personal income docs; deal must DSCR.
Hard money
10% down · 12.0% · 12mo
- Down + closing
- —
- Monthly P&I
- —
- Monthly cashflow
- —
- DSCR
- —
- Eligible?
- —
Short-term bridge; refi at stabilization.
Rent comps 3 comps
| Address | Beds | Baths | Sqft | Rent | $/sqft | DOM | Units | Dist |
|---|---|---|---|---|---|---|---|---|
| 304 E Hickory St Unit A Kaufman, TX | 3.0 | 2.0 | 1045 | $1,550 | $1.48 | 43d | 1 | 0.14mi |
| 107 Love St Kaufman, TX | 3.0 | 2.0 | 1116 | $1,500 | $1.34 | 43d | 1 | 0.60mi |
| 201 Melody Cir Kaufman, TX | 3.0 | 1.5 | 1288 | $1,700 | $1.32 | 44d | 1 | 1.37mi |
Listing history 2 events
-
2026-06-18remarks 335-char remark
-
2026-06-18$90,000 Active 1 DOM
ⓘ Source: listings_history table (triggers on properties + properties_extension) + one-shot
backfill from property_details.listing_events for pre-trigger history.
Tax reassessment forecast TX · Resets to sale price
- Current annual tax
- $3,145 · $262/mo
- Projected year-2 tax
- $3,145 · $262/mo
- Expected delta
- $0/yr ($0/mo · 0.0%)
ⓘ Screening estimate from a state-policy table — verify with the county assessor before closing.
Climate risk First Street
- Flood 1/10 Low FEMA zone X (unshaded) · 0% chance over 30 yrs
- Wildfire 6/10 Major
- Heat 7/10 Severe 7 d/yr ≥110°F today · 24 d/yr by 30 yrs out
- Wind 6/10 Major 27% chance of damaging wind over 30 yrs
- Air quality 2/10 Low 1 unhealthy d/yr today · 1 by 30 yrs out
Nearby sold comps map
Loading sold comps map…
Walkable amenities ~0.75 mi
Loading nearby amenities…
Taxation est. · year 1
- Rental income
- $18,658
- − Mortgage interest
- −$5,041
- − Property taxes
- −$3,145
- − Insurance
- −$450
- − Repairs & maintenance
- −$1,493
- − Management
- −$1,493
- − Depreciation
- −$2,618
- Taxable income
- $4,418
- Est. tax owed @ 24.0%
- −$1,060
- After-tax cash flow
- $4,421/yr
For passive investors: Depreciation is non-cash, so a rental often shows a tax loss while cash-flowing — sheltering income. Rental losses are passive: they offset passive income freely, and up to $25,000/yr can offset ordinary (W-2) income if you actively participate and your MAGI is under $100k (phasing out to $0 by $150k); unused losses carry forward. On sale, claimed depreciation is recaptured at up to 25%, and gains may owe capital-gains tax (a 1031 exchange can defer both). Figures are a year-1 estimate at your 24.0% rate — not tax advice; consult a CPA.
Schools (NCES district)
- District
- Kaufman ISD
- NCES district ID
- 4825200
- Math proficiency
- 38% ▼ -11.00%
- Reading proficiency
- 39% ▬ 0.00%
- Median HH income
- $51,081
- Composite
- 33.36/100
- National rank
- #5485
- State rank
- #437 of 826 in TX
Livability — Kaufman
- Score
- 68/100
- State rank
- #478
- US rank
- #9602
Category grades
Schools grade is shown separately in the Schools card above.
Census & demographics
- Census place
- Kaufman, TX
- Population (ZIP)
- 23,301
Population outlook (Kaufman County) Hauer SSP2
- Today (2025)
- 138,716 people
- By 2030
- 150,815 · +8.7%
- By 2040
- 174,877 · +26.1%
- By 2050
- 198,020 · +42.8%
- By 2075
- 251,908 · +81.6%
- By 2100
- 285,325 · +105.7%
Race, ethnicity, and origin ACS 2023
- Neighborhood character
- Diverse neighborhood (Simpson 0.57)
- Race & ethnicity
- White 53% Hispanic / Latino 39% Two or more races 23% Black 4%
- Hispanic origin (detail)
- Mexican 36%
- Common ancestry
- Italian 1% Slovak 1% Serbian 1%
- Foreign-born
- 10% · Canada
- Languages at home
- 69% English-only · Spanish 30%
Political lean MEDSL · Kaufman
- 2024 margin
- Strong R (+27.9) · D 35.6% · R 63.5%
- 2008→2024 swing
- +7.9pp toward D · 2008: -35.8pp · 2024: -27.9pp
- All cycles
- 2024: R+27.9 2020: R+33.9 2016: R+47.0 2012: R+44.4 2008: R+35.8
Not yet ingested
- Civics
- —
Market trends
- HPI YoY
- ▼ -64.48%
- Current HPI
- 261.3091
- Rent YoY
- —
- Metro
- —
- State GDP YoY
- ▲ 3.95%
- F500 in state
- 110
Industry mix (Fortune 500 HQ in TX)
| Industry | F500 HQs | Revenue |
|---|---|---|
| Energy | 16 | $1,198B |
|
||
| Technology | 5 | $198B |
|
||
| Engineering / Construction | 4 | $72B |
|
||
| Energy Services | 3 | $60B |
|
||
| Utilities | 3 | $41B |
|
||
| Healthcare | 2 | $330B |
|
||
Price history
-58.1% since first listed12 events — show timeline
- 2026-06-18 Listed $90,000 NTREIS
- 2024-04-23 Sold (Public Records) — Public Records
- 2024-04-22 Sold (MLS) — NTREIS
- 2024-04-13 Pending — NTREIS
- 2024-04-10 Listed $60,000 NTREIS
- 2024-04-05 Sold (Public Records) — Public Records
- 2020-04-15 Sold (MLS) — NTREIS
- 2020-03-29 Pending — NTREIS
- 2020-03-18 Contingent — NTREIS
- 2020-02-24 Price Changed $199,000 NTREIS
- 2019-11-22 Price Changed $209,900 NTREIS
- 2019-10-24 Listed $214,900 NTREIS
Property tax history
+1.7%/yrLatest (2025): $3,145 · +0.1% YoY. Source: county tax records.
Cash-flow waterfall
monthlySold comps — $/sqft
last 12 mo · ≤1 miLoading sold comps…