706 E Maywood Ave · Peoria, IL
Flood risk 1/10 · Minimal
- FEMA flood zone
- X
- Chance of flooding over 30 yrs
- 0.0%
- Est. flood insurance / yr
- $473 – $860
Fire risk 1/10 · Minimal
- Est. fire insurance / yr
- $804 – $1,492
Heat risk 3/10 · Minor
- Hot days now (above 105°F)
- 7 days/yr
- Hot days in 30 yrs
- 18 days/yr
Wind risk 2/10 · Minimal
- Chance of severe wind over 30 yrs
- 1.0%
Air-quality risk 3/10 · Minor
- Unhealthy air days now
- 1 days/yr
- Unhealthy air days in 30 yrs
- 3 days/yr
Risk factors via First Street. Map © Google.
Why this score? — see what drove the F grade
The composite is a weighted blend of 9 inputs, each scored 0–100. Each bar is that input's sub-score; the figure is the points it added to the 100-point composite (weight × sub-score).
- Cash flow +14.8/30.0
- DSCR +4.5/10.0
- Livability +3.7/5.0
- 1% rule +3.4/10.0
- Rent growth +3.4/5.0
- Condition / age +2.5/5.0
- Schools +1.1/10.0
- ARV discount +0.0/15.0
- Appreciation +0.0/10.0
$124,900
🖨 Deal sheet (PDF) 📄 Offer letter ✓ Due diligence
Listing remarks MLS
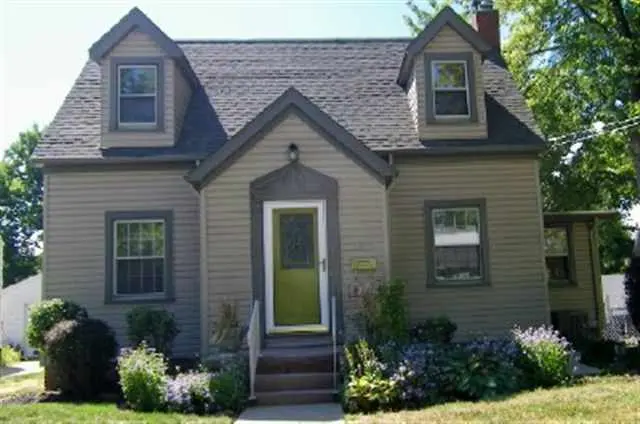
Charm meets chic in this beautifully decorated and updated home! Living room has glass door to a den with built-in bookcases and a window seat. Formal dining room has a built-in corner cabinet. Kitchen is updated with tile floor and granite countertops! Wonderful master bedroom and second bedroom have dormers. Remodeled main floor and upper level bathrooms. Main floor bedroom could be family room or den. Updates include furnace/air 2009, roof 2008, vinyl siding and some windows 1998. Fabulous, deep back yard with many perennials and new terrace wall. Covered patio overlooking back yard.
Key facts
- 7,453 sq ft lot
- 2 garage spots
- Built 1940
Property features AI
Finance
- Other: Building area reported as 1,745 (building area total) and living area reported as 2,017
Exterior
- Parking: Detached 2-car garage
- Utilities: Public water; Public sewer
- Home design: Single-family residence; Shingle roof; Not new construction; Built in 1940
- Construction: Shingle roof; Built in 1940
- Exterior features: Fenced yard; Replacement windows; Level lot; Paved road access
Interior
- Kitchen: Dishwasher; Microwave; Refrigerator; Tile flooring in the kitchen
- Bedrooms: Three bedrooms total; Primary bedroom on the main level (14 x 8.6 ft) with egress window; Second bedroom on the upper level (14 x 13 ft) with egress window and hardwood flooring; Third bedroom on the upper level (11.2 x 10.1 ft) with egress window and hardwood flooring
- Flooring: Hardwood in multiple rooms (including upper-level bedrooms and dining room); Carpet in some main-level rooms; Tile in the kitchen
- Bathrooms: Two full bathrooms; One half bathroom
- Heating & cooling: Central air conditioning; Forced air heating; Gas water heater
- Interior features: Cable available; Ceiling fan(s); Wood-burning fireplace in the living room; Full, partially finished basement
- Laundry & utility: Washer and dryer located in the basement laundry area
Neighborhood map
What this means for you Summary
Snapshot
- This is a 3-bed/2.5-bath single-family listed at $125k.
Deal economics
- At list price, monthly cash flow is $35 ($424/yr) — positive.
- The deal already cash-flows at list — no discount required.
- To meet the 1% rule (rent ≥ 1% of price), the offer needs to be $105k (16.2% below list).
- Recommended offer: $105k (16.2% below list) — sets the bar for 1% rule.
Location & tenants
- Location reads 73/100 on livability (#270 in IL) — a middle-class / working-renter tenant base. Strengths: commute A+, cost of living A+, housing A+; Watch: employment D+, crime F.
- Peoria SD 150 (urban): math 11% / reading 14% proficiency, ranked #554 of 620 in IL (top 89%) — low school quality limits family demand, transient renter base, plan for 1-2y turnover; 70% free/reduced lunch — lower-income household profile, screen leases tightly.
- Zoned schools: Valeska Hinton Early Ch Ed Ctr (495 students, 0% FRL); Reservoir Gifted School (math 79% / reading 82%, grade A+, #2 of 665 statewide, top 0%, 277 students, 0% FRL); Peoria High School (math 4% / reading 7%, grade F, #609 of 693 statewide, top 88%, 1,447 students, 0% FRL) — zoned schools average 0% FRL vs 70% district-wide (70 pts lower); this property's tenant base skews higher-income than the district average.
- Zoned-school proficiency averages 43% at this address vs 12% district-wide (+30 pts) — the actual schools serving this property are materially stronger than the Peoria SD 150 average implies; a family-tenant draw the district grade alone would hide.
- Market conditions: Rents rising (+3.5%/yr); 104 active listings in the ZIP; 17 comparable units currently listed for rent nearby; rentals at typical pace (median 16d on market — plan ~3-4 weeks tenant-placement turnaround); lower-income renter base — watch delinquency; 73 units permitted in Peoria County in 2024 (0 in 5+ unit buildings).
- This rent runs 30% of the median local income ($42k/yr) — at the standard rent-burdened threshold; future hikes will face affordability resistance.
Forward outlook
- Local home prices are declining (-3.0%/yr); year-one equity from $864 of loan paydown is wiped out by about $4k of value loss. Plan a longer hold.
- Peoria County population projected at -11% by 2050 — secular population decline; favor cash flow + early exit over multi-decade hold.
Negotiation context
- Only 9 days on market — expect competitive offers; lowballing is unlikely to land.
- 2 sale attempts since 15y ago with the ask held roughly flat each time — persistent listings suggest the price (not the market) is what's stuck; bring a comps-based counter.
- Current owner paid $88k; 41% above their basis — modest negotiation headroom, anchor on the comps not their cost.
Risks & watch-outs
- Watch-outs: built in 1940 — expect roof / HVAC / electrical / plumbing capex.
Questions for the listing agent
- Built in 1940 — when were the roof, HVAC, electrical panel, plumbing, and water heater last replaced?
- Is there a deadline driving the sale (1031 exchange, divorce, estate, relocation)? That informs how much negotiation room exists.
- Schools are F-rated, which usually means shorter tenancies and higher turnover. Who's the typical renter profile here, and what's been the actual vacancy rate?
- Crime grade is F in this area — have there been break-ins, vandalism, or insurance claims at this property in the last 3 years? What carrier currently insures it and at what premium?
- The area grade is low — what's the realistic commute time and amenity access for the typical tenant pool here? Any planned neighborhood developments (good or bad) we should know about?
- What's the average days-on-market for RENTAL listings here right now (not sales)? A rising rental-DOM trend means longer vacancies and softer asking-rent achievability than the comps imply.
- What's the recent tenant-quality profile in this submarket — average credit score on applications, eviction rate, late-payment / NSF rate, and stable-employment percentage? A property-management company in the area should have these aggregated.
- How much new for-sale + rental construction is in the pipeline within 1–3 miles? Heavy new supply typically softens prices + rents 12–24 months out; constrained supply supports both.
Investment metrics
- 1% rule
- 0.84% ✗
- Cap rate
- 6.63%
- Cash-on-cash
- 1.21%
- DSCR
- 1.05
- GRM
- 10.0
CMA / ARV
- ARV (on-the-fly)
- $102,595
- Comps found
- 12
Show comp detail 12 sales within ~0.75 mi
| Address | Dist | Beds/Ba | Sqft | Sold | Price | $/sf | Match |
|---|---|---|---|---|---|---|---|
| 3223 N Wisconsin Ave | 0.30mi | 4/2.0 (+1) | 1,447 (+0%) | 1mo | $44,900 | $31 | 78 |
| 1016 E Virginia Ave | 0.44mi | 3/2.5 | 1,427 (-1%) | 1mo | $83,000 | $58 | 77 |
| 2635 N Peoria Ave | 0.35mi | 3/1.0 | 1,366 (-6%) | 2mo | $93,000 | $68 | 67 |
| 829 E Mcclure Ave | 0.40mi | 2/1.0 (-1) | 1,412 (-2%) | 1mo | $35,000 | $25 | 66 |
| 812 E Seneca Pl | 0.25mi | 3/3.0 | 1,640 (+14%) | 3mo | $161,500 | $98 | 62 |
| 309 W Hanssler PI | 0.64mi | 3/1.0 | 1,468 (+2%) | 1mo | $25,000 | $17 | 61 |
| 2704 N Prospect Rd | 0.55mi | 3/2.0 | 1,549 (+7%) | 0mo | $110,000 | $71 | 60 |
| 308 E Corrington Ave | 0.25mi | 2/1.0 (-1) | 1,284 (-11%) | 2mo | $94,600 | $74 | 57 |
| 923 E London Ave | 0.62mi | 3/2.0 | 1,620 (+12%) | 0mo | $156,240 | $96 | 49 |
| 3122 N North St | 0.67mi | 2/1.5 (-1) | 1,562 (+8%) | 3mo | $142,500 | $91 | 44 |
| 2624 N Prospect Rd | 0.56mi | 2/1.0 (-1) | 1,260 (-13%) | 0mo | $74,500 | $59 | 41 |
| 1101 E Paris Ave | 0.73mi | 2/1.0 (-1) | 1,292 (-11%) | 0mo | $114,000 | $88 | 37 |
Match score weights: distance 35% · size 25% · config 20% · recency 20%. Top-matched comps best support the ARV.
Projected returns pro-forma
-3.0% appreciation · 3.49% rent growth · sell at horizon
- IRR
- -13.9%
- Equity multiple
- 0.50×
- Total profit
- $-17,501
- Equity at exit
- $18,623
- IRR
- -4.4%
- Equity multiple
- 0.71×
- Total profit
- $-10,312
- Equity at exit
- $10,799
Cash invested: $34,972 (down + closing). Projections, not guarantees.
Landlord ↔ Tenant lean methodology
- Overall (STATE)
- 43 Moderately Tenant-Leaning
- State Illinois
- 43 Moderately Tenant-Leaning · D+7
- County
- — inherits STATE
- City
- — inherits STATE
ZIP-level market 61603
- Home prices YoY
- -31.8%
- Rents YoY
- 3.5%
- Active inventory
- 104
- Price-to-rent
- 10.0×
Monthly cashflow live
- Estimated rent
- $1,046 high interval (Pro) →
- Mortgage (P&I)
- −$655
- Tax from tax record
- −$84 /mo · $1,009/yr
- Insurance
- −$52
- HOA
- −$0
- Vacancy / Maint / Mgmt
- −$220
- Net cashflow
- $35
Break-even live
Sensitivity live
| Price | -10% $106 | -5% $71 | +0% $35 | +5% $0 | +10% $-35 |
|---|---|---|---|---|---|
| Rent | -10% $-47 | -5% $-6 | +0% $35 | +5% $77 | +10% $118 |
| Rate | -1.0pp $98 | -0.5pp $67 | base $35 | +0.5pp $3 | +1.0pp $-30 |
UW: 25.0% down · 7.5% · 30yr · 1.5% tax · 5.0% vac · 8.0% maint · 8.0% mgmt
Financing live
Cash to close
- Down payment
- $31,225
- Closing costs
- $3,747
- Reserves months
- —
- Total cash needed
- —
Loan-product check · same deal, 3 products live
Conventional
25% down · 7.5% · 30yr
- Down + closing
- —
- Monthly P&I
- —
- Monthly cashflow
- —
- DSCR
- —
- Eligible?
- —
Personal DTI + credit; lowest rate.
DSCR
20% down · 8.5% · 30yr
- Down + closing
- —
- Monthly P&I
- —
- Monthly cashflow
- —
- DSCR
- —
- Eligible?
- —
No personal income docs; deal must DSCR.
Hard money
10% down · 12.0% · 12mo
- Down + closing
- —
- Monthly P&I
- —
- Monthly cashflow
- —
- DSCR
- —
- Eligible?
- —
Short-term bridge; refi at stabilization.
Rent comps 17 comps
| Address | Beds | Baths | Sqft | Rent | $/sqft | DOM | Units | Dist |
|---|---|---|---|---|---|---|---|---|
| 505 E Virginia Ave Peoria, IL | 2.0 | 2.0 | 1204 | $758 | $0.63 | 15d | 1 | 0.33mi |
| 308 E Archer Ave Peoria, IL | 3.0 | 1.0 | 1444 | $950 | $0.66 | 15d | 1 | 0.54mi |
| 2210 Knoxville Ave #2212 Peoria, IL | 2.0 | 1.0 | 1284 | $950 | $0.74 | 45d | 1 | 0.68mi |
| 2121 N Prospect Rd Peoria, IL | 3.0 | 1.0 | 946 | $802 | $0.85 | 15d | 1 | 0.80mi |
| 1806 N Peoria Ave Peoria, IL | 4.0 | 1.5 | 1668 | $894 | $0.54 | 15d | 1 | 1.01mi |
| 814 W McClure Ave Peoria, IL | 3.0 | 1.0 | 1148 | $1,100 | $0.96 | 45d | 1 | 1.11mi |
| 126 E Lake Ave Peoria, IL | 2.0 | 1.0 | 950 | $1,050 | $1.11 | 15d | 9 | 1.16mi |
| 913 W McClure Ave Peoria, IL | 3.0 | 1.0 | 1400 | $1,200 | $0.86 | 23d | 1 | 1.18mi |
| 228 E Oak Cliff Ct Unit A2 Peoria, IL | 2.0 | 1.0 | 1000 | $1,050 | $1.05 | 15d | 1 | 1.21mi |
| 3108 N Parish Ave Peoria, IL | 3.0 | 1.5 | 967 | $1,750 | $1.81 | 45d | 1 | 1.24mi |
| 903 W Brons Ave Peoria, IL | 3.0 | 1.0 | 971 | $995 | $1.02 | 45d | 1 | 1.25mi |
| 901 NE Glen Oak Ave Unit 2 Peoria, IL | 3.0 | 1.0 | 1120 | $1,200 | $1.07 | 23d | 1 | 1.28mi |
| W Crestwood Dr Peoria, IL | 1.0–2.0 | 1.0 | 800 | $975 | $1.22 | 15d | 4 | 1.31mi |
| 526 Fairholm Ave Peoria, IL | 3.0 | 2.0 | 1174 | $925 | $0.79 | 45d | 1 | 1.32mi |
| 2302 NE Monroe St Peoria, IL | 3.0 | 1.0 | 1100 | $875 | $0.80 | 15d | 1 | 1.33mi |
| 905 E Marietta Ave Unit A Peoria Heights, IL | 2.0 | 2.0 | 1200 | $1,600 | $1.33 | 15d | 1 | 1.36mi |
| 506 Caroline St Unit B Peoria, IL | 2.0 | 1.0 | 1000 | $900 | $0.90 | 15d | 1 | 1.37mi |
Listing history 21 events
-
2026-06-22days on market $124,900 Under Contract 9 DOM
-
2026-06-19days on market $124,900 Under Contract 7 DOM
-
2026-06-18days on market $124,900 Under Contract 6 DOM
-
2026-06-17days on market $124,900 Under Contract 5 DOM
-
2026-06-16days on market $124,900 Under Contract 4 DOM
-
2026-06-15days on market $124,900 Under Contract 3 DOM
-
2026-06-14status $124,900 Under Contract 1 DOM
-
2026-06-13statusdays on market $124,900 Active 1 DOM
-
2026-06-10days on market $124,900 Coming Soon 25 DOM
-
2026-06-09days on market $124,900 Coming Soon 24 DOM
-
2026-06-08days on market $124,900 Coming Soon 23 DOM
-
2026-06-07days on market $124,900 Coming Soon 22 DOM
-
2026-06-03days on market $124,900 Coming Soon 18 DOM
-
2026-06-02days on market $124,900 Coming Soon 17 DOM
-
2026-06-01days on market $124,900 Coming Soon 16 DOM
-
2026-05-31days on market $124,900 Coming Soon 15 DOM
-
2026-05-30days on market $124,900 Coming Soon 14 DOM
-
2026-05-16historical $124,900
-
2012-02-10soldstatus $88,500
-
2012-02-08soldstatus $88,500 599-char remark
Show marketing remark (599 chars)
Charm meets chic in this beautifully decorated and updated home! Living room has glass door to a den with built-in bookcases and a window seat. Formal dining room has a built-in corner cabinet. Kitchen is updated with tile floor and granite countertops! Wonderful master bedroom and second bedroom have dormers. Remodeled main floor and upper level bathrooms. Main floor bedroom could be family room or den. Updates include furnace/air 2009, roof 2008, vinyl siding and some windows 1998. Fabulous, deep back yard with many perennials and new terrace wall. Covered patio overlooking back yard.
-
2011-09-07$94,900 599-char remark
Show marketing remark (599 chars)
Charm meets chic in this beautifully decorated and updated home! Living room has glass door to a den with built-in bookcases and a window seat. Formal dining room has a built-in corner cabinet. Kitchen is updated with tile floor and granite countertops! Wonderful master bedroom and second bedroom have dormers. Remodeled main floor and upper level bathrooms. Main floor bedroom could be family room or den. Updates include furnace/air 2009, roof 2008, vinyl siding and some windows 1998. Fabulous, deep back yard with many perennials and new terrace wall. Covered patio overlooking back yard.
ⓘ Source: listings_history table (triggers on properties + properties_extension) + one-shot
backfill from property_details.listing_events for pre-trigger history.
Tax reassessment forecast IL · Partial reset (capped growth)
- Current annual tax
- $1,009 · $84/mo
- Projected year-2 tax
- $1,922 · $160/mo
- Expected delta
- +$913/yr (+$76/mo · 90.5%)
ⓘ Screening estimate from a state-policy table — verify with the county assessor before closing.
Climate risk First Street
- Flood 1/10 Low FEMA zone X · 0% chance over 30 yrs
- Wildfire 1/10 Low
- Heat 3/10 Moderate 7 d/yr ≥105°F today · 18 d/yr by 30 yrs out
- Wind 2/10 Low 100% chance of damaging wind over 30 yrs
- Air quality 3/10 Moderate 1 unhealthy d/yr today · 3 by 30 yrs out
Nearby sold comps map
Loading sold comps map…
Walkable amenities ~0.75 mi
Loading nearby amenities…
Taxation est. · year 1
- Rental income
- $12,553
- − Mortgage interest
- −$6,996
- − Property taxes
- −$1,009
- − Insurance
- −$624
- − Repairs & maintenance
- −$1,004
- − Management
- −$1,004
- − Depreciation
- −$3,633
- Taxable loss
- −$1,719
- Est. tax savings @ 24.0%
- +$412
- After-tax cash flow
- $836/yr
For passive investors: Depreciation is non-cash, so a rental often shows a tax loss while cash-flowing — sheltering income. Rental losses are passive: they offset passive income freely, and up to $25,000/yr can offset ordinary (W-2) income if you actively participate and your MAGI is under $100k (phasing out to $0 by $150k); unused losses carry forward. On sale, claimed depreciation is recaptured at up to 25%, and gains may owe capital-gains tax (a 1031 exchange can defer both). Figures are a year-1 estimate at your 24.0% rate — not tax advice; consult a CPA.
Schools (NCES district)
- District
- Peoria SD 150
- NCES district ID
- 1731230
- Math proficiency
- 11% ▼ -5.00%
- Reading proficiency
- 14% ▼ -4.00%
- Median HH income
- $41,951
- Composite
- 10.92/100
- National rank
- #9751
- State rank
- #554 of 620 in IL
Livability — Peoria
- Score
- 73/100
- State rank
- #270
- US rank
- #5096
Category grades
Schools grade is shown separately in the Schools card above.
Census & demographics
- Census place
- Peoria, IL
- County
- Peoria County · 120,495 people
- City population
- 114,670
- Metro
- Peoria, IL
- Population (ZIP)
- 15,356
- Household income
- $41,618
- Rent vs Own
- Severe rent burden
- 849.0
Population outlook (Peoria County) Hauer SSP2
- Today (2025)
- 183,007 people
- By 2030
- 179,643 · -1.8%
- By 2040
- 171,782 · -6.1%
- By 2050
- 163,508 · -10.7%
- By 2075
- 140,178 · -23.4%
- By 2100
- 114,493 · -37.4%
Race, ethnicity, and origin ACS 2023
- Neighborhood character
- Diverse neighborhood (Simpson 0.68)
- Race & ethnicity
- Black 43% White 36% Two or more races 12% Hispanic / Latino 10% Asian 1%
- Hispanic origin (detail)
- Mexican 7%
- Common ancestry
- Italian 2% Slovak 1% Lithuanian 1%
- Foreign-born
- 7% · Canada
- Languages at home
- 91% English-only · Spanish 6% Tagalog/Filipino 1%
Political lean MEDSL · Peoria
- 2024 margin
- Toss-up / Even · D 51.5% · R 46.9% · Other 1.6%
- 2008→2024 swing
- -9.2pp toward R · 2008: 13.9pp · 2024: 4.7pp
- All cycles
- 2024: D+4.7 2020: D+6.3 2016: D+2.8 2012: D+4.4 2008: D+13.9
Not yet ingested
- Civics
- —
Market trends
- HPI YoY
- ▼ -65.98%
- Current HPI
- 141.5343
- Rent YoY
- ▲ 3.49%
- Metro
- Peoria, IL
- State GDP YoY
- ▲ 1.59%
- F500 in state
- 60
Industry mix (Fortune 500 HQ in IL)
| Industry | F500 HQs | Revenue |
|---|---|---|
| Insurance | 4 | $201B |
|
||
| Consumer Goods | 4 | $87B |
|
||
| Industrial Machinery | 3 | $64B |
|
||
| Healthcare | 2 | $55B |
|
||
| Retail / Pharmacy | 1 | $148B |
|
||
| Agriculture / Food | 1 | $86B |
|
||
Price history
+31.6% since first listed6 events — show timeline
- 2026-06-13 Contingent — RMLSA as Distributed by MLS Grid
- 2026-06-12 Listed $124,900 RMLSA as Distributed by MLS Grid
- 2026-05-16 Coming Soon $124,900 RMLSA as Distributed by MLS Grid
- 2012-02-10 Sold (Public Records) $88,500 Public Records
- 2012-02-08 Sold (MLS) $88,500 RMLSA as Distributed by MLS Grid
- 2011-09-07 Listed $94,900 RMLSA as Distributed by MLS Grid
Property tax history
-5.3%/yrLatest (2025): $1,009 · -2.4% YoY. Source: county tax records.
Cash-flow waterfall
monthlySold comps — $/sqft
last 12 mo · ≤1 miLoading sold comps…