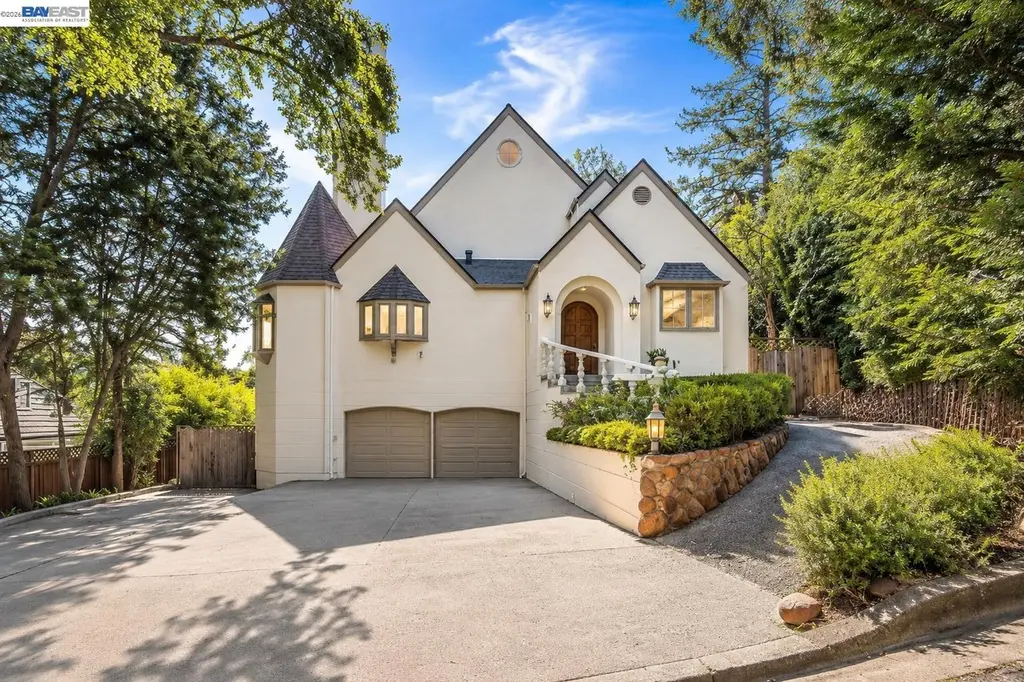
3 Lerner Dr · Calistoga, CA
Flood risk 1/10 · Minimal
- FEMA flood zone
- X (unshaded)
- Chance of flooding over 30 yrs
- 0.0%
- Est. flood insurance / yr
- $507 – $1,088
Fire risk 7/10 · Major
- Est. fire insurance / yr
- $659 – $1,223
Heat risk 5/10 · Moderate
- Hot days now (above 100°F)
- 7 days/yr
- Hot days in 30 yrs
- 15 days/yr
Wind risk 1/10 · Minimal
- Chance of severe wind over 30 yrs
- —
Air-quality risk 10/10 · Severe
- Unhealthy air days now
- 29 days/yr
- Unhealthy air days in 30 yrs
- 30 days/yr
Risk factors via First Street. Map © Google.
Why this score? — see what drove the B- grade
The composite is a weighted blend of 9 inputs, each scored 0–100. Each bar is that input's sub-score; the figure is the points it added to the 100-point composite (weight × sub-score).
- Cash flow +25.3/30.0
- DSCR +8.4/10.0
- ARV discount +7.5/15.0
- 1% rule +6.6/10.0
- Appreciation +5.0/10.0
- Condition / age +4.0/5.0
- Schools +3.9/10.0
- Livability +3.2/5.0
- Rent growth +2.5/5.0
$1,790,999
🖨 Deal sheet 📄 Offer letter ✓ Due diligence
Listing remarks
Tucked along a quiet, oak-lined lane, this fully furnished French inspired château rises above the vineyards with an effortless blend of sophistication and wine country warmth. Lavender and towering old trees surround the estate, while Mount St. Helena forms a dramatic backdrop. The 4bedroom, 4.5-bath residence offers spacious ensuite rooms, soaring ceilings, and a refined mix of marble, wood, and custom finishes, along with a private entertainment suite complete with a kitchenette and half bath. All luxury furnishings are included. Inside, bespoke details and sun-filled suites create an atmosphere of understated elegance. Terraces flow into the landscape, where a hot tub, open-air sh
Key facts
- 0.25 acre lot
- 2 garage spots
- Built 1991
Property features AI
Exterior
- Parking: Attached garage (2 covered spaces, drive-through configuration)
- Utilities: Public water
- Home design: Single-family residence; Residential property; Built in 1991
- Construction: Stucco construction
- Exterior features: Back yard; Front yard; Terraced back yard; Low-maintenance landscaping; Yard space; Deck; Covered rear porch; Fenced yard with wood fencing
Interior
- Kitchen: Kitchen with additional/other features
- Bedrooms: Multiple specialized rooms including au pair and bonus room (total rooms include atrium, den, family room, library, music room, office, unfinished room, utility room)
- Bathrooms: 6 bathrooms total (5 full, 1 partial)
- Heating & cooling: Forced-air heating; Central air conditioning
- Interior features: Atrium; Au pair suite; Den; Family room; Library; Music room; Study; Unfinished room; Utility room; 2 fireplaces
- Laundry & utility: Utility room
Neighborhood map
What this means for you Summary
Snapshot
- This is a 4-bed/5.5-bath single-family listed at $1.79M. Condition is rated good.
Deal economics
- At list price, monthly cash flow is $4k ($49k/yr) — positive.
- The deal already cash-flows at list — no discount required.
- Meets the 1% rule at list price ($21k rent vs $1.79M).
- Recommended offer: $1.76M (1.5% below list) — sets the bar for market timing.
- Cap rate 9.0% vs local median 2.4% in Calistoga — top-decile yield for the area; either an underpriced asset or a hidden risk that comps aren't pricing in. Stress-test before assuming the spread holds.
Location & tenants
- Location reads 63/100 on livability (#448 in CA) — a middle-class / working-renter tenant base. Strengths: health & safety A+, employment A-; Watch: schools D+, amenities F, commute F.
- Calistoga Joint Unified (town): math 33% / reading 51% proficiency, ranked #624 of 1,400 in CA (top 45%) — families likely to look elsewhere, expect single-tenant / working-renter base with shorter leases.
- Market conditions: 1 active listings in the ZIP; 2 comparable units currently listed for rent nearby; 427 units permitted in Napa County in 2024 (189 in 5+ unit buildings).
Forward outlook
- In year one you build about $66k of equity ($12k loan paydown + $54k appreciation (3.0% local appreciation)).
- Napa County population projected at +14% by 2050 — modest demand growth; plan on rents tracking national, not racing it.
- At projected returns (3.0% appreciation + 3.0% rent growth), your $501k cash investment doubles in ~4 years — after that, you're playing with house money.
- By year 2, paydown + projected appreciation supports a ~$108k cash-out refi (75% LTV) — recoverable capital for the next deal without selling this one.
Negotiation context
- It's been on market 20 days — a 2% lower offer ($1.76M) is reasonable based on typical stale-listing flexibility.
Risks & watch-outs
- Climate carrying-cost: major wildfire risk; extreme-heat days projected 7→15/yr by 2055 (HVAC capex compounding) — expect insurance premiums to compound above CPI over the hold.
Questions for the listing agent
- Is there a deadline driving the sale (1031 exchange, divorce, estate, relocation)? That informs how much negotiation room exists.
- Schools are D-rated, which usually means shorter tenancies and higher turnover. Who's the typical renter profile here, and what's been the actual vacancy rate?
- What's the average days-on-market for RENTAL listings here right now (not sales)? A rising rental-DOM trend means longer vacancies and softer asking-rent achievability than the comps imply.
- What's the recent tenant-quality profile in this submarket — average credit score on applications, eviction rate, late-payment / NSF rate, and stable-employment percentage? A property-management company in the area should have these aggregated.
- How much new for-sale + rental construction is in the pipeline within 1–3 miles? Heavy new supply typically softens prices + rents 12–24 months out; constrained supply supports both.
Investment metrics
- 1% rule
- 1.16% ✓
- Cap rate
- 9.03%
- Cash-on-cash
- 9.78%
- DSCR
- 1.44
- GRM
- 7.2
CMA / ARV
No comps found within radius.
Projected returns pro-forma
3.0% appreciation · 3.0% rent growth · sell at horizon
- IRR
- 16.7%
- Equity multiple
- 1.95×
- Total profit
- $476,396
- Equity at exit
- $805,311
- IRR
- 18.2%
- Equity multiple
- 3.66×
- Total profit
- $1,331,794
- Equity at exit
- $1,241,080
Cash invested: $501,480 (down + closing). Projections, not guarantees.
Landlord ↔ Tenant lean methodology
- Overall (STATE)
- 18 Strongly Tenant-Friendly
- State California
- 18 Strongly Tenant-Friendly · D+13
- County
- — inherits STATE
- City
- — inherits STATE
ZIP-level market 04515
- Active inventory
- 1
- Price-to-rent
- 7.2×
Monthly cashflow live
- Estimated rent
- $20,841 medium interval (Pro) →
- Mortgage (P&I)
- −$9,392
- Tax est. 1.5%
- −$2,239 /mo · $26,865/yr
- Insurance
- −$746
- HOA
- −$0
- Vacancy / Maint / Mgmt
- −$4,377
- Net cashflow
- $4,087
Break-even live
UW: 25.0% down · 7.5% · 30yr · 1.5% tax · 5.0% vac · 8.0% maint · 8.0% mgmt
Financing live
Cash to close
- Down payment
- $447,750
- Closing costs
- $53,730
- Reserves months
- —
- Total cash needed
- —
Loan-product check · same deal, 3 products live
Conventional
25% down · 7.5% · 30yr
- Down + closing
- —
- Monthly P&I
- —
- Monthly cashflow
- —
- DSCR
- —
- Eligible?
- —
Personal DTI + credit; lowest rate.
DSCR
20% down · 8.5% · 30yr
- Down + closing
- —
- Monthly P&I
- —
- Monthly cashflow
- —
- DSCR
- —
- Eligible?
- —
No personal income docs; deal must DSCR.
Hard money
10% down · 12.0% · 12mo
- Down + closing
- —
- Monthly P&I
- —
- Monthly cashflow
- —
- DSCR
- —
- Eligible?
- —
Short-term bridge; refi at stabilization.
Rent comps 2 comps
| Address | Beds | Baths | Sqft | Rent | $/sqft | DOM | Units | Dist |
|---|---|---|---|---|---|---|---|---|
| 1823 Foothill Blvd Calistoga, CA | 4.0 | 3.5 | 2889 | $9,900 | $3.43 | 2d | 1 | 0.26mi |
| 375 Kortum Canyon Rd Calistoga, CA | 4.0 | 4.5 | 4622 | $37,000 | $8.01 | 21d | 1 | 0.47mi |
Listing history 14 events
-
2026-06-15pricedays on market $1,790,999 Active 20 DOM
-
2026-06-14days on market $1,790,000 Active 18 DOM
-
2026-06-13days on market $1,790,000 Active 17 DOM
-
2026-06-10days on market $1,790,000 Active 15 DOM
-
2026-06-09days on market $1,790,000 Active 14 DOM
-
2026-06-08days on market $1,790,000 Active 13 DOM
-
2026-06-07days on market $1,790,000 Active 12 DOM
-
2026-06-05pricedays on market $1,790,000 Active 9 DOM
-
2026-06-03days on market $2,000,000 Active 8 DOM
-
2026-06-02days on market $2,000,000 Active 7 DOM
-
2026-06-01days on market $2,000,000 Active 6 DOM
-
2026-05-31days on market $2,000,000 Active 5 DOM
-
2026-05-30days on market $2,000,000 Active 4 DOM
-
2026-05-23historical $2,000,000
ⓘ Source: listings_history table (triggers on properties + properties_extension) + one-shot
backfill from property_details.listing_events for pre-trigger history.
Climate risk First Street
- Flood 1/10 Low FEMA zone X (unshaded) · 0% chance over 30 yrs
- Wildfire 7/10 Severe
- Heat 5/10 Major 7 d/yr ≥100°F today · 15 d/yr by 30 yrs out
- Wind 1/10 Low
- Air quality 10/10 Extreme 29 unhealthy d/yr today · 30 by 30 yrs out
Nearby sold comps map
Loading sold comps map…
Walkable amenities ~0.75 mi
Loading nearby amenities…
Taxation est. · year 1
- Rental income
- $250,095
- − Mortgage interest
- −$100,324
- − Property taxes
- −$26,865
- − Insurance
- −$8,955
- − Repairs & maintenance
- −$20,008
- − Management
- −$20,008
- − Depreciation
- −$52,102
- Taxable income
- $21,834
- Est. tax owed @ 24.0%
- −$5,240
- After-tax cash flow
- $43,809/yr
For passive investors: Depreciation is non-cash, so a rental often shows a tax loss while cash-flowing — sheltering income. Rental losses are passive: they offset passive income freely, and up to $25,000/yr can offset ordinary (W-2) income if you actively participate and your MAGI is under $100k (phasing out to $0 by $150k); unused losses carry forward. On sale, claimed depreciation is recaptured at up to 25%, and gains may owe capital-gains tax (a 1031 exchange can defer both). Figures are a year-1 estimate at your 24.0% rate — not tax advice; consult a CPA.
Condition & rehab AI · 30 photos
This French-inspired château is in excellent condition with modern amenities and a stunning view. It's move-in ready with minor cosmetic updates to enhance its curb appeal and value.
Value-add opportunities
- Resale Paint exterior — Enhances curb appeal
- Both Replace carpet with hardwood — Improves both resale and rental value
- Resale Update kitchen appliances — Modernizes the space and adds value
Renovation cost estimate screening
Value-add ROI direction
- Resale Paint exterior — Enhances curb appeal ↑
- Both Replace carpet with hardwood — Improves both resale and rental value ↑
- Resale Update kitchen appliances — Modernizes the space and adds value ↑
ⓘ Cost ranges are severity-bucket heuristics (US national rule-of-thumb). Get contractor quotes + a written scope before underwriting a rehab budget.
Schools (NCES district)
- District
- Calistoga Joint Unified
- NCES district ID
- 0607020
- Math proficiency
- 33% ▲ 2.00%
- Reading proficiency
- 51% ▲ 5.00%
- Median HH income
- $60,716
- Composite
- 39.48/100
- National rank
- #8101
- State rank
- #624 of 1400 in CA
Livability — Calistoga
- Score
- 63/100
- State rank
- #448
- US rank
- #15176
Category grades
Schools grade is shown separately in the Schools card above.
Census & demographics
- Census place
- Calistoga, CA
Population outlook (Napa County) Hauer SSP2
- Today (2025)
- 153,987 people
- By 2030
- 159,490 · +3.6%
- By 2040
- 168,796 · +9.6%
- By 2050
- 176,213 · +14.4%
- By 2075
- 190,113 · +23.5%
- By 2100
- 190,528 · +23.7%
Not yet ingested
- Political lean
- —
- Race & ethnicity
- —
- Common origin
- —
- Civics
- —
Market trends
- HPI YoY
- —
- Current HPI
- —
- Rent YoY
- —
- Metro
- —
- State GDP YoY
- ▲ 3.21%
- F500 in state
- 116
Industry mix (Fortune 500 HQ in CA)
| Industry | F500 HQs | Revenue |
|---|---|---|
| Technology | 27 | $1,492B |
|
||
| Financial Services | 3 | $174B |
|
||
| Retail | 3 | $44B |
|
||
| Insurance | 3 | $26B |
|
||
| Media / Entertainment | 2 | $115B |
|
||
| Pharmaceuticals / Biotech | 2 | $62B |
|
||
Price history
1 event — show timeline
- 2026-05-23 Coming Soon $2,000,000 bridgeMLS, Bay East AOR, or Contra Costa AOR
Cash-flow waterfall
monthlySold comps — $/sqft
last 12 mo · ≤1 miLoading sold comps…