37083 Sugar Hill Way · Ocean City, MD
Flood risk No data
- FEMA flood zone
- —
- Chance of flooding over 30 yrs
- —
- Est. flood insurance / yr
- —
Fire risk No data
- Est. fire insurance / yr
- —
Heat risk No data
- Hot days now (above threshold)
- —
- Hot days in 30 yrs
- —
Wind risk No data
- Chance of severe wind over 30 yrs
- —
Air-quality risk No data
- Unhealthy air days now
- —
- Unhealthy air days in 30 yrs
- —
Risk factors via First Street. Map © Google.
Why this score? — see what drove the C- grade
The composite is a weighted blend of 9 inputs, each scored 0–100. Each bar is that input's sub-score; the figure is the points it added to the 100-point composite (weight × sub-score).
- Cash flow +25.6/30.0
- DSCR +8.5/10.0
- 1% rule +6.8/10.0
- Condition / age +4.0/5.0
- Livability +3.7/5.0
- Schools +2.9/10.0
- Rent growth +2.5/5.0
- ARV discount +0.0/15.0
- Appreciation +0.0/10.0
$169,900
🖨 Deal sheet 📄 Offer letter ✓ Due diligence
Listing remarks
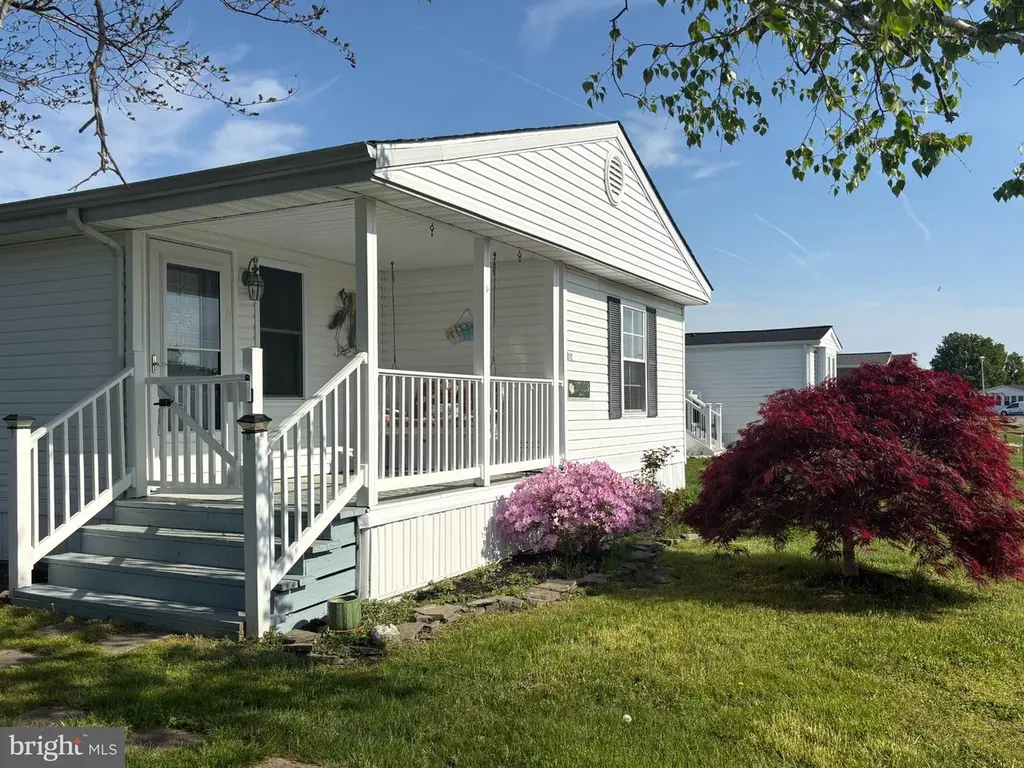
Welcome to this beautifully updated 3-bedroom, 2-bath home with two versatile flex rooms, tucked away in the welcoming community of Shady Park in Selbyville, Delaware. From the moment you enter, you’ll love the light-filled interior, refreshed with soft neutral colors, updated flooring, and an airy open-concept design that feels both warm and inviting. The spacious living area flows effortlessly into the kitchen and dining space, creating the perfect setting for everyday living and entertaining alike. The refreshed kitchen features bright white cabinetry, sleek countertops, stainless steel appliances, and generous storage and prep space, blending style and functionality with ease. Nea
Key facts
- Flexible bonus rooms
- Updated home
- Refreshed kitchen
Tags
Property features AI
Finance
- Other: Living area reported as estimated (about 1,500 above-grade finished); Total below-grade area reported as 0
- HOA & community: HOA fee $20 annually; Land lease with monthly payment of $945 and 99 years remaining; Property manager present; Located in Shady Park (outside city limits)
Exterior
- Parking: Off-street parking
- Utilities: Public water; Public sewer; Electric hot water
- Home design: Manufactured double-wide home; Estimated 2026 major remodel; Excellent condition
- Construction: Aluminum siding; Asphalt roof; Estimated year built information
- Exterior features: Porch(es); Not in a federal flood zone; Above-grade and below-grade structures noted
Interior
- Kitchen: Refrigerator; Dishwasher; Electric oven/range; Range hood
- Bedrooms: Three bedrooms on the main level
- Flooring: Luxury vinyl plank
- Bathrooms: Two full bathrooms (both on the main level)
- Heating & cooling: Forced air heating; Propane (leased) heating fuel; Central air conditioning (electric)
- Interior features: Stall shower; Tub/shower; Family room off kitchen; Entry-level bedroom
- Laundry & utility: Washer and dryer in unit on the main floor
Neighborhood map
What this means for you Summary
Snapshot
- This is a 2-bed/2.0-bath manufactured listed at $170k. Condition is rated good.
Deal economics
- At list price, monthly cash flow is $404 ($5k/yr) — positive.
- The deal already cash-flows at list — no discount required.
- Meets the 1% rule at list price ($2k rent vs $170k).
- Recommended offer: $165k (3.0% below list) — sets the bar for market timing.
- Cap rate 9.1% vs local median 1.4% in Ocean City — top-decile yield for the area; either an underpriced asset or a hidden risk that comps aren't pricing in. Stress-test before assuming the spread holds.
Location & tenants
- Location reads 73/100 on livability (#125 in MD) — a middle-class / working-renter tenant base. Strengths: commute A+, health & safety A+, schools B+; Watch: cost of living C-, crime F.
- Indian River School District (rural): math 25% / reading 41% proficiency, ranked #14 of 26 in DE (top 54%) — families likely to look elsewhere, expect single-tenant / working-renter base with shorter leases.
- Market conditions: 1 comparable units currently listed for rent nearby; 4,354 units permitted in Sussex County in 2024 (344 in 5+ unit buildings).
Forward outlook
- Local home prices are declining (-3.0%/yr); year-one equity from $1k of loan paydown is wiped out by about $5k of value loss. Plan a longer hold.
- Sussex County population projected at +25% by 2050 — long-run rental-demand tailwind backs the buy-and-hold thesis.
Negotiation context
- It's been on market 36 days — a 3% lower offer ($165k) is reasonable based on typical stale-listing flexibility.
- 2 sale attempts with the ask held roughly flat each time — persistent listings suggest the price (not the market) is what's stuck; bring a comps-based counter.
Questions for the listing agent
- It's been on market 36 days. Have you received any prior offers? Is the seller open to a 3% concession, seller financing, or rate buy-down credit?
- What does the HOA fee cover, when was the last increase, and are there any pending special assessments or reserve-fund shortfalls?
- Is there a deadline driving the sale (1031 exchange, divorce, estate, relocation)? That informs how much negotiation room exists.
- Schools are B-rated — typically a magnet for longer-tenancy family renters. What's the average tenant stay here, and is there a school-zone premium baked into asking?
- Crime grade is F in this area — have there been break-ins, vandalism, or insurance claims at this property in the last 3 years? What carrier currently insures it and at what premium?
- What's the average days-on-market for RENTAL listings here right now (not sales)? A rising rental-DOM trend means longer vacancies and softer asking-rent achievability than the comps imply.
- What's the recent tenant-quality profile in this submarket — average credit score on applications, eviction rate, late-payment / NSF rate, and stable-employment percentage? A property-management company in the area should have these aggregated.
- How much new for-sale + rental construction is in the pipeline within 1–3 miles? Heavy new supply typically softens prices + rents 12–24 months out; constrained supply supports both.
Investment metrics
- 1% rule
- 1.18% ✓
- Cap rate
- 9.15%
- Cash-on-cash
- 10.19%
- DSCR
- 1.45
- GRM
- 7.1
CMA / ARV
- ARV (median comp)
- $145,392
- List price
- $169,900
- Delta
- 16.86%
- Verdict
- OVERPRICED
- Comps
- 20 within 1.0 mi
Show comp detail 1 sale within ~0.75 mi
| Address | Dist | Beds/Ba | Sqft | Sold | Price | $/sf | Match |
|---|---|---|---|---|---|---|---|
| 37597 Shady Cir | 0.25mi | 2/1.0 | 1,000 (+8%) | 10mo | $70,000 | $70 | 62 |
Match score weights: distance 35% · size 25% · config 20% · recency 20%. Top-matched comps best support the ARV.
Projected returns pro-forma
-3.0% appreciation · 3.0% rent growth · sell at horizon
- IRR
- -1.0%
- Equity multiple
- 0.96×
- Total profit
- $-1,778
- Equity at exit
- $25,333
- IRR
- 8.7%
- Equity multiple
- 1.67×
- Total profit
- $31,701
- Equity at exit
- $14,690
Cash invested: $47,572 (down + closing). Projections, not guarantees.
Landlord ↔ Tenant lean methodology
- Overall (STATE)
- 27 Tenant-Leaning
- State Maryland
- 27 Tenant-Leaning · D+14
- County
- — inherits STATE
- City
- — inherits STATE
ZIP-level market 19975
- Home prices YoY
- -11.2%
- Price-to-rent
- 7.1×
Monthly cashflow live
- Estimated rent
- $2,000 medium interval (Pro) →
- Mortgage (P&I)
- −$891
- Tax est. 1.5%
- −$212 /mo · $2,548/yr
- Insurance
- −$71
- HOA
- −$2
- Vacancy / Maint / Mgmt
- −$420
- Net cashflow
- $404
Break-even live
UW: 25.0% down · 7.5% · 30yr · 1.5% tax · 5.0% vac · 8.0% maint · 8.0% mgmt
Financing live
Cash to close
- Down payment
- $42,475
- Closing costs
- $5,097
- Reserves months
- —
- Total cash needed
- —
Loan-product check · same deal, 3 products live
Conventional
25% down · 7.5% · 30yr
- Down + closing
- —
- Monthly P&I
- —
- Monthly cashflow
- —
- DSCR
- —
- Eligible?
- —
Personal DTI + credit; lowest rate.
DSCR
20% down · 8.5% · 30yr
- Down + closing
- —
- Monthly P&I
- —
- Monthly cashflow
- —
- DSCR
- —
- Eligible?
- —
No personal income docs; deal must DSCR.
Hard money
10% down · 12.0% · 12mo
- Down + closing
- —
- Monthly P&I
- —
- Monthly cashflow
- —
- DSCR
- —
- Eligible?
- —
Short-term bridge; refi at stabilization.
Rent comps 1 comps
| Address | Beds | Baths | Sqft | Rent | $/sqft | DOM | Units | Dist |
|---|---|---|---|---|---|---|---|---|
| 38256 Hummingbird Ln #214 Selbyville, DE | 2.0 | 1.5 | 900 | $2,000 | $2.22 | 21d | 1 | 0.92mi |
HOA detail
- Monthly dues
- $2 · $24/yr
Listing history 17 events
-
2026-06-18days on market $169,900 Active 36 DOM
-
2026-06-17days on market $169,900 Active 35 DOM
-
2026-06-16days on market $169,900 Active 34 DOM
-
2026-06-15days on market $169,900 Active 33 DOM
-
2026-06-14days on market $169,900 Active 31 DOM
-
2026-06-13days on market $169,900 Active 30 DOM
-
2026-06-10days on market $169,900 Active 28 DOM
-
2026-06-09days on market $169,900 Active 27 DOM
-
2026-06-08days on market $169,900 Active 26 DOM
-
2026-06-07days on market $169,900 Active 25 DOM
-
2026-06-02days on market $169,900 Active 20 DOM
-
2026-06-01days on market $169,900 Active 19 DOM
-
2026-05-31days on market $169,900 Active 18 DOM
-
2026-05-30days on market $169,900 Active 17 DOM
-
2026-05-13historical
-
2026-05-13$169,900 Active 1721-char remark
-
2026-03-27$189,900 Active
ⓘ Source: listings_history table (triggers on properties + properties_extension) + one-shot
backfill from property_details.listing_events for pre-trigger history.
Nearby sold comps map
Loading sold comps map…
Walkable amenities ~0.75 mi
Loading nearby amenities…
Taxation est. · year 1
- Rental income
- $24,000
- − Mortgage interest
- −$9,517
- − Property taxes
- −$2,548
- − Insurance
- −$850
- − Repairs & maintenance
- −$1,920
- − Management
- −$1,920
- − HOA
- −$24
- − Depreciation
- −$4,943
- Taxable income
- $2,278
- Est. tax owed @ 24.0%
- −$547
- After-tax cash flow
- $4,299/yr
For passive investors: Depreciation is non-cash, so a rental often shows a tax loss while cash-flowing — sheltering income. Rental losses are passive: they offset passive income freely, and up to $25,000/yr can offset ordinary (W-2) income if you actively participate and your MAGI is under $100k (phasing out to $0 by $150k); unused losses carry forward. On sale, claimed depreciation is recaptured at up to 25%, and gains may owe capital-gains tax (a 1031 exchange can defer both). Figures are a year-1 estimate at your 24.0% rate — not tax advice; consult a CPA.
Condition & rehab AI · 12 photos
This beautifully updated 3-bedroom, 2-bath home in Shady Park, Selbyville, MD, offers a fresh and inviting interior with updated flooring and kitchen, and a well-maintained exterior with a welcoming front porch. Minor updates to the exterior siding and window treatments could further enhance its curb appeal and value.
Value-add opportunities
- Both Paint exterior siding — Fresh paint can enhance curb appeal and property value
- Both Replace front porch swing cushions — Worn cushions can detract from the home's appeal
- Both Install new window treatments — Updated window treatments can improve energy efficiency and aesthetics
Renovation cost estimate screening
Value-add ROI direction
- Both Paint exterior siding — Fresh paint can enhance curb appeal and property value ↑
- Both Replace front porch swing cushions — Worn cushions can detract from the home's appeal ↑
- Both Install new window treatments — Updated window treatments can improve energy efficiency and aesthetics ↑
ⓘ Cost ranges are severity-bucket heuristics (US national rule-of-thumb). Get contractor quotes + a written scope before underwriting a rehab budget.
Schools (NCES district)
- District
- Indian River School District
- NCES district ID
- 1000680
- Math proficiency
- 25% ▼ -27.00%
- Reading proficiency
- 41% ▼ -17.00%
- Median HH income
- $53,838
- Composite
- 28.99/100
- National rank
- #6620
- State rank
- #14 of 26 in DE
Livability — Ocean City
- Score
- 73/100
- State rank
- #125
- US rank
- #5407
Category grades
Schools grade is shown separately in the Schools card above.
Census & demographics
- Population (ZIP)
- 10,356
Population outlook (Sussex County) Hauer SSP2
- Today (2025)
- 248,853 people
- By 2030
- 264,464 · +6.3%
- By 2040
- 290,980 · +16.9%
- By 2050
- 311,259 · +25.1%
- By 2075
- 352,488 · +41.6%
- By 2100
- 367,406 · +47.6%
Race, ethnicity, and origin ACS 2023
- Neighborhood character
- Predominantly White (86%)
- Race & ethnicity
- White 86% Hispanic / Latino 8% Two or more races 7% Black 3%
- Hispanic origin (detail)
- Mexican 4%
- Common ancestry
- Romanian 4% Slovak 4% Russian 2%
- Foreign-born
- 8% · Canada
- Languages at home
- 89% English-only · Spanish 8% Other Indo-European 2% Russian/Polish/Slavic 1%
Political lean MEDSL · Sussex
- 2024 margin
- R (+11.0) · D 43.9% · R 54.9% · Other 1.2%
- 2008→2024 swing
- -2.4pp toward R · 2008: -8.6pp · 2024: -11.0pp
- All cycles
- 2024: R+11.0 2020: R+11.2 2016: R+22.0 2012: R+13.0 2008: R+8.6
Not yet ingested
- Civics
- —
Market trends
- HPI YoY
- ▼ -43.61%
- Current HPI
- 345.1746
- Rent YoY
- —
- Metro
- —
- State GDP YoY
- ▲ 2.97%
- F500 in state
- 12
Industry mix (Fortune 500 HQ in MD)
| Industry | F500 HQs | Revenue |
|---|---|---|
| Aerospace / Defense | 1 | $71B |
|
||
| Utilities | 1 | $25B |
|
||
| Hotels | 1 | $24B |
|
||
| Consumer Goods | 1 | $7B |
|
||
| Real Estate | 1 | $6B |
|
||
| Chemicals | 1 | $2B |
|
||
Price history
-10.5% since first listed3 events — show timeline
- 2026-05-13 Listed $169,900 BRIGHT MLS
- 2026-05-13 Listing Removed — BRIGHT MLS
- 2026-03-27 Listed $189,900 BRIGHT MLS
Property tax history
-28.4%/yrLatest (2025): $148 · -28.4% YoY. Source: county tax records.
Cash-flow waterfall
monthlySold comps — $/sqft
last 12 mo · ≤1 miLoading sold comps…