 Multi-family
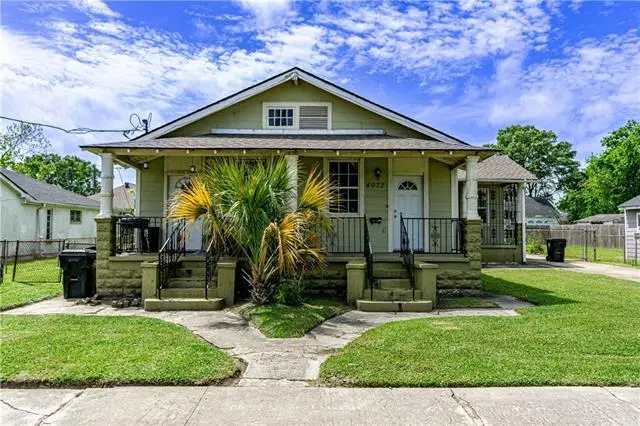
4070-72 St Ferdinand St · New Orleans, LA
Flood risk 8/10 · Major
- FEMA flood zone
- X
- Chance of flooding over 30 yrs
- 0.6%
- Est. flood insurance / yr
- $507 – $1,088
Fire risk 1/10 · Minimal
- Est. fire insurance / yr
- $1,269 – $2,357
Heat risk 10/10 · Severe
- Hot days now (above 107°F)
- 7 days/yr
- Hot days in 30 yrs
- 21 days/yr
Wind risk 10/10 · Severe
- Chance of severe wind over 30 yrs
- 99.0%
Air-quality risk 3/10 · Minor
- Unhealthy air days now
- 3 days/yr
- Unhealthy air days in 30 yrs
- 3 days/yr
Risk factors via First Street. Map © Google.
Why this score? — see what drove the B grade
The composite is a weighted blend of 9 inputs, each scored 0–100. Each bar is that input's sub-score; the figure is the points it added to the 100-point composite (weight × sub-score).
- Cash flow +30.0/30.0
- ARV discount +13.0/15.0
- 1% rule +10.0/10.0
- DSCR +10.0/10.0
- Livability +4.0/5.0
- Condition / age +2.5/5.0
- Rent growth +2.4/5.0
- Schools +1.6/10.0
- Appreciation +0.0/10.0
$185,000
🖨 Deal sheet 📄 Offer letter ✓ Due diligence
Multi-family units
County records classify this as Multi-Family (2-4 Unit). Listing-text estimate: 1 unit. estimate disagrees with records
Listing remarks
Come and check out this fantastic investment opportunity in the heart of New Orleans! This well-maintained double offers two spacious units, each featuring 2 bedrooms and 1 full bathroom. for owner occupants or savvy investors looking to generate rental income. One side is move-in ready and newly renovated with a clean feel that tenants and buyers will appreciate. The other unit is occupied, providing immediate income potential. Both units offer the added convenience of separate driveways, ensuring easy parking and privacy for each side. Whether you're looking to live in one unit and rent the other, or expand your investment portfolio, this double is a must see!
Key facts
- Two spacious units
- Separate driveways
- Double
Tags
Property features AI
Exterior
- Home design: Duplex; 2 units total
- Exterior features: Porch; Composition roof
Interior
- Heating & cooling: Window Unit(s) for cooling; Has heating (type listed as Other)
- Interior features: Window air conditioning units; Heating present (type: Other)
Neighborhood map
What this means for you Summary
Snapshot
- This is a 4-bed/2.0-bath multifamily listed at $185k.
Deal economics
- At list price, monthly cash flow is $932 ($11k/yr) — positive.
- The deal already cash-flows at list — no discount required.
- Meets the 1% rule at list price ($3k rent vs $185k).
- Recommended offer: $179k (3.0% below list) — sets the bar for market timing.
- Cap rate 12.8% vs local median 4.4% in New Orleans — top-decile yield for the area; either an underpriced asset or a hidden risk that comps aren't pricing in. Stress-test before assuming the spread holds.
Location & tenants
- Location reads 81/100 on livability (#3 in LA, #1,383 nationally) — a professional / high-income tenant draw. Strengths: amenities A+, commute A+, health & safety A+; Watch: crime C-, employment D.
- Orleans Parish (urban): math 11% / reading 27% proficiency, ranked #69 of 98 in LA (top 70%) — low school quality limits family demand, transient renter base, plan for 1-2y turnover; 68% free/reduced lunch — lower-income household profile, screen leases tightly.
- Market conditions: Rents soft (-0.2%/yr); 224 active listings in the ZIP; 19 comparable units currently listed for rent nearby; rentals at typical pace (median 24d on market — plan ~3-4 weeks tenant-placement turnaround); lower-income renter base — watch delinquency; 710 units permitted in Orleans Parish in 2024 (244 in 5+ unit buildings).
- At $2,867/mo this rent would consume 82% of the median local household income ($42k/yr) (locally 1767% of renters already pay >50% of income on rent) — very limited rent-growth headroom before tenants either downsize or default.
Forward outlook
- Local home prices are declining (-3.0%/yr); year-one equity from $1k of loan paydown is wiped out by about $6k of value loss. Plan a longer hold.
- Orleans County population projected at +61% by 2050 — long-run rental-demand tailwind backs the buy-and-hold thesis.
- At projected returns (-3.0% appreciation + 0.0% rent growth), your $52k cash investment doubles in ~8 years — after that, you're playing with house money.
Negotiation context
- It's been on market 52 days — a 3% lower offer ($179k) is reasonable based on typical stale-listing flexibility.
Risks & watch-outs
- Watch-outs: flood insurance adds $66/mo.
- Climate carrying-cost: severe flood risk; severe wind risk, 99% chance of damaging wind over 30y; extreme-heat days projected 7→21/yr by 2055 (HVAC capex compounding) — expect insurance premiums to compound above CPI over the hold.
Questions for the listing agent
- It's been on market 52 days. Have you received any prior offers? Is the seller open to a 3% concession, seller financing, or rate buy-down credit?
- Built in 1960 — when were the roof, HVAC, electrical panel, plumbing, and water heater last replaced?
- What's the actual annual flood-insurance premium (NFIP or private), and is the property in a SFHA with mandatory coverage?
- Is there a deadline driving the sale (1031 exchange, divorce, estate, relocation)? That informs how much negotiation room exists.
- What's the average days-on-market for RENTAL listings here right now (not sales)? A rising rental-DOM trend means longer vacancies and softer asking-rent achievability than the comps imply.
- What's the recent tenant-quality profile in this submarket — average credit score on applications, eviction rate, late-payment / NSF rate, and stable-employment percentage? A property-management company in the area should have these aggregated.
- How much new apartment / multifamily construction is in the pipeline within 1–3 miles? Heavy new supply (>2% of stock underway) typically softens rents 12–24 months out; light construction supports rent growth.
Investment metrics
- 1% rule
- 1.55% ✓
- Cap rate
- 12.77%
- Cash-on-cash
- 23.12%
- DSCR
- 2.03
- GRM
- 5.4
CMA / ARV
- ARV (median comp)
- $210,656
- List price
- $185,000
- Delta
- -12.18%
- Verdict
- UNDERPRICED
- Comps
- 20 within 1.0 mi
Show comp detail 6 sales within ~0.75 mi
| Address | Dist | Beds/Ba | Sqft | Sold | Price | $/sf | Match |
|---|---|---|---|---|---|---|---|
| 4915 17 Eastern St | 0.62mi | 4/2.0 | 1,950 (+1%) | 21mo | $217,000 | $111 | 52 |
| 4768 Lafaye St | 0.65mi | 4/2.0 | 1,850 (-4%) | 22mo | $315,000 | $170 | 45 |
| 2483 85 Verbena St | 0.68mi | 4/2.5 | 1,680 (-13%) | 4mo | $237,000 | $141 | 42 |
| 2500-2502 Verbena St | 0.67mi | 4/2.0 | 1,794 (-7%) | 19mo | $191,000 | $106 | 42 |
| 2555 Elder St | 0.72mi | 4/2.0 | 1,785 (-7%) | 18mo | $169,000 | $95 | 40 |
| 2625 27 Sage St | 0.69mi | 4/2.0 | 1,668 (-13%) | 19mo | $302,500 | $181 | 30 |
Match score weights: distance 35% · size 25% · config 20% · recency 20%. Top-matched comps best support the ARV.
Projected returns pro-forma
-3.0% appreciation · 0.0% rent growth · sell at horizon
- IRR
- 10.7%
- Equity multiple
- 1.41×
- Total profit
- $21,027
- Equity at exit
- $27,584
- IRR
- 17.1%
- Equity multiple
- 2.21×
- Total profit
- $62,550
- Equity at exit
- $15,995
Cash invested: $51,800 (down + closing). Projections, not guarantees.
Landlord ↔ Tenant lean methodology
- Overall (STATE)
- 90 Strongly Landlord-Friendly
- State Louisiana
- 90 Strongly Landlord-Friendly · R+12
- County
- — inherits STATE
- City
- — inherits STATE
ZIP-level market 70126
- Home prices YoY
- -17.0%
- Rents YoY
- -0.2%
- Active inventory
- 224
- Price-to-rent
- 10.8×
Monthly cashflow live
- Estimated rent
- $2,867 high interval (Pro) →
- Mortgage (P&I)
- −$970
- Tax from tax record
- −$220 /mo · $2,636/yr
- Insurance
- −$77
- Flood insurance flood zone
- −$66 /mo · $798/yr
- HOA
- −$0
- Vacancy / Maint / Mgmt
- −$602
- Net cashflow
- $932
Break-even live
2-unit breakdown (identical units grouped — click to expand)
| Units | Beds | Baths | Est. rent |
|---|---|---|---|
| 2× units | 2 | 1 | $2,868 |
| #1 | 2 | 1 | $1,434 |
| #2 | 2 | 1 | $1,434 |
| Total (2 units) | $2,867 | ||
UW: 25.0% down · 7.5% · 30yr · 1.5% tax · 5.0% vac · 8.0% maint · 8.0% mgmt
Financing live
Cash to close
- Down payment
- $46,250
- Closing costs
- $5,550
- Reserves months
- —
- Total cash needed
- —
Loan-product check · same deal, 3 products live
Conventional
25% down · 7.5% · 30yr
- Down + closing
- —
- Monthly P&I
- —
- Monthly cashflow
- —
- DSCR
- —
- Eligible?
- —
Personal DTI + credit; lowest rate.
DSCR
20% down · 8.5% · 30yr
- Down + closing
- —
- Monthly P&I
- —
- Monthly cashflow
- —
- DSCR
- —
- Eligible?
- —
No personal income docs; deal must DSCR.
Hard money
10% down · 12.0% · 12mo
- Down + closing
- —
- Monthly P&I
- —
- Monthly cashflow
- —
- DSCR
- —
- Eligible?
- —
Short-term bridge; refi at stabilization.
Rent comps 19 comps
| Address | Beds | Baths | Sqft | Rent | $/sqft | DOM | Units | Dist |
|---|---|---|---|---|---|---|---|---|
| 2647 Myrtle St Unit 2647 New Orleans, LA | 4.0 | 2.0 | 1445 | $2,550 | $1.76 | 43d | 1 | 0.63mi |
| 4767 Lafaye St New Orleans, LA | 3.0 | 2.0 | 1469 | $2,000 | $1.36 | 23d | 1 | 0.63mi |
| 2646 Elder St New Orleans, LA | 3.0 | 3.0 | 1284 | $2,200 | $1.71 | 17d | 1 | 0.67mi |
| 2644 Elder St New Orleans, LA | 3.0 | 3.0 | 1284 | $2,200 | $1.71 | 17d | 1 | 0.67mi |
| 2739 Bay St Unit B New Orleans, LA | 4.0 | 2.0 | 1400 | $1,800 | $1.29 | 20d | 1 | 0.67mi |
| 3570 Gentilly Blvd New Orleans, LA | 3.0 | 2.0 | 2390 | $2,900 | $1.21 | 43d | 1 | 0.73mi |
| 3302 Metropolitan St New Orleans, LA | 4.0 | 2.5 | 1700 | $2,200 | $1.29 | 17d | 1 | 0.78mi |
| 2509 Sage St New Orleans, LA | 3.0 | 1.0 | 1250 | $1,650 | $1.32 | 21d | 1 | 0.81mi |
| 3540 Clermont Dr New Orleans, LA | 3.0 | 2.0 | 1248 | $1,975 | $1.58 | 23d | 1 | 0.94mi |
| 5172 Venus St Unit 5172 New Orleans, LA | 3.0 | 2.5 | 1864 | $2,450 | $1.31 | 23d | 1 | 0.95mi |
| 4722 Mithra St New Orleans, LA | 3.0 | 1.5 | 1295 | $1,600 | $1.24 | 23d | 1 | 0.98mi |
| 5550 Press Dr New Orleans, LA | 3.0 | 2.0 | 1640 | $2,000 | $1.22 | 16d | 1 | 1.02mi |
| 4618 Marigny St New Orleans, LA | 3.0 | 1.0 | 1320 | $1,900 | $1.44 | 23d | 1 | 1.06mi |
| 3907 Elysian Fields Ave New Orleans, LA | 3.0 | 2.0 | 1652 | $3,000 | $1.82 | 23d | 1 | 1.09mi |
| 5747 Pauline Dr New Orleans, LA | 3.0 | 1.0 | 1300 | $1,400 | $1.08 | 11d | 1 | 1.35mi |
| 2458 Athis St New Orleans, LA | 4.0 | 2.0 | 1530 | $2,200 | $1.44 | 23d | 1 | 1.36mi |
| 3515 Saint Anthony Ave New Orleans, LA | 3.0 | 2.0 | 1366 | $2,500 | $1.83 | 23d | 1 | 1.44mi |
| 5925 Pauline Dr New Orleans, LA | 3.0 | 2.0 | 1566 | $2,325 | $1.48 | 16d | 1 | 1.44mi |
| 2331 Feliciana St New Orleans, LA | 3.0 | 2.0 | 1250 | $1,850 | $1.48 | 23d | 1 | 1.46mi |
Listing history 15 events
-
2026-06-18days on market $185,000 Active 52 DOM
-
2026-06-17days on market $185,000 Active 51 DOM
-
2026-06-16days on market $185,000 Active 50 DOM
-
2026-06-15days on market $185,000 Active 49 DOM
-
2026-06-13days on market $185,000 Active 47 DOM
-
2026-06-10days on market $185,000 Active 44 DOM
-
2026-06-09days on market $185,000 Active 43 DOM
-
2026-06-08days on market $185,000 Active 42 DOM
-
2026-06-07days on market $185,000 Active 41 DOM
-
2026-06-05days on market $185,000 Active 38 DOM
-
2026-06-03days on market $185,000 Active 37 DOM
-
2026-06-02days on market $185,000 Active 36 DOM
-
2026-06-01days on market $185,000 Active 35 DOM
-
2026-05-31days on market $185,000 Active 34 DOM
-
2026-04-27$185,000 Active 670-char remark
ⓘ Source: listings_history table (triggers on properties + properties_extension) + one-shot
backfill from property_details.listing_events for pre-trigger history.
Tax reassessment forecast LA · Resets to sale price
- Current annual tax
- $2,636 · $220/mo
- Projected year-2 tax
- $2,636 · $220/mo
- Expected delta
- $0/yr ($0/mo · 0.0%)
ⓘ Screening estimate from a state-policy table — verify with the county assessor before closing.
Climate risk First Street
- Flood 8/10 Severe FEMA zone X · 60% chance over 30 yrs
- Wildfire 1/10 Low
- Heat 10/10 Extreme 7 d/yr ≥107°F today · 21 d/yr by 30 yrs out
- Wind 10/10 Extreme 99% chance of damaging wind over 30 yrs
- Air quality 3/10 Moderate 3 unhealthy d/yr today · 3 by 30 yrs out
Nearby sold comps map
Loading sold comps map…
Walkable amenities ~0.75 mi
Loading nearby amenities…
Taxation est. · year 1
- Rental income
- $34,404
- − Mortgage interest
- −$10,363
- − Property taxes
- −$2,636
- − Insurance
- −$1,722
- − Repairs & maintenance
- −$2,752
- − Management
- −$2,752
- − Depreciation
- −$5,382
- Taxable income
- $8,796
- Est. tax owed @ 24.0%
- −$2,111
- After-tax cash flow
- $9,067/yr
For passive investors: Depreciation is non-cash, so a rental often shows a tax loss while cash-flowing — sheltering income. Rental losses are passive: they offset passive income freely, and up to $25,000/yr can offset ordinary (W-2) income if you actively participate and your MAGI is under $100k (phasing out to $0 by $150k); unused losses carry forward. On sale, claimed depreciation is recaptured at up to 25%, and gains may owe capital-gains tax (a 1031 exchange can defer both). Figures are a year-1 estimate at your 24.0% rate — not tax advice; consult a CPA.
Schools (NCES district)
- District
- Orleans Parish
- NCES district ID
- 2201170
- Math proficiency
- 11% ▼ -52.00%
- Reading proficiency
- 27% ▼ -46.00%
- Median HH income
- $37,011
- Composite
- 15.78/100
- National rank
- #9271
- State rank
- #69 of 98 in LA
Livability — New Orleans
- Score
- 81/100
- State rank
- #3
- US rank
- #1383
Category grades
Schools grade is shown separately in the Schools card above.
Census & demographics
- Census place
- New Orleans, LA
- County
- Orleans Parish · 338,817 people
- City population
- 338,817
- Metro
- New Orleans-Metairie, LA
- Population (ZIP)
- 27,047
- Household income
- $41,709
- Rent vs Own
- Severe rent burden
- 1767.0
Population outlook (Orleans County) Hauer SSP2
- Today (2025)
- 513,025 people
- By 2030
- 575,781 · +12.2%
- By 2040
- 700,174 · +36.5%
- By 2050
- 826,541 · +61.1%
- By 2075
- 1,123,374 · +119.0%
- By 2100
- 1,355,609 · +164.2%
Race, ethnicity, and origin ACS 2023
- Neighborhood character
- Predominantly Black (85%)
- Race & ethnicity
- Black 85% Hispanic / Latino 6% Two or more races 5% White 5%
- Hispanic origin (detail)
- Common ancestry
- Lithuanian 1% Italian 1%
- Foreign-born
- 4% · Canada, Vietnam
- Languages at home
- 94% English-only · Spanish 5% Other Indo-European 1%
Political lean MEDSL · Orleans
- 2024 margin
- Solid D (+67.0) · D 82.2% · R 15.2% · Other 2.7%
- 2008→2024 swing
- +6.7pp toward D · 2008: 60.3pp · 2024: 67.0pp
- All cycles
- 2024: D+67.0 2020: D+68.2 2016: D+66.2 2012: D+62.5 2008: D+60.3
Not yet ingested
- Civics
- —
Market trends
- HPI YoY
- ▼ -36.35%
- Current HPI
- 177.355
- Rent YoY
- ▼ -0.24%
- Metro
- New Orleans-Metairie, LA
- State GDP YoY
- ▲ 3.29%
- F500 in state
- 10
Industry mix (Fortune 500 HQ in LA)
| Industry | F500 HQs | Revenue |
|---|---|---|
| Telecommunications | 2 | $23B |
|
||
| Utilities | 1 | $12B |
|
||
| Wholesale / Distribution | 1 | $5B |
|
||
| Advertising | 1 | $2B |
|
||
Price history
1 event — show timeline
- 2026-04-27 Listed $185,000 AcadianaMLS
Property tax history
+7.4%/yrLatest (2026): $2,636 · +1.1% YoY. Source: county tax records.
Cash-flow waterfall
monthlySold comps — $/sqft
last 12 mo · ≤1 miLoading sold comps…