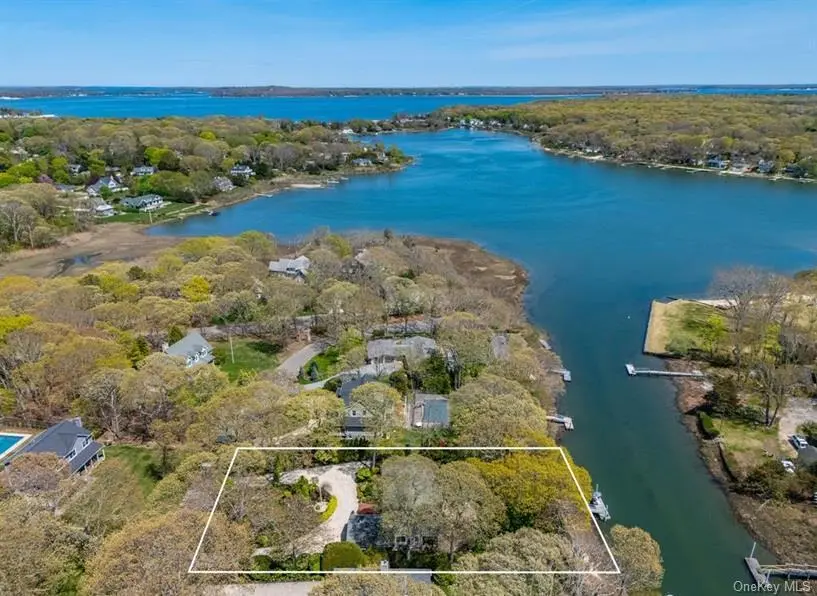
2300 Glenn Rd · Southold, NY
Flood risk 5/10 · Moderate
- FEMA flood zone
- X (shaded)
- Chance of flooding over 30 yrs
- 0.51%
- Est. flood insurance / yr
- $473 – $860
Fire risk 1/10 · Minimal
- Est. fire insurance / yr
- $691 – $1,283
Heat risk 5/10 · Moderate
- Hot days now (above 90°F)
- 7 days/yr
- Hot days in 30 yrs
- 19 days/yr
Wind risk 8/10 · Major
- Chance of severe wind over 30 yrs
- 80.0%
Air-quality risk 3/10 · Minor
- Unhealthy air days now
- 2 days/yr
- Unhealthy air days in 30 yrs
- 3 days/yr
Risk factors via First Street. Map © Google.
Why this score? — see what drove the C grade
The composite is a weighted blend of 9 inputs, each scored 0–100. Each bar is that input's sub-score; the figure is the points it added to the 100-point composite (weight × sub-score).
- Cash flow +25.0/30.0
- DSCR +8.1/10.0
- ARV discount +7.5/15.0
- 1% rule +5.6/10.0
- Schools +4.8/10.0
- Livability +3.4/5.0
- Rent growth +2.5/5.0
- Condition / age +2.5/5.0
- Appreciation +0.0/10.0
$1,975,000
🖨 Deal sheet (PDF) 📄 Offer letter ✓ Due diligence
Listing remarks
Located in one of Southold’s most coveted locations, this waterfront oasis offers peace, privacy, and stunning views of Goose Creek. Surrounded by professionally designed and meticulously maintained landscaping, this property exudes tranquility and natural beauty. The home features a spacious and thoughtfully designed layout with wood floors throughout. The updated kitchen is a chef’s dream—complete with cherry cabinets, quartz countertops, high-end appliances, and limestone flooring. The large living room, anchored by a charming wood-burning fireplace, is perfect for relaxing or entertaining. Enjoy serene water views from multiple rooms and take full advantage of the priv
Key facts
- Waterfront oasis
- Private dock
- Ensuite bath
Tags
Property features AI
Exterior
- Parking: Attached private garage; 2 garage spaces
- Utilities: Cesspool sewer; Utilities: see remarks
- Home design: Single family residence
- Construction: Cedar exterior
- Exterior features: Cedar construction; Patio; Porch; Front yard; Garden; Landscaped grounds; Front and rear sprinklers; Waterfront with views
Interior
- Kitchen: Dishwasher; Refrigerator
- Bedrooms: Bedroom on the first floor
- Bathrooms: 3 full bathrooms
- Heating & cooling: Hot water heating (oil); Central air conditioning
- Interior features: First-floor bedroom; First-floor full bath; Ceiling fans; Eat-in kitchen; Entrance foyer; Main bedroom on ground floor; Partially finished basement; Full attic; 7 total rooms
- Laundry & utility: Washer; Dryer
Neighborhood map
What this means for you Summary
Snapshot
- This is a 3-bed/3.0-bath single-family listed at $1.98M.
Deal economics
- At list price, monthly cash flow is $4k ($51k/yr) — positive.
- The deal already cash-flows at list — no discount required.
- Meets the 1% rule at list price ($21k rent vs $1.98M).
- Cap rate 8.9% vs local median 6.9% in Southold — meaningfully above typical; check what's discounted (condition, days-on-market, listing class) to confirm the premium yield is real.
Location & tenants
- Location reads 67/100 on livability (#583 in NY) — a middle-class / working-renter tenant base. Strengths: crime A+, employment A+, health & safety B+; Watch: amenities F, commute F, cost of living F.
- Southold Union Free School District (town): math 46% / reading 59% proficiency, ranked #298 of 590 in NY (top 50%) — acceptable for families but not a draw, mixed tenant base, ~2y average lease; only 17% free/reduced lunch — higher-income household profile.
- Zoned schools: Southold Elementary School (math 37% / reading 62%, grade D, #1,085 of 2,108 statewide, top 56%, 317 students, 35% FRL); Southold Junior-Senior High School (math 52% / reading 52%, grade D+, #946 of 1,100 statewide, top 88%, 380 students, 40% FRL) — zoned schools average 38% FRL vs 17% district-wide (21 pts higher); higher-poverty schools than district average — tighter screening recommended.
- Market conditions: 79 active listings in the ZIP; 5 comparable units currently listed for rent nearby; rentals lingering (median 46d on market — plan ~5-8 weeks vacancy on turnover, expect pricing pressure); 60% of comp listings sitting > 30 days — soft ceiling on asking rent; 1,366 units permitted in Suffolk County in 2024 (216 in 5+ unit buildings).
Forward outlook
- Local home prices are declining (-3.0%/yr); year-one equity from $14k of loan paydown is wiped out by about $59k of value loss. Plan a longer hold.
- Suffolk County population projected to shrink 5% by 2050 — rents likely to lag national; underwrite the cash flow, not the appreciation.
Negotiation context
- Only 1 days on market — expect competitive offers; lowballing is unlikely to land.
- 3 sale attempts with the ask held roughly flat each time — persistent listings suggest the price (not the market) is what's stuck; bring a comps-based counter.
- Current owner paid $750k; list at $1.98M implies a 163% gain — meaningful room to come down on a strong offer.
Risks & watch-outs
- Climate carrying-cost: moderate flood risk; severe wind risk, 80% chance of damaging wind over 30y; extreme-heat days projected 7→19/yr by 2055 (HVAC capex compounding) — expect insurance premiums to compound above CPI over the hold.
Questions for the listing agent
- Built in 1968 — when were the roof, HVAC, electrical panel, plumbing, and water heater last replaced?
- Is there a deadline driving the sale (1031 exchange, divorce, estate, relocation)? That informs how much negotiation room exists.
- Schools are A-rated — typically a magnet for longer-tenancy family renters. What's the average tenant stay here, and is there a school-zone premium baked into asking?
- What's the average days-on-market for RENTAL listings here right now (not sales)? A rising rental-DOM trend means longer vacancies and softer asking-rent achievability than the comps imply.
- What's the recent tenant-quality profile in this submarket — average credit score on applications, eviction rate, late-payment / NSF rate, and stable-employment percentage? A property-management company in the area should have these aggregated.
- How much new for-sale + rental construction is in the pipeline within 1–3 miles? Heavy new supply typically softens prices + rents 12–24 months out; constrained supply supports both.
Investment metrics
- 1% rule
- 1.06% ✓
- Cap rate
- 8.90%
- Cash-on-cash
- 9.29%
- DSCR
- 1.41
- GRM
- 7.9
CMA / ARV
- ARV (on-the-fly)
- $1,120,000
- Comps found
- 7
Show comp detail 7 sales within ~0.75 mi
| Address | Dist | Beds/Ba | Sqft | Sold | Price | $/sf | Match |
|---|---|---|---|---|---|---|---|
| 205 Pine Ave | 0.50mi | 4/3.0 (+1) | 2,280 (-9%) | 10mo | $1,205,000 | $529 | 49 |
| 2865 S Harbor Rd | 0.57mi | 3/3.0 | 2,250 (-10%) | 11mo | $1,150,000 | $511 | 47 |
| 730 Pine Neck Rd | 0.44mi | 4/2.0 (+1) | 2,200 (-12%) | 7mo | $985,000 | $448 | 45 |
| 555 Oakwood Dr | 0.62mi | 4/2.5 (+1) | 2,300 (-8%) | 11mo | $899,000 | $391 | 42 |
| 2300 Pine Neck Rd | 0.42mi | 4/2.0 (+1) | 2,300 (-8%) | 20mo | $915,000 | $398 | 41 |
| 8355 Main Bayview Rd | 0.71mi | 4/3.0 (+1) | 2,662 (+6%) | 16mo | $1,800,000 | $676 | 38 |
| 355 Cedar Dr | 0.56mi | 3/2.0 | 2,230 (-11%) | 23mo | $920,000 | $413 | 32 |
Match score weights: distance 35% · size 25% · config 20% · recency 20%. Top-matched comps best support the ARV.
Projected returns pro-forma
-3.0% appreciation · 3.0% rent growth · sell at horizon
- IRR
- -2.3%
- Equity multiple
- 0.91×
- Total profit
- $-47,839
- Equity at exit
- $294,479
- IRR
- 7.4%
- Equity multiple
- 1.56×
- Total profit
- $307,227
- Equity at exit
- $170,762
Cash invested: $553,000 (down + closing). Projections, not guarantees.
Landlord ↔ Tenant lean methodology
- Overall (STATE)
- 15 Strongly Tenant-Friendly
- State New York
- 15 Strongly Tenant-Friendly · D+10
- County
- — inherits STATE
- City
- — inherits STATE
ZIP-level market 11971
- Home prices YoY
- -15.8%
- Active inventory
- 79
- Price-to-rent
- 7.9×
Monthly cashflow live
- Estimated rent
- $20,853 high interval (Pro) →
- Mortgage (P&I)
- −$10,357
- Tax from tax record
- −$1,011 /mo · $12,136/yr
- Insurance
- −$823
- HOA
- −$0
- Vacancy / Maint / Mgmt
- −$4,379
- Net cashflow
- $4,283
Break-even live
Sensitivity live
| Price | -10% $5,401 | -5% $4,842 | +0% $4,283 | +5% $3,724 | +10% $3,165 |
|---|---|---|---|---|---|
| Rent | -10% $2,635 | -5% $3,459 | +0% $4,283 | +5% $5,107 | +10% $5,930 |
| Rate | -1.0pp $5,277 | -0.5pp $4,785 | base $4,283 | +0.5pp $3,771 | +1.0pp $3,250 |
UW: 25.0% down · 7.5% · 30yr · 1.5% tax · 5.0% vac · 8.0% maint · 8.0% mgmt
Financing live
Cash to close
- Down payment
- $493,750
- Closing costs
- $59,250
- Reserves months
- —
- Total cash needed
- —
Loan-product check · same deal, 3 products live
Conventional
25% down · 7.5% · 30yr
- Down + closing
- —
- Monthly P&I
- —
- Monthly cashflow
- —
- DSCR
- —
- Eligible?
- —
Personal DTI + credit; lowest rate.
DSCR
20% down · 8.5% · 30yr
- Down + closing
- —
- Monthly P&I
- —
- Monthly cashflow
- —
- DSCR
- —
- Eligible?
- —
No personal income docs; deal must DSCR.
Hard money
10% down · 12.0% · 12mo
- Down + closing
- —
- Monthly P&I
- —
- Monthly cashflow
- —
- DSCR
- —
- Eligible?
- —
Short-term bridge; refi at stabilization.
Rent comps 5 comps
| Address | Beds | Baths | Sqft | Rent | $/sqft | DOM | Units | Dist |
|---|---|---|---|---|---|---|---|---|
| 110 Sleepy Hollow Ln Southold, NY | 4.0 | 3.0 | 2900 | $25,000 | $8.62 | 45d | 1 | 0.18mi |
| 1854 N Bayview Rd Southold, NY | 2.0 | 2.5 | 1750 | $15,000 | $8.57 | 45d | 1 | 0.68mi |
| 215 Northfield Ln Southold, NY | 4.0 | 3.0 | 2300 | $13,000 | $5.65 | 20d | 1 | 0.98mi |
| 580 Gin Ln Southold, NY | 4.0 | 4.0 | 3585 | $20,000 | $5.58 | 26d | 1 | 1.19mi |
| 1265 Brigantine Dr Southold, NY | 3.0 | 2.0 | 1750 | $9,000 | $5.14 | 45d | 1 | 1.33mi |
Listing history 2 events
-
2026-06-12remarks 681-char remark
-
2026-06-12$1,975,000 Pending 1 DOM
ⓘ Source: listings_history table (triggers on properties + properties_extension) + one-shot
backfill from property_details.listing_events for pre-trigger history.
Tax reassessment forecast NY · Partial reset (capped growth)
- Current annual tax
- $12,136 · $1,011/mo
- Projected year-2 tax
- $22,756 · $1,896/mo
- Expected delta
- +$10,621/yr (+$885/mo · 87.5%)
ⓘ Screening estimate from a state-policy table — verify with the county assessor before closing.
Climate risk First Street
- Flood 5/10 Major FEMA zone X (shaded) · 51% chance over 30 yrs
- Wildfire 1/10 Low
- Heat 5/10 Major 7 d/yr ≥90°F today · 19 d/yr by 30 yrs out
- Wind 8/10 Severe 80% chance of damaging wind over 30 yrs
- Air quality 3/10 Moderate 2 unhealthy d/yr today · 3 by 30 yrs out
Nearby sold comps map
Loading sold comps map…
Walkable amenities ~0.75 mi
Loading nearby amenities…
Taxation est. · year 1
- Rental income
- $250,241
- − Mortgage interest
- −$110,631
- − Property taxes
- −$12,136
- − Insurance
- −$9,875
- − Repairs & maintenance
- −$20,019
- − Management
- −$20,019
- − Depreciation
- −$57,455
- Taxable income
- $20,106
- Est. tax owed @ 24.0%
- −$4,826
- After-tax cash flow
- $46,569/yr
For passive investors: Depreciation is non-cash, so a rental often shows a tax loss while cash-flowing — sheltering income. Rental losses are passive: they offset passive income freely, and up to $25,000/yr can offset ordinary (W-2) income if you actively participate and your MAGI is under $100k (phasing out to $0 by $150k); unused losses carry forward. On sale, claimed depreciation is recaptured at up to 25%, and gains may owe capital-gains tax (a 1031 exchange can defer both). Figures are a year-1 estimate at your 24.0% rate — not tax advice; consult a CPA.
Schools (NCES district)
- District
- Southold Union Free School District
- NCES district ID
- 3627620
- Math proficiency
- 46% ▼ -10.00%
- Reading proficiency
- 59% ▲ 6.00%
- Median HH income
- $78,622
- Composite
- 47.54/100
- National rank
- #2269
- State rank
- #298 of 590 in NY
Livability — Southold
- Score
- 67/100
- State rank
- #583
- US rank
- #10545
Category grades
Schools grade is shown separately in the Schools card above.
Census & demographics
- Census place
- Southold, NY
- City population
- 6,507
- Population (ZIP)
- 6,507
Population outlook (Suffolk County) Hauer SSP2
- Today (2025)
- 1,505,262 people
- By 2030
- 1,498,318 · -0.5%
- By 2040
- 1,471,101 · -2.3%
- By 2050
- 1,424,848 · -5.3%
- By 2075
- 1,337,157 · -11.2%
- By 2100
- 1,217,720 · -19.1%
Race, ethnicity, and origin ACS 2023
- Neighborhood character
- Predominantly White (78%)
- Race & ethnicity
- White 78% Hispanic / Latino 14% Two or more races 5% Asian 4%
- Hispanic origin (detail)
- Mexican 3% Puerto Rican 1% Dominican 3%
- Common ancestry
- Romanian 6% Italian 2% Slovak 2%
- Foreign-born
- 14% · Canada, China, Dominican Republic
- Languages at home
- 83% English-only · Spanish 11% Russian/Polish/Slavic 2% Other Indo-European 2%
Political lean MEDSL · Suffolk
- 2024 margin
- Lean R (+10.0) · D 45.0% · R 55.0%
- 2008→2024 swing
- -16.0pp toward R · 2008: 6.0pp · 2024: -10.0pp
- All cycles
- 2024: R+10.0 2020: R+0.0 2016: R+8.2 2012: D+2.9 2008: D+6.0
Not yet ingested
- Civics
- —
Market trends
- HPI YoY
- ▼ -74.14%
- Current HPI
- 396.5481
- Rent YoY
- —
- Metro
- —
- State GDP YoY
- ▲ 2.60%
- F500 in state
- 92
Industry mix (Fortune 500 HQ in NY)
| Industry | F500 HQs | Revenue |
|---|---|---|
| Financial Services | 10 | $950B |
|
||
| Consumer Goods | 9 | $162B |
|
||
| Insurance | 4 | $225B |
|
||
| Telecommunications | 2 | $144B |
|
||
| Pharmaceuticals | 2 | $112B |
|
||
| Media / Entertainment | 2 | $69B |
|
||
Price history
+630.1% since first listed11 events — show timeline
- 2026-06-12 Pending — OneKey® MLS as Distributed by MLS Grid
- 2026-06-10 Listed $1,975,000 OneKey® MLS as Distributed by MLS Grid
- 2025-12-01 Listing Removed — OneKey® MLS as Distributed by MLS Grid
- 2025-09-10 Price Changed $1,975,000 OneKey® MLS as Distributed by MLS Grid
- 2025-08-04 Price Changed $2,180,000 OneKey® MLS as Distributed by MLS Grid
- 2025-06-09 Relisted — OneKey® MLS as Distributed by MLS Grid
- 2025-05-14 Listed $2,295,000 OneKey® MLS as Distributed by MLS Grid
- 2009-06-25 Sold (Public Records) $750,000 Public Records
- 1996-09-12 Sold (Public Records) $320,000 Public Records
- 1993-10-19 Sold (Public Records) $265,000 Public Records
- 1986-08-07 Sold (Public Records) $270,500 Public Records
Property tax history
+1.4%/yrLatest (2025): $12,136 · +0.0% YoY. Source: county tax records.
Cash-flow waterfall
monthlySold comps — $/sqft
last 12 mo · ≤1 miLoading sold comps…