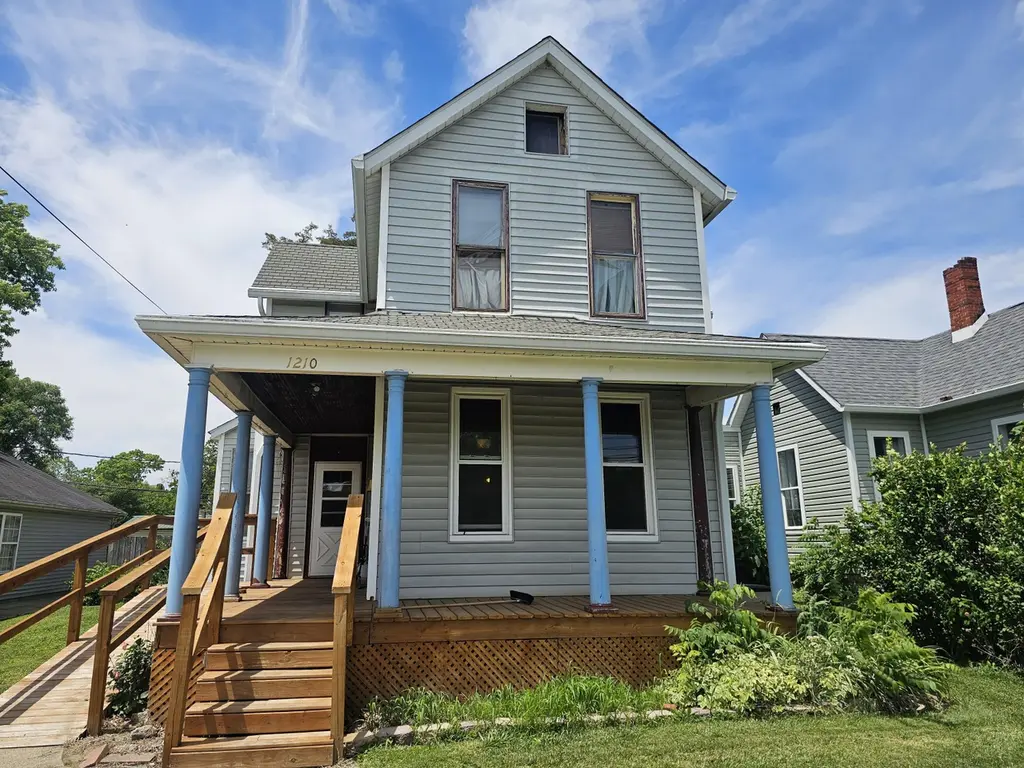
1210 S 5th St · Lafayette, IN
Flood risk 1/10 · Minimal
- FEMA flood zone
- X (unshaded)
- Chance of flooding over 30 yrs
- 0.0%
- Est. flood insurance / yr
- $473 – $860
Fire risk 1/10 · Minimal
- Est. fire insurance / yr
- $717 – $1,331
Heat risk 3/10 · Minor
- Hot days now (above 102°F)
- 7 days/yr
- Hot days in 30 yrs
- 18 days/yr
Wind risk 2/10 · Minimal
- Chance of severe wind over 30 yrs
- —
Air-quality risk 2/10 · Minimal
- Unhealthy air days now
- 1 days/yr
- Unhealthy air days in 30 yrs
- 2 days/yr
Risk factors via First Street. Map © Google.
Why this score? — see what drove the C+ grade
The composite is a weighted blend of 9 inputs, each scored 0–100. Each bar is that input's sub-score; the figure is the points it added to the 100-point composite (weight × sub-score).
- Cash flow +23.2/30.0
- ARV discount +15.0/15.0
- DSCR +7.5/10.0
- 1% rule +5.1/10.0
- Rent growth +3.8/5.0
- Livability +3.7/5.0
- Schools +2.6/10.0
- Condition / age +2.5/5.0
- Appreciation +0.0/10.0
$180,000
🖨 Deal sheet (PDF) 📄 Offer letter ✓ Due diligence
Listing remarks
Opportunity awaits his 4-bedroom, 2-bath home with over 2,000 square feet and is ready for someone with vision to bring it back to life. Featuring spacious living areas, a basement, and 1 car detached garage, this property has the space and layout to create something truly special. The home does need repairs and updating, making it a great fit for investors, flippers, or buyers looking for a renovation project with upside potential. With some work and creativity, this property could be transformed into a beautiful home or profitable investment. Don't miss your chance to restore the charm and value of this Lafayette property.
Key facts
- 6,500 sq ft lot
- Garage
- Built 1900
Property features AI
Exterior
- Parking: Detached garage; 1 garage space
- Utilities: Public water; Public sewer
- Home design: Two-story house; Built in 1900
- Construction: Unfinished basement
- Exterior features: Neighborhood view
Interior
- Kitchen: Gas cooktop; Refrigerator
- Bedrooms: Primary bedroom; Bedroom 2; Bedroom 3; Bedroom 4
- Bathrooms: 2 full bathrooms
- Heating & cooling: Forced air heating; Central air conditioning; Ceiling fans
- Interior features: Ceiling fans
- Laundry & utility: Unfinished basement (utility/storage space)
Neighborhood map
What this means for you Summary
Snapshot
- This is a 4-bed/1.0-bath single-family listed at $180k.
Deal economics
- At list price, monthly cash flow is $326 ($4k/yr) — positive.
- The deal already cash-flows at list — no discount required.
- Meets the 1% rule at list price ($2k rent vs $180k).
- Recommended offer: $177k (1.5% below list) — sets the bar for market timing.
- Cap rate 8.5% vs local median 4.2% in Lafayette — top-decile yield for the area; either an underpriced asset or a hidden risk that comps aren't pricing in. Stress-test before assuming the spread holds.
Location & tenants
- Location reads 74/100 on livability (#68 in IN, #4,374 nationally) — a middle-class / working-renter tenant base. Strengths: cost of living A+, housing A+, health & safety A+; Watch: schools D+, amenities D+, employment D+.
- Lafayette School Corporation (urban): math 29% / reading 34% proficiency, ranked #235 of 301 in IN (top 78%) — families likely to look elsewhere, expect single-tenant / working-renter base with shorter leases; 63% free/reduced lunch — lower-income household profile, screen leases tightly.
- Market conditions: Rents rising fast (+5.1%/yr); 219 active listings in the ZIP; 3 comparable units currently listed for rent nearby; rentals at typical pace (median 15d on market — plan ~3-4 weeks tenant-placement turnaround); 1,341 units permitted in Tippecanoe County in 2024 (869 in 5+ unit buildings).
- This rent runs 33% of the median local income ($66k/yr) — at the standard rent-burdened threshold; future hikes will face affordability resistance.
Forward outlook
- Local home prices are declining (-3.0%/yr); year-one equity from $1k of loan paydown is wiped out by about $5k of value loss. Plan a longer hold.
- Tippecanoe County population projected at +41% by 2050 — long-run rental-demand tailwind backs the buy-and-hold thesis.
- At projected returns (-3.0% appreciation + 5.1% rent growth), your $50k cash investment doubles in ~10 years — after that, you're playing with house money.
Negotiation context
- It's been on market 18 days — a 2% lower offer ($177k) is reasonable based on typical stale-listing flexibility.
Risks & watch-outs
- Watch-outs: built in 1900 — expect roof / HVAC / electrical / plumbing capex.
Questions for the listing agent
- Built in 1900 — when were the roof, HVAC, electrical panel, plumbing, and water heater last replaced?
- Is there a deadline driving the sale (1031 exchange, divorce, estate, relocation)? That informs how much negotiation room exists.
- Schools are D-rated, which usually means shorter tenancies and higher turnover. Who's the typical renter profile here, and what's been the actual vacancy rate?
- Crime grade is F in this area — have there been break-ins, vandalism, or insurance claims at this property in the last 3 years? What carrier currently insures it and at what premium?
- What's the average days-on-market for RENTAL listings here right now (not sales)? A rising rental-DOM trend means longer vacancies and softer asking-rent achievability than the comps imply.
- What's the recent tenant-quality profile in this submarket — average credit score on applications, eviction rate, late-payment / NSF rate, and stable-employment percentage? A property-management company in the area should have these aggregated.
- How much new for-sale + rental construction is in the pipeline within 1–3 miles? Heavy new supply typically softens prices + rents 12–24 months out; constrained supply supports both.
Investment metrics
- 1% rule
- 1.01% ✓
- Cap rate
- 8.47%
- Cash-on-cash
- 7.77%
- DSCR
- 1.35
- GRM
- 8.3
CMA / ARV
- ARV (on-the-fly)
- $321,450
- Comps found
- 12
Show comp detail 12 sales within ~0.75 mi
| Address | Dist | Beds/Ba | Sqft | Sold | Price | $/sf | Match |
|---|---|---|---|---|---|---|---|
| 1607 S 4th St | 0.25mi | 4/1.0 | 2,240 (+4%) | 4mo | $275,000 | $123 | 78 |
| 814 Highland Ave | 0.31mi | 4/2.5 | 2,176 (+2%) | 4mo | $520,000 | $239 | 74 |
| 506 Romig St | 0.63mi | 3/1.0 (-1) | 2,144 (0%) | 0mo | $30,000 | $14 | 65 |
| 220 Hickory St | 0.13mi | 3/2.0 (-1) | 1,928 (-10%) | 5mo | $200,000 | $104 | 64 |
| 1111 S 14th St | 0.57mi | 3/2.0 (-1) | 2,132 (-0%) | 4mo | $275,000 | $129 | 60 |
| 1209 King St | 0.50mi | 4/1.5 | 1,904 (-11%) | 2mo | $200,000 | $105 | 55 |
| 1501 El Prado Ave | 0.69mi | 3/2.0 (-1) | 2,104 (-2%) | 4mo | $250,000 | $119 | 53 |
| 1314 Oak Ave | 0.60mi | 4/2.5 | 2,297 (+7%) | 2mo | $345,000 | $150 | 52 |
| 2065 S 9th St | 0.63mi | 3/1.5 (-1) | 1,960 (-8%) | 0mo | $297,000 | $152 | 49 |
| 599 S 3rd St | 0.43mi | 3/3.0 (-1) | 1,932 (-10%) | 3mo | $350,000 | $181 | 48 |
| 1400 Adams St | 0.61mi | 4/3.0 | 2,348 (+10%) | 1mo | $376,000 | $160 | 47 |
| 1429 Stanforth Ave | 0.66mi | 3/2.5 (-1) | 1,883 (-12%) | 3mo | $295,000 | $157 | 36 |
Match score weights: distance 35% · size 25% · config 20% · recency 20%. Top-matched comps best support the ARV.
Projected returns pro-forma
-3.0% appreciation · 5.12% rent growth · sell at horizon
- IRR
- -2.3%
- Equity multiple
- 0.91×
- Total profit
- $-4,488
- Equity at exit
- $26,839
- IRR
- 9.4%
- Equity multiple
- 1.78×
- Total profit
- $39,536
- Equity at exit
- $15,563
Cash invested: $50,400 (down + closing). Projections, not guarantees.
Landlord ↔ Tenant lean methodology
- Overall (STATE)
- 90 Strongly Landlord-Friendly
- State Indiana
- 90 Strongly Landlord-Friendly · R+11
- County
- — inherits STATE
- City
- — inherits STATE
ZIP-level market 47905
- Home prices YoY
- -33.2%
- Rents YoY
- 5.1%
- Active inventory
- 219
- Price-to-rent
- 8.3×
Monthly cashflow live
- Estimated rent
- $1,811 medium interval (Pro) →
- Mortgage (P&I)
- −$944
- Tax from tax record
- −$85 /mo · $1,025/yr
- Insurance
- −$75
- HOA
- −$0
- Vacancy / Maint / Mgmt
- −$380
- Net cashflow
- $326
Break-even live
Sensitivity live
| Price | -10% $428 | -5% $377 | +0% $326 | +5% $276 | +10% $225 |
|---|---|---|---|---|---|
| Rent | -10% $183 | -5% $255 | +0% $326 | +5% $398 | +10% $470 |
| Rate | -1.0pp $417 | -0.5pp $372 | base $326 | +0.5pp $280 | +1.0pp $232 |
UW: 25.0% down · 7.5% · 30yr · 1.5% tax · 5.0% vac · 8.0% maint · 8.0% mgmt
Financing live
Cash to close
- Down payment
- $45,000
- Closing costs
- $5,400
- Reserves months
- —
- Total cash needed
- —
Loan-product check · same deal, 3 products live
Conventional
25% down · 7.5% · 30yr
- Down + closing
- —
- Monthly P&I
- —
- Monthly cashflow
- —
- DSCR
- —
- Eligible?
- —
Personal DTI + credit; lowest rate.
DSCR
20% down · 8.5% · 30yr
- Down + closing
- —
- Monthly P&I
- —
- Monthly cashflow
- —
- DSCR
- —
- Eligible?
- —
No personal income docs; deal must DSCR.
Hard money
10% down · 12.0% · 12mo
- Down + closing
- —
- Monthly P&I
- —
- Monthly cashflow
- —
- DSCR
- —
- Eligible?
- —
Short-term bridge; refi at stabilization.
Rent comps 3 comps
| Address | Beds | Baths | Sqft | Rent | $/sqft | DOM | Units | Dist |
|---|---|---|---|---|---|---|---|---|
| 6 S 4th St Lafayette, IN | 1.0–3.0 | 1.0–3.0 | 1102 | $1,649 | $1.50 | 14d | 1 | 0.84mi |
| 224 S 14th St Lafayette, IN | 4.0 | 2.0 | 1900 | $1,810 | $0.95 | 14d | 1 | 0.85mi |
| 1213 S 19th St Lafayette, IN | 3.0 | 2.0 | 1484 | $1,900 | $1.28 | 14d | 1 | 0.88mi |
Listing history 14 events
-
2026-06-19days on market $180,000 Active 18 DOM
-
2026-06-18days on market $180,000 Active 17 DOM
-
2026-06-17days on market $180,000 Active 16 DOM
-
2026-06-16days on market $180,000 Active 15 DOM
-
2026-06-15days on market $180,000 Active 14 DOM
-
2026-06-14days on market $180,000 Active 12 DOM
-
2026-06-13days on market $180,000 Active 11 DOM
-
2026-06-10days on market $180,000 Active 9 DOM
-
2026-06-09days on market $180,000 Active 8 DOM
-
2026-06-08days on market $180,000 Active 7 DOM
-
2026-06-07days on market $180,000 Active 6 DOM
-
2026-06-03price $180,000 Active 1 DOM
-
2026-06-02remarks 632-char remark
-
2026-06-02$108,000 Active 1 DOM
ⓘ Source: listings_history table (triggers on properties + properties_extension) + one-shot
backfill from property_details.listing_events for pre-trigger history.
Tax reassessment forecast IN · Partial reset (capped growth)
- Current annual tax
- $1,025 · $85/mo
- Projected year-2 tax
- $1,277 · $106/mo
- Expected delta
- +$253/yr (+$21/mo · 24.6%)
ⓘ Screening estimate from a state-policy table — verify with the county assessor before closing.
Climate risk First Street
- Flood 1/10 Low FEMA zone X (unshaded) · 0% chance over 30 yrs
- Wildfire 1/10 Low
- Heat 3/10 Moderate 7 d/yr ≥102°F today · 18 d/yr by 30 yrs out
- Wind 2/10 Low
- Air quality 2/10 Low 1 unhealthy d/yr today · 2 by 30 yrs out
Nearby sold comps map
Loading sold comps map…
Walkable amenities ~0.75 mi
Loading nearby amenities…
Taxation est. · year 1
- Rental income
- $21,734
- − Mortgage interest
- −$10,083
- − Property taxes
- −$1,025
- − Insurance
- −$900
- − Repairs & maintenance
- −$1,739
- − Management
- −$1,739
- − Depreciation
- −$5,236
- Taxable income
- $1,013
- Est. tax owed @ 24.0%
- −$243
- After-tax cash flow
- $3,675/yr
For passive investors: Depreciation is non-cash, so a rental often shows a tax loss while cash-flowing — sheltering income. Rental losses are passive: they offset passive income freely, and up to $25,000/yr can offset ordinary (W-2) income if you actively participate and your MAGI is under $100k (phasing out to $0 by $150k); unused losses carry forward. On sale, claimed depreciation is recaptured at up to 25%, and gains may owe capital-gains tax (a 1031 exchange can defer both). Figures are a year-1 estimate at your 24.0% rate — not tax advice; consult a CPA.
Schools (NCES district)
- District
- Lafayette School Corporation
- NCES district ID
- 1805400
- Math proficiency
- 29% ▼ -9.00%
- Reading proficiency
- 34% ▼ -7.00%
- Median HH income
- $39,817
- Composite
- 26.46/100
- National rank
- #7217
- State rank
- #235 of 301 in IN
Livability — Lafayette
- Score
- 74/100
- State rank
- #68
- US rank
- #4374
Category grades
Schools grade is shown separately in the Schools card above.
Census & demographics
- Census place
- Lafayette, IN
- County
- Tippecanoe County · 181,820 people
- City population
- 106,622
- Metro
- Lafayette-West Lafayette, IN
- Population (ZIP)
- 42,219
- Household income
- $65,861
- Rent vs Own
- Severe rent burden
- 1475.0
Population outlook (Tippecanoe County) Hauer SSP2
- Today (2025)
- 215,327 people
- By 2030
- 232,284 · +7.9%
- By 2040
- 266,517 · +23.8%
- By 2050
- 302,826 · +40.6%
- By 2075
- 394,445 · +83.2%
- By 2100
- 463,500 · +115.3%
Race, ethnicity, and origin ACS 2023
- Neighborhood character
- Predominantly White (74%)
- Race & ethnicity
- White 74% Hispanic / Latino 12% Two or more races 8% Black 7% Asian 4%
- Hispanic origin (detail)
- Mexican 10%
- Common ancestry
- Romanian 3% Italian 2% Slovak 2%
- Foreign-born
- 10% · Canada, China, Vietnam
- Languages at home
- 91% English-only · Spanish 6% Other Asian/Pacific 1% Vietnamese 1%
Political lean MEDSL · Tippecanoe
- 2024 margin
- Toss-up / Even · D 49.0% · R 49.1% · Other 1.9%
- 2008→2024 swing
- -11.8pp toward R · 2008: 11.6pp · 2024: -0.1pp
- All cycles
- 2024: R+0.1 2020: D+0.6 2016: R+5.7 2012: R+3.6 2008: D+11.6
Not yet ingested
- Civics
- —
Market trends
- HPI YoY
- ▼ -113.05%
- Current HPI
- 227.1583
- Rent YoY
- ▲ 5.12%
- Metro
- Lafayette-West Lafayette, IN
- State GDP YoY
- ▲ 2.90%
- F500 in state
- 18
Industry mix (Fortune 500 HQ in IN)
| Industry | F500 HQs | Revenue |
|---|---|---|
| Industrial Machinery | 2 | $37B |
|
||
| Healthcare | 1 | $177B |
|
||
| Pharmaceuticals | 1 | $45B |
|
||
| Metals / Steel | 1 | $18B |
|
||
| Agriculture | 1 | $17B |
|
||
| Packaging | 1 | $12B |
|
||
Price history
+66.7% since first listed2 events — show timeline
- 2026-06-02 Price Changed $180,000 NIRA MLS as Distributed by MLS Grid
- 2026-06-01 Listed $108,000 NIRA MLS as Distributed by MLS Grid
Property tax history
+12.0%/yrLatest (2024): $1,025 · +15.9% YoY. Source: county tax records.
Cash-flow waterfall
monthlySold comps — $/sqft
last 12 mo · ≤1 miLoading sold comps…