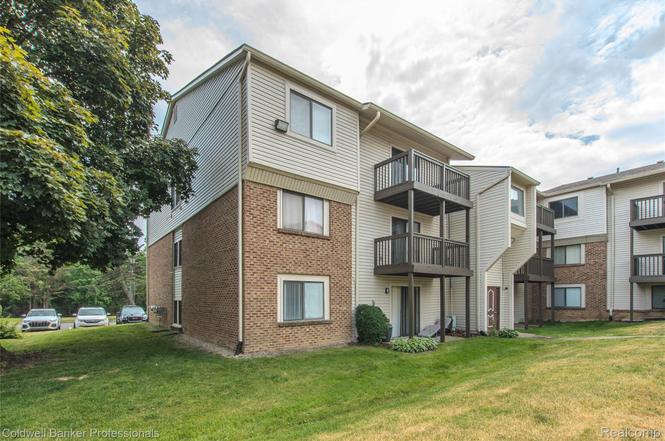
30078 W 12 Mile Rd Rd #99 · Farmington Hills, MI
Flood risk 1/10 · Minimal
- FEMA flood zone
- X (unshaded)
- Chance of flooding over 30 yrs
- 0.0%
- Est. flood insurance / yr
- $507 – $1,088
Fire risk 1/10 · Minimal
- Est. fire insurance / yr
- $784 – $1,456
Heat risk 2/10 · Minimal
- Hot days now (above 97°F)
- 7 days/yr
- Hot days in 30 yrs
- 15 days/yr
Wind risk 2/10 · Minimal
- Chance of severe wind over 30 yrs
- —
Air-quality risk 3/10 · Minor
- Unhealthy air days now
- 2 days/yr
- Unhealthy air days in 30 yrs
- 4 days/yr
Risk factors via First Street. Map © Google.
Why this score? — see what drove the D grade
The composite is a weighted blend of 9 inputs, each scored 0–100. Each bar is that input's sub-score; the figure is the points it added to the 100-point composite (weight × sub-score).
- Cash flow +11.0/30.0
- ARV discount +7.5/15.0
- 1% rule +5.7/10.0
- Schools +4.6/10.0
- Livability +4.0/5.0
- DSCR +3.2/10.0
- Rent growth +2.5/5.0
- Condition / age +2.5/5.0
- Appreciation +0.0/10.0
$129,900
🖨 Deal sheet (PDF) 📄 Offer letter ✓ Due diligence
Listing remarks MLS
Delightful 1st floor ranch condo (No steps) has lovely, pleasant views facing an expansive, grassy commons! Relax on the private patio to enjoy this peaceful setting. Updated kitchen boasts White cabinets, ceramic tile floor & Stainless Steel appliances. Beautiful Luxury Vinyl Plank floors in dining room, Living room & bedroom. Ceramic tile floors in foyer & full bath. Convenient in unit laundry closet boasts full size washer & dryer. Spacious bedroom features large walk-in closet. Linen closet, coat closet in foyer and separate storage closet offers terrific spaces for storage. Large carport protects your car from winter snow & ice and summer sun. Lots of guest parking. Low mthly fee. Owner pays only for electric, gas & cable/internet service and property taxes! Enjoy resort style amenities including tennis court & outdoor pool. Close to shopping, restaurants & conveniences on Orchard Lake Rd. An easy to maintain size & thoughtful design make everyday living easy & stress-free. You'll love carefree condo living while you grow equity for yourself instead of your Landlord!!
Key facts
- Private patio
- Updated kitchen
- Ceramic tile floor
Tags
Property features AI
Finance
- HOA & community: Homeowners association with monthly fee of $250; HOA covers insurance, grounds maintenance, structure maintenance, pest control, sewer, snow removal, trash, and utilities; Association provides grounds maintenance; Community amenities include pool, sidewalks, and tennis courts
Exterior
- Parking: Detached parking available; Parking lot; Carport; No garage
- Security: Building security; Smoke detector(s)
- Utilities: Public water; Public sewer; Circuit breaker electrical service; Cable available; Underground utilities
- Home design: Residential condominium; One level; Ground-level entry with steps
- Construction: Brick and wood siding construction; Asphalt roof; Slab foundation; Built in 2026
- Exterior features: Patio; Tennis court(s); Community outdoor in-ground pool; Paved road access
Interior
- Kitchen: Dishwasher; Disposal; Free‑standing electric oven; Free‑standing refrigerator; Gas water heater
- Bedrooms: Total of 5 rooms (includes bedroom count within room total)
- Bathrooms: 1 full bathroom
- Interior features: High-speed internet available; Unfurnished; Intercom; Smoke detectors
- Laundry & utility: In-unit laundry with washer and dryer; Washer hookup
Neighborhood map
What this means for you Summary
Snapshot
- This is a 1-bed/1.0-bath condo listed at $130k.
Deal economics
- At list price, monthly cash flow is $-54 ($-642/yr) — negative.
- To cash-flow at today's rent, offer at most $120k (7.3% below list).
- Meets the 1% rule at list price ($1k rent vs $130k).
- Recommended offer: $120k (7.3% below list) — sets the bar for cash-flow.
- Cap rate 5.8% vs local median 3.4% in Farmington Hills — top-decile yield for the area; either an underpriced asset or a hidden risk that comps aren't pricing in. Stress-test before assuming the spread holds.
Location & tenants
- Location reads 81/100 on livability (#64 in MI, #1,364 nationally) — a professional / high-income tenant draw. Strengths: employment A+, housing A+, crime A; Watch: amenities D, health & safety F.
- Farmington Public School District (urban): math 45% / reading 58% proficiency, ranked #78 of 540 in MI (top 14%) — acceptable for families but not a draw, mixed tenant base, ~2y average lease; only 19% free/reduced lunch — higher-income household profile.
- Zoned schools: Wood Creek Elementary School (math 17% / reading 27%, grade F, #1,035 of 1,397 statewide, top 77%, 401 students, 43% FRL); Warner Middle School (math 37% / reading 56%, grade D+, #150 of 493 statewide, top 31%, 571 students, 34% FRL) — zoned schools average 39% FRL vs 19% district-wide (20 pts higher); higher-poverty schools than district average — tighter screening recommended.
- Zoned-school proficiency averages 34% at this address vs 52% district-wide (-17 pts) — the specific schools serving this property underperform the Farmington Public School District average; the district grade overstates school quality for this exact location.
- Market conditions: 93 active listings in the ZIP; 7 comparable units currently listed for rent nearby; rentals at typical pace (median 20d on market — plan ~3-4 weeks tenant-placement turnaround); solid renter incomes; 2,614 units permitted in Oakland County in 2024 (721 in 5+ unit buildings).
- This rent is only 16% of the median local income ($102k/yr) — well below the 30% rent-burden line; pricing power to push rent on renewal without tenant pushback.
Forward outlook
- Local home prices are declining (-3.0%/yr); year-one equity from $898 of loan paydown is wiped out by about $4k of value loss. Plan a longer hold.
- Oakland County population projected at +10% by 2050 — modest demand growth; plan on rents tracking national, not racing it.
Negotiation context
- Only 5 days on market — expect competitive offers; lowballing is unlikely to land.
- 9 sale attempts since 31y ago with the ask held roughly flat each time — persistent listings suggest the price (not the market) is what's stuck; bring a comps-based counter.
- Current owner paid $59k; list at $130k implies a 120% gain — meaningful room to come down on a strong offer.
Questions for the listing agent
- What do current leases actually rent for vs. the listed asking? Can we see a recent rent roll and the last 12 months of T-12 income?
- What does the HOA fee cover, when was the last increase, and are there any pending special assessments or reserve-fund shortfalls?
- Any open or pending special assessments — roof, HVAC, plumbing, elevator, façade? What's the per-unit balance and payoff schedule, and is the seller paying it off at close or rolling it to the buyer?
- Is there a deadline driving the sale (1031 exchange, divorce, estate, relocation)? That informs how much negotiation room exists.
- Schools are B-rated — typically a magnet for longer-tenancy family renters. What's the average tenant stay here, and is there a school-zone premium baked into asking?
- The area grade is low — what's the realistic commute time and amenity access for the typical tenant pool here? Any planned neighborhood developments (good or bad) we should know about?
- What's the average days-on-market for RENTAL listings here right now (not sales)? A rising rental-DOM trend means longer vacancies and softer asking-rent achievability than the comps imply.
- What's the recent tenant-quality profile in this submarket — average credit score on applications, eviction rate, late-payment / NSF rate, and stable-employment percentage? A property-management company in the area should have these aggregated.
- How much new apartment / multifamily construction is in the pipeline within 1–3 miles? Heavy new supply (>2% of stock underway) typically softens rents 12–24 months out; light construction supports rent growth.
Investment metrics
- 1% rule
- 1.07% ✓
- Cap rate
- 5.80%
- Cash-on-cash
- -1.77%
- DSCR
- 0.92
- GRM
- 7.8
CMA / ARV
No comps found within radius.
Projected returns pro-forma
-3.0% appreciation · 3.0% rent growth · sell at horizon
- IRR
- -19.0%
- Equity multiple
- 0.33×
- Total profit
- $-24,281
- Equity at exit
- $19,369
- IRR
- -11.3%
- Equity multiple
- 0.32×
- Total profit
- $-24,814
- Equity at exit
- $11,231
Cash invested: $36,372 (down + closing). Projections, not guarantees.
Landlord ↔ Tenant lean methodology
- Overall (STATE)
- 62 Landlord-Friendly
- State Michigan
- 62 Landlord-Friendly · EVEN
- County
- — inherits STATE
- City
- — inherits STATE
ZIP-level market 48334
- Active inventory
- 93
- Price-to-rent
- 7.8×
Monthly cashflow live
- Estimated rent
- $1,389 high interval (Pro) →
- Mortgage (P&I)
- −$681
- Tax from tax record
- −$166 /mo · $1,990/yr
- Insurance
- −$54
- HOA
- −$250
- Vacancy / Maint / Mgmt
- −$292
- Net cashflow
- $-54
Break-even live
Sensitivity live
| Price | -10% $20 | -5% $-17 | +0% $-54 | +5% $-90 | +10% $-127 |
|---|---|---|---|---|---|
| Rent | -10% $-163 | -5% $-108 | +0% $-54 | +5% $1 | +10% $56 |
| Rate | -1.0pp $12 | -0.5pp $-20 | base $-54 | +0.5pp $-87 | +1.0pp $-121 |
UW: 25.0% down · 7.5% · 30yr · 1.5% tax · 5.0% vac · 8.0% maint · 8.0% mgmt
Financing live
Cash to close
- Down payment
- $32,475
- Closing costs
- $3,897
- Reserves months
- —
- Total cash needed
- —
Loan-product check · same deal, 3 products live
Conventional
25% down · 7.5% · 30yr
- Down + closing
- —
- Monthly P&I
- —
- Monthly cashflow
- —
- DSCR
- —
- Eligible?
- —
Personal DTI + credit; lowest rate.
DSCR
20% down · 8.5% · 30yr
- Down + closing
- —
- Monthly P&I
- —
- Monthly cashflow
- —
- DSCR
- —
- Eligible?
- —
No personal income docs; deal must DSCR.
Hard money
10% down · 12.0% · 12mo
- Down + closing
- —
- Monthly P&I
- —
- Monthly cashflow
- —
- DSCR
- —
- Eligible?
- —
Short-term bridge; refi at stabilization.
Rent comps 7 comps
| Address | Beds | Baths | Sqft | Rent | $/sqft | DOM | Units | Dist |
|---|---|---|---|---|---|---|---|---|
| 27991 Rollcrest Rd #1 Farmington Hills, MI | 2.0 | 1.0 | 922 | $1,600 | $1.74 | 45d | 1 | 0.08mi |
| 30250 W 12 Mile Rd Unit B102 Farmington Hills, MI | 1.0 | 1.0 | 842 | $1,120 | $1.33 | 26d | 1 | 0.08mi |
| 27600 Cordoba Dr Farmington Hills, MI | 1.0–2.0 | 1.0 | 764 | $1,338 | $1.75 | 1d | 18 | 0.17mi |
| 27517 Gateway Dr E Farmington Hills, MI | 1.0–2.0 | 1.0–2.0 | 987 | $1,439 | $1.46 | 19d | 80 | 0.37mi |
| 31993 W 12 Mile Rd Farmington Hills, MI | 1.0 | 1.0 | 901 | $1,100 | $1.22 | 5d | 1 | 0.84mi |
| 32005 W 12 Mile Rd #203 Farmington, MI | 1.0 | 1.0 | 876 | $1,250 | $1.43 | 46d | 1 | 0.85mi |
| 32005 W 12 Mile Rd Farmington Hills, MI | 1.0 | 1.0 | 731 | $1,224 | $1.68 | 14d | 2 | 0.86mi |
HOA detail condo
- Monthly dues
- $250 · $3,000/yr
- Likely covers
- gaselectricinternetcablepool
- Assessments
- None detected in remarks — confirm with the listing agent.
Listing history 4 events
-
2026-06-21days on market $129,900 Active 5 DOM
-
2026-06-18days on market $129,900 Active 2 DOM
-
2026-06-17remarks 679-char remark
-
2026-06-17$129,900 Active 1 DOM
ⓘ Source: listings_history table (triggers on properties + properties_extension) + one-shot
backfill from property_details.listing_events for pre-trigger history.
Tax reassessment forecast MI · Partial reset (capped growth)
- Current annual tax
- $1,990 · $166/mo
- Projected year-2 tax
- $1,995 · $166/mo
- Expected delta
- +$5/yr ($0/mo · 0.3%)
ⓘ Screening estimate from a state-policy table — verify with the county assessor before closing.
Climate risk First Street
- Flood 1/10 Low FEMA zone X (unshaded) · 0% chance over 30 yrs
- Wildfire 1/10 Low
- Heat 2/10 Low 7 d/yr ≥97°F today · 15 d/yr by 30 yrs out
- Wind 2/10 Low
- Air quality 3/10 Moderate 2 unhealthy d/yr today · 4 by 30 yrs out
Nearby sold comps map
Loading sold comps map…
Walkable amenities ~0.75 mi
Loading nearby amenities…
Taxation est. · year 1
- Rental income
- $16,673
- − Mortgage interest
- −$7,276
- − Property taxes
- −$1,990
- − Insurance
- −$650
- − Repairs & maintenance
- −$1,334
- − Management
- −$1,334
- − HOA
- −$3,000
- − Depreciation
- −$3,779
- Taxable loss
- −$2,689
- Est. tax savings @ 24.0%
- +$645
- After-tax cash flow
- $3/yr
For passive investors: Depreciation is non-cash, so a rental often shows a tax loss while cash-flowing — sheltering income. Rental losses are passive: they offset passive income freely, and up to $25,000/yr can offset ordinary (W-2) income if you actively participate and your MAGI is under $100k (phasing out to $0 by $150k); unused losses carry forward. On sale, claimed depreciation is recaptured at up to 25%, and gains may owe capital-gains tax (a 1031 exchange can defer both). Figures are a year-1 estimate at your 24.0% rate — not tax advice; consult a CPA.
Schools (NCES district)
- District
- Farmington Public School District
- NCES district ID
- 2614070
- Math proficiency
- 45% ▼ -5.00%
- Reading proficiency
- 58% ▼ -1.00%
- Median HH income
- $72,846
- Composite
- 46.17/100
- National rank
- #2497
- State rank
- #78 of 540 in MI
Livability — Farmington Hills
- Score
- 81/100
- State rank
- #64
- US rank
- #1364
Category grades
Schools grade is shown separately in the Schools card above.
Census & demographics
- Census place
- Farmington Hills, MI
- County
- Oakland County · 1,009,092 people
- City population
- 67,612
- Metro
- Detroit-Warren-Dearborn, MI
- Population (ZIP)
- 19,618
- Household income
- $102,228
- Rent vs Own
- Severe rent burden
- 630.0
Population outlook (Oakland County) Hauer SSP2
- Today (2025)
- 1,335,747 people
- By 2030
- 1,375,100 · +2.9%
- By 2040
- 1,435,385 · +7.5%
- By 2050
- 1,469,250 · +10.0%
- By 2075
- 1,531,946 · +14.7%
- By 2100
- 1,450,485 · +8.6%
Race, ethnicity, and origin ACS 2023
- Neighborhood character
- Diverse neighborhood (Simpson 0.64)
- Race & ethnicity
- White 54% Black 25% Asian 12% Two or more races 8% Hispanic / Latino 2%
- Common ancestry
- Romanian 7% Lithuanian 3% Scotch-Irish 3%
- Foreign-born
- 17% · Canada, China, South Korea
- Languages at home
- 82% English-only · Other Indo-European 7% Arabic 3% Other Asian/Pacific 3%
Political lean MEDSL · Oakland
- 2024 margin
- D (+10.6) · D 54.4% · R 43.8% · Other 1.9%
- 2008→2024 swing
- -3.9pp toward R · 2008: 14.5pp · 2024: 10.6pp
- All cycles
- 2024: D+10.6 2020: D+14.1 2016: D+8.1 2012: D+8.1 2008: D+14.5
Not yet ingested
- Civics
- —
Market trends
- HPI YoY
- ▼ -189.65%
- Current HPI
- 166.7194
- Rent YoY
- —
- Metro
- Detroit-Warren-Dearborn, MI
- State GDP YoY
- ▲ 1.37%
- F500 in state
- 28
Industry mix (Fortune 500 HQ in MI)
| Industry | F500 HQs | Revenue |
|---|---|---|
| Automotive Parts | 3 | $48B |
|
||
| Automotive | 2 | $372B |
|
||
| Chemicals | 1 | $45B |
|
||
| Automotive Retail | 1 | $29B |
|
||
| Healthcare / Medical Devices | 1 | $23B |
|
||
| Automotive Technology | 1 | $20B |
|
||
Price history
+183.0% since first listed28 events — show timeline
- 2026-06-16 Listed $129,900 REALCOMP
- 2026-06-16 Listed $129,900 MiRealSource-MiMLS
- 2017-12-14 Sold (Public Records) $59,000 Public Records
- 2017-12-04 Sold (MLS) $59,000 MiRealSource-MiMLS
- 2017-12-04 Sold (MLS) $59,000 REALCOMP
- 2017-11-22 Pending — MiRealSource-MiMLS
- 2017-11-22 Pending — REALCOMP
- 2017-11-10 Listed $59,900 MiRealSource-MiMLS
- 2017-11-10 Listed $59,900 REALCOMP
- 2013-07-16 Sold (Public Records) $40,100 Public Records
- 2013-07-10 Sold (MLS) $40,000 MiRealSource-MiMLS
- 2013-07-10 Sold (MLS) $40,000 REALCOMP
- 2013-06-19 Listing Removed — MiRealSource-MiMLS
- 2013-06-19 Listing Removed — REALCOMP
- 2013-05-20 Listed $34,500 MiRealSource-MiMLS
- 2013-05-20 Listed $34,500 REALCOMP
- 2006-10-27 Sold (MLS) $69,000 REALCOMP
- 2006-09-01 Sold (Public Records) $69,000 Public Records
- 2006-04-01 Listed $73,500 REALCOMP
- 1999-06-11 Listing Removed — REALCOMP
- 1998-02-04 Sold (Public Records) $61,600 Public Records
- 1998-01-16 Sold (MLS) $61,600 REALCOMP
- 1997-10-26 Listed $63,000 REALCOMP
- 1995-11-08 Sold (Public Records) $50,900 Public Records
- 1995-03-17 Listed $50,900 REALCOMP
- 1992-07-27 Sold (Public Records) $44,145 Public Records
- 1989-06-01 Sold (Public Records) $48,500 Public Records
- 1979-11-01 Sold (Public Records) $45,900 Public Records
Property tax history
+8.3%/yrLatest (2025): $1,990 · +3.1% YoY. Source: county tax records.
Cash-flow waterfall
monthlySold comps — $/sqft
last 12 mo · ≤1 miLoading sold comps…