12 Linda Ct · Freedom Plains, NY
Flood risk 1/10 · Minimal
- FEMA flood zone
- X (unshaded)
- Chance of flooding over 30 yrs
- 0.0%
- Est. flood insurance / yr
- $473 – $860
Fire risk 3/10 · Minor
- Est. fire insurance / yr
- $691 – $1,283
Heat risk 4/10 · Minor
- Hot days now (above 98°F)
- 7 days/yr
- Hot days in 30 yrs
- 15 days/yr
Wind risk 4/10 · Minor
- Chance of severe wind over 30 yrs
- 12.0%
Air-quality risk 3/10 · Minor
- Unhealthy air days now
- 2 days/yr
- Unhealthy air days in 30 yrs
- 3 days/yr
Risk factors via First Street. Map © Google.
Why this score? — see what drove the B grade
The composite is a weighted blend of 9 inputs, each scored 0–100. Each bar is that input's sub-score; the figure is the points it added to the 100-point composite (weight × sub-score).
- Cash flow +30.0/30.0
- 1% rule +10.0/10.0
- DSCR +10.0/10.0
- ARV discount +7.5/15.0
- Schools +6.3/10.0
- Livability +3.2/5.0
- Rent growth +3.0/5.0
- Condition / age +2.5/5.0
- Appreciation +0.0/10.0
$100,000
🖨 Deal sheet 📄 Offer letter ✓ Due diligence
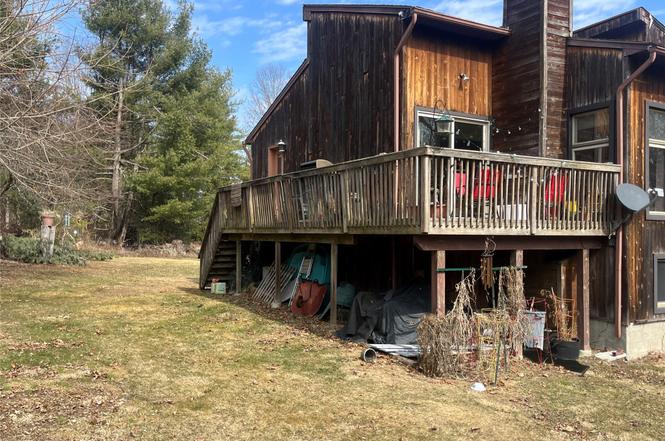
Listing remarks
Short Sale – Subject to Third Party Approval. Property requires a total renovation including kitchen, baths, roof, siding, flooring, mechanicals, and major interior/exterior repairs. Deck and pool need full restoration. Being sold strictly as-is, cash only; buyer responsible for all inspections, permits, and repairs.
Key facts
- 1.2 acre lot
- Built 1984
- Listed 5 days
Neighborhood map
What this means for you Summary
Snapshot
- This is a 3-bed/2.0-bath single-family listed at $100k.
Deal economics
- At list price, monthly cash flow is $2k ($26k/yr) — positive.
- The deal already cash-flows at list — no discount required.
- Meets the 1% rule at list price ($4k rent vs $100k).
- Cap rate 32.6% vs local median 3.4% in Freedom Plains — top-decile yield for the area; either an underpriced asset or a hidden risk that comps aren't pricing in. Stress-test before assuming the spread holds.
Location & tenants
- Location reads 65/100 on livability (#715 in NY) — a middle-class / working-renter tenant base. Strengths: schools A-; Watch: housing C-, crime F, amenities F.
- Arlington Central School District (suburban): math 77% / reading 65% proficiency, ranked #106 of 590 in NY (top 18%) — strong family-tenant draw, lease renewals of 3-5y typical; only 16% free/reduced lunch — higher-income household profile.
- Market conditions: Rents rising (+2.0%/yr); 209 active listings in the ZIP; 2 comparable units currently listed for rent nearby; solid renter incomes; 620 units permitted in Dutchess County in 2024 (242 in 5+ unit buildings).
- This rent runs 42% of the median local income ($104k/yr) — at the standard rent-burdened threshold; future hikes will face affordability resistance.
Forward outlook
- Local home prices are declining (-3.0%/yr); year-one equity from $691 of loan paydown is wiped out by about $3k of value loss. Plan a longer hold.
- Dutchess County population projected at -11% by 2050 — secular population decline; favor cash flow + early exit over multi-decade hold.
- At projected returns (-3.0% appreciation + 2.0% rent growth), your $28k cash investment doubles in ~2 years — after that, you're playing with house money.
Negotiation context
- Only 5 days on market — expect competitive offers; lowballing is unlikely to land.
- 3 sale attempts since 22y ago with the ask held roughly flat each time — persistent listings suggest the price (not the market) is what's stuck; bring a comps-based counter.
Questions for the listing agent
- Is there a deadline driving the sale (1031 exchange, divorce, estate, relocation)? That informs how much negotiation room exists.
- Schools are A-rated — typically a magnet for longer-tenancy family renters. What's the average tenant stay here, and is there a school-zone premium baked into asking?
- Crime grade is F in this area — have there been break-ins, vandalism, or insurance claims at this property in the last 3 years? What carrier currently insures it and at what premium?
- What's the average days-on-market for RENTAL listings here right now (not sales)? A rising rental-DOM trend means longer vacancies and softer asking-rent achievability than the comps imply.
- What's the recent tenant-quality profile in this submarket — average credit score on applications, eviction rate, late-payment / NSF rate, and stable-employment percentage? A property-management company in the area should have these aggregated.
- How much new for-sale + rental construction is in the pipeline within 1–3 miles? Heavy new supply typically softens prices + rents 12–24 months out; constrained supply supports both.
Investment metrics
- 1% rule
- 3.65% ✓
- Cap rate
- 32.56%
- Cash-on-cash
- 93.83%
- DSCR
- 5.17
- GRM
- 2.3
CMA / ARV
- ARV (on-the-fly)
- $493,240
- Comps found
- 4
Show comp detail 4 sales within ~0.75 mi
| Address | Dist | Beds/Ba | Sqft | Sold | Price | $/sf | Match |
|---|---|---|---|---|---|---|---|
| 65 Mandalay Dr | 0.72mi | 3/2.5 | 1,932 (-8%) | 7mo | $450,000 | $233 | 46 |
| 24 Sedgewick Rd | 0.71mi | 3/2.0 | 1,844 (-12%) | 4mo | $435,000 | $236 | 44 |
| 3 Cromwell Dr | 0.74mi | 4/1.5 (+1) | 1,806 (-14%) | 9mo | $415,000 | $230 | 29 |
| 95 Mandalay Dr | 0.68mi | 3/2.0 | 1,800 (-14%) | 22mo | $456,000 | $253 | 27 |
Match score weights: distance 35% · size 25% · config 20% · recency 20%. Top-matched comps best support the ARV.
Projected returns pro-forma
-3.0% appreciation · 1.96% rent growth · sell at horizon
- IRR
- 93.5%
- Equity multiple
- 5.27×
- Total profit
- $119,514
- Equity at exit
- $14,910
- IRR
- 96.1%
- Equity multiple
- 10.60×
- Total profit
- $268,670
- Equity at exit
- $8,646
Cash invested: $28,000 (down + closing). Projections, not guarantees.
Landlord ↔ Tenant lean methodology
- Overall (STATE)
- 15 Strongly Tenant-Friendly
- State New York
- 15 Strongly Tenant-Friendly · D+10
- County
- — inherits STATE
- City
- — inherits STATE
ZIP-level market 12603
- Rents YoY
- 2.0%
- Active inventory
- 209
- Price-to-rent
- 2.3×
Monthly cashflow live
- Estimated rent
- $3,646 medium interval (Pro) →
- Mortgage (P&I)
- −$524
- Tax est. 1.5%
- −$125 /mo · $1,500/yr
- Insurance
- −$42
- HOA
- −$0
- Vacancy / Maint / Mgmt
- −$766
- Net cashflow
- $2,189
Break-even live
UW: 25.0% down · 7.5% · 30yr · 1.5% tax · 5.0% vac · 8.0% maint · 8.0% mgmt
Financing live
Cash to close
- Down payment
- $25,000
- Closing costs
- $3,000
- Reserves months
- —
- Total cash needed
- —
Loan-product check · same deal, 3 products live
Conventional
25% down · 7.5% · 30yr
- Down + closing
- —
- Monthly P&I
- —
- Monthly cashflow
- —
- DSCR
- —
- Eligible?
- —
Personal DTI + credit; lowest rate.
DSCR
20% down · 8.5% · 30yr
- Down + closing
- —
- Monthly P&I
- —
- Monthly cashflow
- —
- DSCR
- —
- Eligible?
- —
No personal income docs; deal must DSCR.
Hard money
10% down · 12.0% · 12mo
- Down + closing
- —
- Monthly P&I
- —
- Monthly cashflow
- —
- DSCR
- —
- Eligible?
- —
Short-term bridge; refi at stabilization.
Rent comps 2 comps
| Address | Beds | Baths | Sqft | Rent | $/sqft | DOM | Units | Dist |
|---|---|---|---|---|---|---|---|---|
| 4 Glen Ct Poughkeepsie, NY | 3.0 | 2.0 | 1782 | $4,500 | $2.53 | 44d | 1 | 0.83mi |
| 34 Rombout Rd Poughkeepsie, NY | 3.0 | 2.5 | 2707 | $4,000 | $1.48 | 23d | 1 | 1.30mi |
Listing history 8 events
-
2025-10-22status Pending
-
2025-09-12$100,000 Active
-
2008-10-31historical
-
2008-02-11
-
2005-08-05soldstatus $400,000
-
2005-05-31historical
-
2004-11-30
-
2001-03-06soldstatus $218,000
ⓘ Source: listings_history table (triggers on properties + properties_extension) + one-shot
backfill from property_details.listing_events for pre-trigger history.
Climate risk First Street
- Flood 1/10 Low FEMA zone X (unshaded) · 0% chance over 30 yrs
- Wildfire 3/10 Moderate
- Heat 4/10 Moderate 7 d/yr ≥98°F today · 15 d/yr by 30 yrs out
- Wind 4/10 Moderate 12% chance of damaging wind over 30 yrs
- Air quality 3/10 Moderate 2 unhealthy d/yr today · 3 by 30 yrs out
Nearby sold comps map
Loading sold comps map…
Walkable amenities ~0.75 mi
Loading nearby amenities…
Taxation est. · year 1
- Rental income
- $43,753
- − Mortgage interest
- −$5,602
- − Property taxes
- −$1,500
- − Insurance
- −$500
- − Repairs & maintenance
- −$3,500
- − Management
- −$3,500
- − Depreciation
- −$2,909
- Taxable income
- $26,242
- Est. tax owed @ 24.0%
- −$6,298
- After-tax cash flow
- $19,974/yr
For passive investors: Depreciation is non-cash, so a rental often shows a tax loss while cash-flowing — sheltering income. Rental losses are passive: they offset passive income freely, and up to $25,000/yr can offset ordinary (W-2) income if you actively participate and your MAGI is under $100k (phasing out to $0 by $150k); unused losses carry forward. On sale, claimed depreciation is recaptured at up to 25%, and gains may owe capital-gains tax (a 1031 exchange can defer both). Figures are a year-1 estimate at your 24.0% rate — not tax advice; consult a CPA.
Schools (NCES district)
- District
- Arlington Central School District
- NCES district ID
- 3603270
- Math proficiency
- 77% ▲ 19.00%
- Reading proficiency
- 65% ▲ 12.00%
- Median HH income
- $83,597
- Composite
- 63.47/100
- National rank
- #613
- State rank
- #106 of 590 in NY
Livability — Freedom Plains
- Score
- 65/100
- State rank
- #715
- US rank
- #13585
Category grades
Schools grade is shown separately in the Schools card above.
Census & demographics
- County
- Dutchess County · 188,048 people
- Metro
- Poughkeepsie-Newburgh-Middletown, NY
- Population (ZIP)
- 42,304
- Household income
- $103,538
- Rent vs Own
- Severe rent burden
- 1404.0
Population outlook (Dutchess County) Hauer SSP2
- Today (2025)
- 291,768 people
- By 2030
- 287,131 · -1.6%
- By 2040
- 274,881 · -5.8%
- By 2050
- 259,971 · -10.9%
- By 2075
- 235,366 · -19.3%
- By 2100
- 208,786 · -28.4%
Race, ethnicity, and origin ACS 2023
- Neighborhood character
- Majority White (65%)
- Race & ethnicity
- White 65% Hispanic / Latino 13% Black 11% Two or more races 8% Asian 6%
- Hispanic origin (detail)
- Mexican 4% Puerto Rican 4% Dominican 1%
- Common ancestry
- Romanian 4% Scotch-Irish 2% Iranian 1%
- Foreign-born
- 15% · Canada, China
- Languages at home
- 81% English-only · Spanish 8% Other Indo-European 4% German/W. Germanic 2%
Political lean MEDSL · Dutchess
- 2024 margin
- Lean D (+5.4) · D 52.7% · R 47.3%
- 2008→2024 swing
- -3.2pp toward R · 2008: 8.6pp · 2024: 5.4pp
- All cycles
- 2024: D+5.4 2020: D+9.6 2016: R+1.1 2012: D+6.6 2008: D+8.6
Not yet ingested
- Civics
- —
Market trends
- HPI YoY
- ▼ -377.61%
- Current HPI
- 252.7003
- Rent YoY
- ▲ 1.96%
- Metro
- Poughkeepsie-Newburgh-Middletown, NY
- State GDP YoY
- ▲ 2.60%
- F500 in state
- 92
Industry mix (Fortune 500 HQ in NY)
| Industry | F500 HQs | Revenue |
|---|---|---|
| Financial Services | 10 | $950B |
|
||
| Consumer Goods | 9 | $162B |
|
||
| Insurance | 4 | $225B |
|
||
| Telecommunications | 2 | $144B |
|
||
| Pharmaceuticals | 2 | $112B |
|
||
| Media / Entertainment | 2 | $69B |
|
||
Price history
-54.1% since first listed8 events — show timeline
- 2025-10-22 Pending — OneKey® MLS as Distributed by MLS Grid
- 2025-09-12 Listed $100,000 OneKey® MLS as Distributed by MLS Grid
- 2008-10-31 Delisted — HGMLS
- 2008-02-11 Listed — HGMLS
- 2005-08-05 Sold (Public Records) $400,000 Public Records
- 2005-05-31 Delisted — HGMLS
- 2004-11-30 Listed — HGMLS
- 2001-03-06 Sold (Public Records) $218,000 Public Records
Property tax history
+4.4%/yrLatest (2025): $14,137 · +6.2% YoY. Source: county tax records.
Cash-flow waterfall
monthlySold comps — $/sqft
last 12 mo · ≤1 miLoading sold comps…