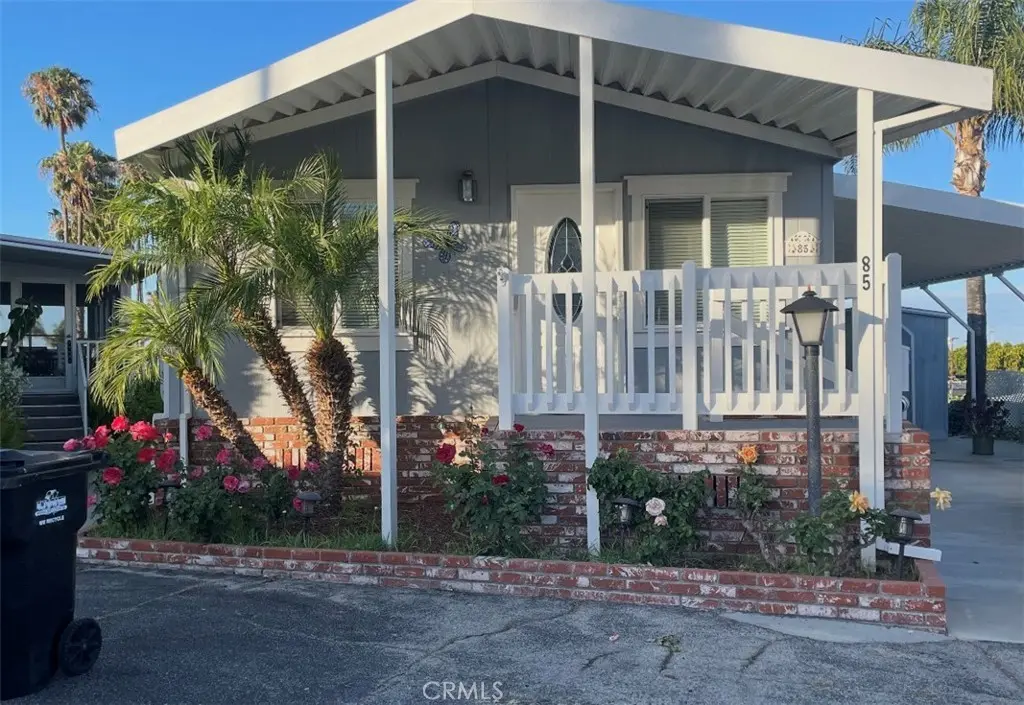
2550 Pacific Coast Hwy. #85 · Torrance, CA
Flood risk 1/10 · Minimal
- FEMA flood zone
- X (unshaded)
- Chance of flooding over 30 yrs
- 0.0%
- Est. flood insurance / yr
- $507 – $1,088
Fire risk 1/10 · Minimal
- Est. fire insurance / yr
- $659 – $1,223
Heat risk 3/10 · Minor
- Hot days now (above 86°F)
- 7 days/yr
- Hot days in 30 yrs
- 22 days/yr
Wind risk 1/10 · Minimal
- Chance of severe wind over 30 yrs
- —
Air-quality risk 5/10 · Moderate
- Unhealthy air days now
- 7 days/yr
- Unhealthy air days in 30 yrs
- 7 days/yr
Risk factors via First Street. Map © Google.
Why this score? — see what drove the B- grade
The composite is a weighted blend of 9 inputs, each scored 0–100. Each bar is that input's sub-score; the figure is the points it added to the 100-point composite (weight × sub-score).
- Cash flow +30.0/30.0
- 1% rule +10.0/10.0
- DSCR +10.0/10.0
- Schools +5.9/10.0
- Livability +3.8/5.0
- Rent growth +3.6/5.0
- Condition / age +2.5/5.0
- ARV discount +0.0/15.0
- Appreciation +0.0/10.0
$179,000
🖨 Deal sheet 📄 Offer letter ✓ Due diligence
Listing remarks MLS
The Newest Listing at Skyline is a Fixer Upper Semi-Double Wide. Great Location in the Park. Needs some TLC. 1 Bedroom 1 Bath w/ a Popout that is used as a large living room and another bedroom. Skyline is a Senior Park and includes amenities such as a recreation center w/ pool, jacuizzi, billiard room w/ 2 pool tables, card room w/ lending book library and much more. Across the street from Rolling Hills Plaza center which offers Trader Joes, Whole Foods, many fine eateries & shops & theaters. There is close to 1000 sq. ft. Buyer to verify. There is a covered front deck that is approx 150 Sq. Ft. This Home is a short walk to the recreation center.
Key facts
- 2 parking spots
- Community pool
- Built 2013
Property features AI
Finance
- Other: Located in Skyline Mobile Home Park (manager approval required); Private paved road frontage; Directions: Cross street Crenshaw and PCH, across from Rolling Hills Shopping Center
- HOA & community: Land lease (park) with monthly payment required; Community features include street lighting and storm drains; Rent includes pool and sewer
Exterior
- Parking: Paved parking; Tandem covered carport (attached); 2 uncovered spaces (total 2 parking spaces)
- Security: Carbon monoxide detector(s); Smoke detector; Gated community with attendant; Resident manager
- Utilities: District/public water; Public sewer; Natural gas connected; Electricity connected (standard); Sewer connected; Cable available; Telephone in street
- Home design: Single-story; Entry at front; Mobile home model Amber (20' x 52'); Turnkey condition; Has a view
- Construction: Masonite exterior; Drywall interior walls; Pier jacks foundation
- Exterior features: Covered front porch; Deck; Patio; Community heated pool (fenced); Aluminum skirting; Shed; Sprinkler system; Landscaped; Close to clubhouse; Lot is level with street; Located on a cul-de-sac
Interior
- Kitchen: Garbage disposal; Microwave; Refrigerator; Free standing range; Range/stove hood; Ice maker; Gas range; Dishwasher; Formica counters
- Bedrooms: All bedrooms on main floor; Main floor bedroom; Walk-in closet
- Flooring: Vinyl; Carpet
- Bathrooms: One full bath; One three-quarter bath; Shower in tub; Bathtub; Exhaust fan(s); Low-flow shower; Low-flow toilet(s)
- Heating & cooling: Central heating (furnace); Central cooling
- Interior features: Ceiling fan; Living room deck attached; Storage space; Cathedral/vaulted ceilings; Formica counters; Double-pane windows; Drapes/curtains; Blinds; Window screens
- Laundry & utility: Laundry inside in individual room; Washer included; Dryer included; Utility room
Neighborhood map
What this means for you Summary
Snapshot
- This is a 2-bed/2.0-bath manufactured listed at $179k.
Deal economics
- At list price, monthly cash flow is $1k ($16k/yr) — positive.
- The deal already cash-flows at list — no discount required.
- Meets the 1% rule at list price ($3k rent vs $179k).
- Recommended offer: $174k (3.0% below list) — sets the bar for market timing.
- Cap rate 15.4% vs local median 2.1% in Torrance — top-decile yield for the area; either an underpriced asset or a hidden risk that comps aren't pricing in. Stress-test before assuming the spread holds.
Location & tenants
- Location reads 76/100 on livability (#95 in CA, #3,501 nationally) — a middle-class / working-renter tenant base. Strengths: schools A+, amenities A+, commute A+; Watch: health & safety C-, crime D+, cost of living F.
- Torrance Unified (urban): math 62% / reading 67% proficiency, ranked #150 of 1,400 in CA (top 11%) — acceptable for families but not a draw, mixed tenant base, ~2y average lease; only 20% free/reduced lunch — higher-income household profile.
- Market conditions: Rents rising fast (+4.5%/yr); 63 active listings in the ZIP; 40 comparable units currently listed for rent nearby; rentals at typical pace (median 25d on market — plan ~3-4 weeks tenant-placement turnaround); 48% of comp listings sitting > 30 days — soft ceiling on asking rent; high-income renter base; 19,697 units permitted in Los Angeles County in 2024 (9,426 in 5+ unit buildings).
- This rent runs 32% of the median local income ($116k/yr) — at the standard rent-burdened threshold; future hikes will face affordability resistance.
Forward outlook
- Local home prices are declining (-3.0%/yr); year-one equity from $1k of loan paydown is wiped out by about $5k of value loss. Plan a longer hold.
- Los Angeles County population projected at +9% by 2050 — modest demand growth; plan on rents tracking national, not racing it.
- At projected returns (-3.0% appreciation + 4.5% rent growth), your $50k cash investment doubles in ~4 years — after that, you're playing with house money.
Negotiation context
- It's been on market 54 days — a 3% lower offer ($174k) is reasonable based on typical stale-listing flexibility.
- 2 sale attempts since 14y ago with the ask held roughly flat each time — persistent listings suggest the price (not the market) is what's stuck; bring a comps-based counter.
- Current owner paid $36k; list at $179k implies a 397% gain — meaningful room to come down on a strong offer.
Questions for the listing agent
- It's been on market 54 days. Have you received any prior offers? Is the seller open to a 3% concession, seller financing, or rate buy-down credit?
- Is there a deadline driving the sale (1031 exchange, divorce, estate, relocation)? That informs how much negotiation room exists.
- Schools are A-rated — typically a magnet for longer-tenancy family renters. What's the average tenant stay here, and is there a school-zone premium baked into asking?
- Crime grade is D in this area — have there been break-ins, vandalism, or insurance claims at this property in the last 3 years? What carrier currently insures it and at what premium?
- What's the average days-on-market for RENTAL listings here right now (not sales)? A rising rental-DOM trend means longer vacancies and softer asking-rent achievability than the comps imply.
- What's the recent tenant-quality profile in this submarket — average credit score on applications, eviction rate, late-payment / NSF rate, and stable-employment percentage? A property-management company in the area should have these aggregated.
- How much new for-sale + rental construction is in the pipeline within 1–3 miles? Heavy new supply typically softens prices + rents 12–24 months out; constrained supply supports both.
Investment metrics
- 1% rule
- 1.74% ✓
- Cap rate
- 15.37%
- Cash-on-cash
- 32.43%
- DSCR
- 2.44
- GRM
- 4.8
CMA / ARV
- ARV (median comp)
- $147,502
- List price
- $179,000
- Delta
- 21.35%
- Verdict
- OVERPRICED
- Comps
- 8 within 1.0 mi
Show comp detail 11 sales within ~0.75 mi
| Address | Dist | Beds/Ba | Sqft | Sold | Price | $/sf | Match |
|---|---|---|---|---|---|---|---|
| 2550 Pacific Coast Hwy. #63A | 0.04mi | 2/2.0 | 1,080 (0%) | 6mo | $135,000 | $125 | 93 |
| 2550 Pacific Cost Hwy. #36 | 0.00mi | 2/2.0 | 1,040 (-4%) | 3mo | $185,000 | $178 | 91 |
| 2550 Pacific Coast Hwy #47 | 0.05mi | 2/2.0 | 1,100 (+2%) | 5mo | $110,000 | $100 | 90 |
| 2550 Pacific Coast Hwy. #146 | 0.00mi | 2/2.0 | 1,095 (+1%) | 15mo | $240,000 | $219 | 85 |
| 2550 Pacific Coast Hwy #169 | 0.20mi | 2/2.0 | 1,080 (0%) | 9mo | $125,000 | $116 | 84 |
| 2550 Pacific Coast Hwy #150 | 0.00mi | 2/2.0 | 1,056 (-2%) | 21mo | $279,000 | $264 | 78 |
| 2550 Pacific Coast Hwy #1 | 0.00mi | 3/2.0 (+1) | 1,104 (+2%) | 20mo | $275,000 | $249 | 75 |
| 2550 Pacific Coast Highway #104 | 0.16mi | 2/2.0 | 1,080 (0%) | 22mo | $257,500 | $238 | 74 |
| 2550 Pacific Coast Hwy #114 | 0.16mi | 2/1.0 | 1,000 (-7%) | 10mo | $125,000 | $125 | 68 |
| 2550 Pacific Coast Hwy #31 | 0.19mi | 2/2.0 | 1,000 (-7%) | 16mo | $99,500 | $100 | 66 |
| 2550 Pacific Coast Hwy #42 | 0.16mi | 3/2.0 (+1) | 1,200 (+11%) | 5mo | $185,000 | $154 | 65 |
Match score weights: distance 35% · size 25% · config 20% · recency 20%. Top-matched comps best support the ARV.
Projected returns pro-forma
-3.0% appreciation · 4.55% rent growth · sell at horizon
- IRR
- 29.1%
- Equity multiple
- 2.24×
- Total profit
- $62,142
- Equity at exit
- $26,689
- IRR
- 37.3%
- Equity multiple
- 4.71×
- Total profit
- $185,890
- Equity at exit
- $15,477
Cash invested: $50,120 (down + closing). Projections, not guarantees.
Landlord ↔ Tenant lean methodology
- Overall (STATE)
- 18 Strongly Tenant-Friendly
- State California
- 18 Strongly Tenant-Friendly · D+13
- County
- — inherits STATE
- City
- — inherits STATE
ZIP-level market 90505
- Rents YoY
- 4.5%
- Active inventory
- 63
- Price-to-rent
- 4.8×
Monthly cashflow live
- Estimated rent
- $3,109 high interval (Pro) →
- Mortgage (P&I)
- −$939
- Tax from tax record
- −$88 /mo · $1,060/yr
- Insurance
- −$75
- HOA
- −$0
- Vacancy / Maint / Mgmt
- −$653
- Net cashflow
- $1,354
Break-even live
UW: 25.0% down · 7.5% · 30yr · 1.5% tax · 5.0% vac · 8.0% maint · 8.0% mgmt
Financing live
Cash to close
- Down payment
- $44,750
- Closing costs
- $5,370
- Reserves months
- —
- Total cash needed
- —
Loan-product check · same deal, 3 products live
Conventional
25% down · 7.5% · 30yr
- Down + closing
- —
- Monthly P&I
- —
- Monthly cashflow
- —
- DSCR
- —
- Eligible?
- —
Personal DTI + credit; lowest rate.
DSCR
20% down · 8.5% · 30yr
- Down + closing
- —
- Monthly P&I
- —
- Monthly cashflow
- —
- DSCR
- —
- Eligible?
- —
No personal income docs; deal must DSCR.
Hard money
10% down · 12.0% · 12mo
- Down + closing
- —
- Monthly P&I
- —
- Monthly cashflow
- —
- DSCR
- —
- Eligible?
- —
Short-term bridge; refi at stabilization.
Rent comps 40 comps
| Address | Beds | Baths | Sqft | Rent | $/sqft | DOM | Units | Dist |
|---|---|---|---|---|---|---|---|---|
| 26015 Crest Rd Torrance, CA | 3.0 | 2.0 | 1214 | $4,300 | $3.54 | 16d | 1 | 0.22mi |
| 25829 Viana Ave Lomita, CA | 2.0 | 1.5 | 1160 | $3,149 | $2.71 | 3d | 2 | 0.38mi |
| 25930 Rolling Hills Rd Torrance, CA | 1.0–2.0 | 1.0–1.5 | 1055 | $2,950 | $2.80 | 2d | 5 | 0.52mi |
| 25925 Narbonne Ave #3 Lomita, CA | 2.0 | 1.0 | 805 | $2,550 | $3.17 | 24d | 1 | 0.59mi |
| 25925 Narbonne Ave Lomita, CA | 1.0–2.0 | 1.0 | 805 | $2,550 | $3.17 | 43d | 2 | 0.59mi |
| 26110 Narbonne Ave Unit 10 Lomita, CA | 2.0 | 1.0 | 975 | $2,307 | $2.37 | 43d | 1 | 0.67mi |
| 26110 Narbonne Ave Unit 16 Lomita, CA | 1.0 | 1.0 | 700 | $1,779 | $2.54 | 43d | 1 | 0.67mi |
| 26110 Narbonne Ave Apt 9 Lomita, CA | 2.0 | 2.0 | 1100 | $2,399 | $2.18 | 43d | 1 | 0.67mi |
| 26205 Oak St Lomita, CA | 3.0 | 2.0 | 1430 | $4,000 | $2.80 | 43d | 1 | 0.74mi |
| 25205 Cypress St Unit 3 Lomita, CA | 3.0 | 2.5 | 1397 | $3,395 | $2.43 | 43d | 1 | 0.75mi |
| 26019 Oak St Lomita, CA | 2.0 | 1.0 | 711 | $1,925 | $2.71 | 1d | 2 | 0.75mi |
| 25907 Oak St Unit 19 Lomita, CA | 2.0 | 1.5 | 1014 | $2,795 | $2.76 | 43d | 1 | 0.77mi |
| 25907 Oak St Unit 19 Lomita, CA | 2.0 | 1.5 | 1014 | $2,795 | $2.76 | 7d | 1 | 0.77mi |
| 15 Lantana Pl Unit A Rolling Hills Estates, CA | 1.0 | 1.0 | 1000 | $4,500 | $4.50 | 1d | 1 | 0.77mi |
| 25846 Oak St Unit 13 Lomita, CA | 2.0 | 1.0 | 992 | $2,495 | $2.52 | 5d | 1 | 0.81mi |
| 3142 Newton St Torrance, CA | 2.0 | 1.5 | 975 | $2,752 | $2.82 | 7d | 1 | 0.92mi |
| 25326 Oak St Unit 1 Lomita, CA | 3.0 | 2.0 | 1300 | $3,650 | $2.81 | 43d | 1 | 0.95mi |
| 3305 Dalemead St Torrance, CA | 2.0 | 2.5 | 1000 | $4,150 | $4.15 | 43d | 1 | 1.02mi |
| 24836 Narbonne Ave Lomita, CA | 2.0 | 1.0 | 740 | $2,995 | $4.05 | 43d | 1 | 1.03mi |
| 2222 248th St Unit 2228 Lomita, CA | 3.0 | 2.0 | 1199 | $3,200 | $2.67 | 7d | 1 | 1.04mi |
| 25021 Oak St Lomita, CA | 3.0 | 2.0 | 1281 | $3,995 | $3.12 | 7d | 1 | 1.06mi |
| 25822 Walnut St Lomita, CA | 2.0 | 1.0 | 900 | $2,350 | $2.61 | 43d | 1 | 1.11mi |
| 2110 Palos Verdes Dr N #103 Lomita, CA | 2.0 | 2.0 | 1357 | $3,250 | $2.39 | 43d | 1 | 1.13mi |
| 24410 Crenshaw Blvd Torrance, CA | 2.0 | 2.0 | 1010 | $2,795 | $2.77 | 4d | 1 | 1.17mi |
| 25110 Eshelman Ave Lomita, CA | 2.0 | 1.5 | 800 | $2,245 | $2.81 | 10d | 1 | 1.19mi |
| 1918 252nd St Lomita, CA | 3.0 | 2.0 | 1488 | $3,900 | $2.62 | 43d | 1 | 1.21mi |
| 25018 Eshelman Ave Lomita, CA | 2.0 | 2.5 | 1400 | $3,295 | $2.35 | 43d | 1 | 1.23mi |
| 25018 Eshelman Ave Unit 9 Lomita, CA | 2.0 | 2.5 | 1400 | $3,295 | $2.35 | 24d | 1 | 1.23mi |
| 1800 255th St Unit 1812-A Lomita, CA | 2.0 | 1.0 | 750 | $2,145 | $2.86 | 43d | 1 | 1.28mi |
| 1724 260th St Lomita, CA | 2.0 | 2.0 | 1000 | $3,350 | $3.35 | 7d | 1 | 1.29mi |
| 3650 Newton St Torrance, CA | 2.0 | 1.5 | 950 | $3,400 | $3.58 | 24d | 1 | 1.31mi |
| 2457 Lomita Blvd Lomita, CA | 2.0 | 1.0–2.0 | 878 | $5,036 | $5.74 | 2d | 14 | 1.34mi |
| 24510 Park St Torrance, CA | 2.0 | 1.0 | 878 | $3,500 | $3.99 | 7d | 1 | 1.34mi |
| 24638 Eshelman Ave Unit 1/4 Lomita, CA | 2.0 | 1.0 | 950 | $2,950 | $3.11 | 43d | 1 | 1.37mi |
| 24636 Eshelman Ave Lomita, CA | 2.0 | 1.0 | 950 | $2,950 | $3.11 | 5d | 1 | 1.37mi |
| 1676 259th St Harbor City, CA | 2.0 | 1.0 | 1250 | $2,795 | $2.24 | 16d | 1 | 1.38mi |
| 25109 Ebony Ln Lomita, CA | 1.0 | 1.0 | 700 | $1,839 | $2.63 | 43d | 1 | 1.39mi |
| 1661 259th St Harbor City, CA | 1.0 | 1.0 | 800 | $1,995 | $2.49 | 15d | 1 | 1.43mi |
| 1732 251st St Lomita, CA | 3.0 | 1.0 | 1200 | $4,000 | $3.33 | 43d | 1 | 1.44mi |
| 2217 Estribo Dr Rolling Hills Estates, CA | 3.0 | 2.0 | 1000 | $6,600 | $6.60 | 43d | 1 | 1.48mi |
Listing history 20 events
-
2026-06-18days on market $179,000 Active 54 DOM
-
2026-06-17days on market $179,000 Active 53 DOM
-
2026-06-16days on market $179,000 Active 52 DOM
-
2026-06-15days on market $179,000 Active 51 DOM
-
2026-06-13days on market $179,000 Active 49 DOM
-
2026-06-13days on market $179,000 Active 48 DOM
-
2026-06-09days on market $179,000 Active 45 DOM
-
2026-06-08days on market $179,000 Active 44 DOM
-
2026-06-08remarks 693-char remark
-
2026-06-07days on market $179,000 Active 43 DOM
-
2026-06-04days on market $179,000 Active 40 DOM
-
2026-06-03days on market $179,000 Active 39 DOM
-
2026-06-02days on market $179,000 Active 38 DOM
-
2026-06-01days on market $179,000 Active 37 DOM
-
2026-05-31days on market $179,000 Active 36 DOM
-
2026-04-25$179,000 Active 646-char remark
-
2013-03-26historical 667-char remark
Show marketing remark (667 chars)
The Newest Listing at Skyline is a Fixer Upper Semi-Double Wide. Great Location in the Park. Needs some TLC. 1 Bedroom 1 Bath w/ a Popout that is used as a large living room and another bedroom. Skyline is a Senior Park and includes amenities such as a recreation center w/ pool, jacuizzi, billiard room w/ 2 pool tables, card room w/ lending book library and much more. Across the street from Rolling Hills Plaza center which offers Trader Joes, Whole Foods, many fine eateries & shops & theaters. There is close to 1000 sq. ft. Buyer to verify. There is a covered front deck that is approx 150 Sq. Ft. This Home is a short walk to the recreation center.
-
2013-03-26soldstatus $36,000 Closed 667-char remark
Show marketing remark (667 chars)
The Newest Listing at Skyline is a Fixer Upper Semi-Double Wide. Great Location in the Park. Needs some TLC. 1 Bedroom 1 Bath w/ a Popout that is used as a large living room and another bedroom. Skyline is a Senior Park and includes amenities such as a recreation center w/ pool, jacuizzi, billiard room w/ 2 pool tables, card room w/ lending book library and much more. Across the street from Rolling Hills Plaza center which offers Trader Joes, Whole Foods, many fine eateries & shops & theaters. There is close to 1000 sq. ft. Buyer to verify. There is a covered front deck that is approx 150 Sq. Ft. This Home is a short walk to the recreation center.
-
2013-01-22status Pending 667-char remark
Show marketing remark (667 chars)
The Newest Listing at Skyline is a Fixer Upper Semi-Double Wide. Great Location in the Park. Needs some TLC. 1 Bedroom 1 Bath w/ a Popout that is used as a large living room and another bedroom. Skyline is a Senior Park and includes amenities such as a recreation center w/ pool, jacuizzi, billiard room w/ 2 pool tables, card room w/ lending book library and much more. Across the street from Rolling Hills Plaza center which offers Trader Joes, Whole Foods, many fine eateries & shops & theaters. There is close to 1000 sq. ft. Buyer to verify. There is a covered front deck that is approx 150 Sq. Ft. This Home is a short walk to the recreation center.
-
2012-12-06$45,000 Active 667-char remark
Show marketing remark (667 chars)
The Newest Listing at Skyline is a Fixer Upper Semi-Double Wide. Great Location in the Park. Needs some TLC. 1 Bedroom 1 Bath w/ a Popout that is used as a large living room and another bedroom. Skyline is a Senior Park and includes amenities such as a recreation center w/ pool, jacuizzi, billiard room w/ 2 pool tables, card room w/ lending book library and much more. Across the street from Rolling Hills Plaza center which offers Trader Joes, Whole Foods, many fine eateries & shops & theaters. There is close to 1000 sq. ft. Buyer to verify. There is a covered front deck that is approx 150 Sq. Ft. This Home is a short walk to the recreation center.
ⓘ Source: listings_history table (triggers on properties + properties_extension) + one-shot
backfill from property_details.listing_events for pre-trigger history.
Tax reassessment forecast CA · Resets to sale price
- Current annual tax
- $1,060 · $88/mo
- Projected year-2 tax
- $1,360 · $113/mo
- Expected delta
- +$301/yr (+$25/mo · 28.4%)
ⓘ Screening estimate from a state-policy table — verify with the county assessor before closing.
Climate risk First Street
- Flood 1/10 Low FEMA zone X (unshaded) · 0% chance over 30 yrs
- Wildfire 1/10 Low
- Heat 3/10 Moderate 7 d/yr ≥86°F today · 22 d/yr by 30 yrs out
- Wind 1/10 Low
- Air quality 5/10 Major 7 unhealthy d/yr today · 7 by 30 yrs out
Nearby sold comps map
Loading sold comps map…
Walkable amenities ~0.75 mi
Loading nearby amenities…
Taxation est. · year 1
- Rental income
- $37,306
- − Mortgage interest
- −$10,027
- − Property taxes
- −$1,060
- − Insurance
- −$895
- − Repairs & maintenance
- −$2,984
- − Management
- −$2,984
- − Depreciation
- −$5,207
- Taxable income
- $14,148
- Est. tax owed @ 24.0%
- −$3,396
- After-tax cash flow
- $12,857/yr
For passive investors: Depreciation is non-cash, so a rental often shows a tax loss while cash-flowing — sheltering income. Rental losses are passive: they offset passive income freely, and up to $25,000/yr can offset ordinary (W-2) income if you actively participate and your MAGI is under $100k (phasing out to $0 by $150k); unused losses carry forward. On sale, claimed depreciation is recaptured at up to 25%, and gains may owe capital-gains tax (a 1031 exchange can defer both). Figures are a year-1 estimate at your 24.0% rate — not tax advice; consult a CPA.
Schools (NCES district)
- District
- Torrance Unified
- NCES district ID
- 0639420
- Math proficiency
- 62% ▲ 2.00%
- Reading proficiency
- 67% ▬ 0.00%
- Median HH income
- $78,640
- Composite
- 58.96/100
- National rank
- #1969
- State rank
- #150 of 1400 in CA
Livability — Torrance
- Score
- 76/100
- State rank
- #95
- US rank
- #3501
Category grades
Schools grade is shown separately in the Schools card above.
Census & demographics
- Census place
- Torrance, CA
- County
- Los Angeles County · 9,444,647 people
- City population
- 153,473
- Metro
- Los Angeles-Long Beach-Anaheim, CA
- Population (ZIP)
- 35,148
- Household income
- $115,593
- Rent vs Own
- Severe rent burden
- 1527.0
Population outlook (Los Angeles County) Hauer SSP2
- Today (2025)
- 10,940,515 people
- By 2030
- 11,256,481 · +2.9%
- By 2040
- 11,729,929 · +7.2%
- By 2050
- 11,948,407 · +9.2%
- By 2075
- 11,818,114 · +8.0%
- By 2100
- 10,842,928 · -0.9%
Race, ethnicity, and origin ACS 2023
- Neighborhood character
- Diverse neighborhood (Simpson 0.69)
- Race & ethnicity
- Asian 41% White 35% Hispanic / Latino 14% Two or more races 12% Black 3%
- Hispanic origin (detail)
- Mexican 8%
- Common ancestry
- Romanian 2% Portuguese 1% Slovak 1%
- Foreign-born
- 31% · South Korea, Canada, China
- Languages at home
- 60% English-only · Other Asian/Pacific 11% Korean 8% Spanish 7%
Political lean MEDSL · Los Angeles
- 2024 margin
- Solid D (+32.9) · D 64.8% · R 31.9% · Other 3.3%
- 2008→2024 swing
- -7.4pp toward R · 2008: 40.4pp · 2024: 32.9pp
- All cycles
- 2024: D+32.9 2020: D+44.2 2016: D+48.0 2012: D+40.0 2008: D+40.4
Not yet ingested
- Civics
- —
Market trends
- HPI YoY
- ▼ -906.04%
- Current HPI
- 352.4976
- Rent YoY
- ▲ 4.55%
- Metro
- Los Angeles-Long Beach-Anaheim, CA
- State GDP YoY
- ▲ 3.21%
- F500 in state
- 116
Industry mix (Fortune 500 HQ in CA)
| Industry | F500 HQs | Revenue |
|---|---|---|
| Technology | 27 | $1,492B |
|
||
| Financial Services | 3 | $174B |
|
||
| Retail | 3 | $44B |
|
||
| Insurance | 3 | $26B |
|
||
| Media / Entertainment | 2 | $115B |
|
||
| Pharmaceuticals / Biotech | 2 | $62B |
|
||
Price history
+297.8% since first listed5 events — show timeline
- 2026-04-25 Listed $179,000 CRMLS
- 2013-03-26 Listing Removed — CRMLS
- 2013-03-26 Sold (MLS) $36,000 CRMLS
- 2013-01-22 Pending — CRMLS
- 2012-12-06 Listed $45,000 CRMLS
Property tax history
+2.0%/yrLatest (2025): $1,060 · +2.0% YoY. Source: county tax records.
Cash-flow waterfall
monthlySold comps — $/sqft
last 12 mo · ≤1 miLoading sold comps…