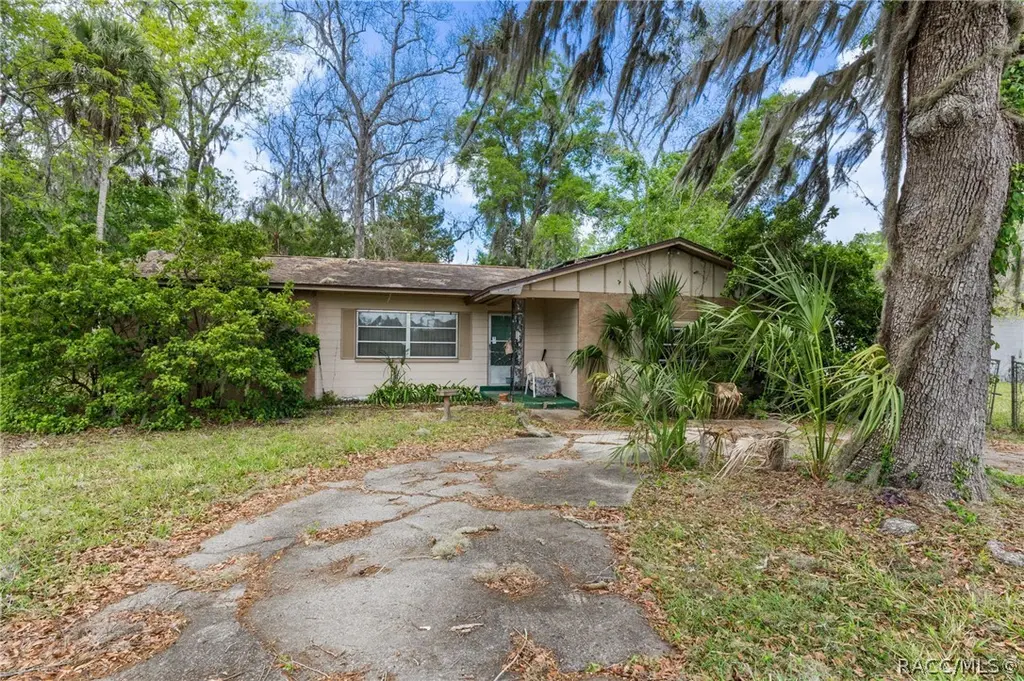
2040 NW 13th Ave · Crystal River, FL
Flood risk 10/10 · Severe
- FEMA flood zone
- AE
- Chance of flooding over 30 yrs
- 0.99%
- Est. flood insurance / yr
- $1,737 – $8,500
Fire risk 4/10 · Minor
- Est. fire insurance / yr
- $947 – $1,759
Heat risk 10/10 · Severe
- Hot days now (above 110°F)
- 7 days/yr
- Hot days in 30 yrs
- 26 days/yr
Wind risk 9/10 · Severe
- Chance of severe wind over 30 yrs
- 99.0%
Air-quality risk 1/10 · Minimal
- Unhealthy air days now
- 0 days/yr
- Unhealthy air days in 30 yrs
- 0 days/yr
Risk factors via First Street. Map © Google.
Why this score? — see what drove the B- grade
The composite is a weighted blend of 9 inputs, each scored 0–100. Each bar is that input's sub-score; the figure is the points it added to the 100-point composite (weight × sub-score).
- Cash flow +30.0/30.0
- DSCR +10.0/10.0
- 1% rule +9.0/10.0
- ARV discount +7.5/15.0
- Schools +4.1/10.0
- Livability +3.3/5.0
- Rent growth +2.5/5.0
- Condition / age +2.5/5.0
- Appreciation +0.0/10.0
$175,000
🖨 Deal sheet 📄 Offer letter ✓ Due diligence
Listing remarks
Great Opportunity in Crystal River! 3BR/2BA Flood-Damaged Home Ready for renovations. Located in a desirable Crystal River area near the river. Property has experienced flooding and requires repairs. If you are an investors, contractors, or buyers seeking a renovation project, this is the one for you. Features include a detached 22x39 garage with tall ceilings and a roll-up door, offering excellent workspace or storage potential. Additional features include a split floor plan, fenced yard, filled-in pool, existing hot tub (condition unknown), and a wood-burning freestanding stove. A roof-mounted solar system is present but not operational. Property is being sold AS-IS. Utilities will not be
Key facts
- Fenced yard
- Wood-burning stove
- Detached garage
Tags
Property features AI
Finance
- HOA & community: Community includes nearby restaurant
Exterior
- Parking: Detached 2-car garage; Circular driveway; Concrete driveway
- Utilities: Public water; Public sewer
- Home design: Single-family residence; 1 story
- Construction: Built with block and concrete; Block and slab foundation; Asphalt shingle roof
- Exterior features: Chain link fencing; Level lot; Paved city street frontage; Publicly maintained road; Garage(s) structure present
Interior
- Kitchen: Dishwasher; Electric oven; Electric range; Refrigerator
- Bedrooms: Master downstairs
- Flooring: Tile
- Bathrooms: 2 full bathrooms
- Heating & cooling: Central heating (electric); Central air conditioning
- Interior features: Laminate counters; Master suite on main level; Drapes and window treatments; Wood-burning fireplace
- Laundry & utility: Washer; Dryer; Water heater
Neighborhood map
What this means for you Summary
Snapshot
- This is a 3-bed/2.0-bath single-family listed at $175k.
Deal economics
- At list price, monthly cash flow is $468 ($6k/yr) — positive.
- The deal already cash-flows at list — no discount required.
- Meets the 1% rule at list price ($2k rent vs $175k).
- Cap rate 12.4% vs local median 2.1% in Crystal River — top-decile yield for the area; either an underpriced asset or a hidden risk that comps aren't pricing in. Stress-test before assuming the spread holds.
Location & tenants
- Location reads 66/100 on livability (#603 in FL) — a middle-class / working-renter tenant base. Strengths: crime A+, cost of living A+; Watch: health & safety C-, amenities F, commute F.
- Citrus (rural): math 49% / reading 50% proficiency, ranked #44 of 73 in FL (top 60%) — families likely to look elsewhere, expect single-tenant / working-renter base with shorter leases.
- Zoned schools: Crystal River Primary School (math 45% / reading 55%, grade D+, #1,070 of 2,144 statewide, top 51%, 654 students, 70% FRL); Crystal River Middle School (math 49% / reading 47%, grade C-, #286 of 571 statewide, top 50%, 900 students, 64% FRL); Crystal River High School (math 31% / reading 44%, grade F, #336 of 667 statewide, top 51%, 1,249 students, 56% FRL).
- Market conditions: 320 active listings in the ZIP; 4 comparable units currently listed for rent nearby; rentals at typical pace (median 21d on market — plan ~3-4 weeks tenant-placement turnaround); 2,443 units permitted in Citrus County in 2024 (0 in 5+ unit buildings).
- At $2,447/mo this rent would consume 58% of the median local household income ($51k/yr) (locally 264% of renters already pay >50% of income on rent) — very limited rent-growth headroom before tenants either downsize or default.
Forward outlook
- Local home prices are declining (-3.0%/yr); year-one equity from $1k of loan paydown is wiped out by about $5k of value loss. Plan a longer hold.
- Citrus County population projected to shrink 10% by 2050 — rents likely to lag national; underwrite the cash flow, not the appreciation.
- At projected returns (-3.0% appreciation + 3.0% rent growth), your $49k cash investment doubles in ~10 years — after that, you're playing with house money.
Negotiation context
- Only 13 days on market — expect competitive offers; lowballing is unlikely to land.
- 2 sale attempts with the ask held roughly flat each time — persistent listings suggest the price (not the market) is what's stuck; bring a comps-based counter.
- Current owner paid $65k; list at $175k implies a 169% gain — meaningful room to come down on a strong offer.
Risks & watch-outs
- Watch-outs: flood insurance adds $427/mo.
- Climate carrying-cost: in FEMA flood zone AE (mandatory federal flood insurance); severe wind risk, 99% chance of damaging wind over 30y; extreme-heat days projected 7→26/yr by 2055 (HVAC capex compounding) — expect insurance premiums to compound above CPI over the hold.
Questions for the listing agent
- Built in 1974 — when were the roof, HVAC, electrical panel, plumbing, and water heater last replaced?
- What's the actual annual flood-insurance premium (NFIP or private), and is the property in a SFHA with mandatory coverage?
- Is there a deadline driving the sale (1031 exchange, divorce, estate, relocation)? That informs how much negotiation room exists.
- Schools are D-rated, which usually means shorter tenancies and higher turnover. Who's the typical renter profile here, and what's been the actual vacancy rate?
- What's the average days-on-market for RENTAL listings here right now (not sales)? A rising rental-DOM trend means longer vacancies and softer asking-rent achievability than the comps imply.
- What's the recent tenant-quality profile in this submarket — average credit score on applications, eviction rate, late-payment / NSF rate, and stable-employment percentage? A property-management company in the area should have these aggregated.
- How much new for-sale + rental construction is in the pipeline within 1–3 miles? Heavy new supply typically softens prices + rents 12–24 months out; constrained supply supports both.
Investment metrics
- 1% rule
- 1.40% ✓
- Cap rate
- 12.43%
- Cash-on-cash
- 21.90%
- DSCR
- 1.97
- GRM
- 6.0
CMA / ARV
- ARV (on-the-fly)
- $549,328
- Comps found
- 12
Show comp detail 12 sales within ~0.75 mi
| Address | Dist | Beds/Ba | Sqft | Sold | Price | $/sf | Match |
|---|---|---|---|---|---|---|---|
| 2040 NW 13th Ave | 0.00mi | 3/2.0 | 1,976 (0%) | 1mo | $125,000 | $63 | 99 |
| 3831 N Ringdove Pt | 0.17mi | 3/2.5 | 1,875 (-5%) | 8mo | $600,000 | $320 | 74 |
| 4060 & 4072 N Little Hawk Pt | 0.43mi | 3/2.5 | 1,969 (-0%) | 9mo | $166,000 | $84 | 70 |
| 1851 NW 18th St | 0.62mi | 3/2.5 | 1,992 (+1%) | 0mo | $575,000 | $289 | 68 |
| 4030 N Sun Dance Pt | 0.44mi | 3/2.0 | 1,803 (-9%) | 7mo | $302,500 | $168 | 59 |
| 3926 N Eagle Pt | 0.31mi | 3/2.0 | 1,714 (-13%) | 6mo | $575,000 | $335 | 58 |
| 3850 N Nokomis Pt | 0.32mi | 3/2.0 | 2,194 (+11%) | 15mo | $350,000 | $160 | 54 |
| 1860 NW 16th St | 0.72mi | 3/2.0 | 1,920 (-3%) | 9mo | $610,000 | $318 | 54 |
| 1930 NW 18th St | 0.69mi | 3/2.0 | 2,048 (+4%) | 11mo | $1,035,000 | $505 | 53 |
| 11124 W Thoreau Pl | 0.70mi | 3/2.0 | 1,757 (-11%) | 9mo | $330,000 | $188 | 42 |
| 1758 NW 17th Ct | 0.56mi | 3/2.0 | 1,800 (-9%) | 23mo | $500,000 | $278 | 40 |
| 1750 NW 17th Ct | 0.59mi | 3/2.0 | 1,728 (-13%) | 21mo | $445,000 | $258 | 34 |
Match score weights: distance 35% · size 25% · config 20% · recency 20%. Top-matched comps best support the ARV.
Projected returns pro-forma
-3.0% appreciation · 3.0% rent growth · sell at horizon
- IRR
- 0.9%
- Equity multiple
- 1.03×
- Total profit
- $1,637
- Equity at exit
- $26,093
- IRR
- 10.6%
- Equity multiple
- 1.83×
- Total profit
- $40,587
- Equity at exit
- $15,131
Cash invested: $49,000 (down + closing). Projections, not guarantees.
Landlord ↔ Tenant lean methodology
- Overall (STATE)
- 87 Strongly Landlord-Friendly
- State Florida
- 87 Strongly Landlord-Friendly · R+3
- County
- — inherits STATE
- City
- — inherits STATE
ZIP-level market 34428
- Home prices YoY
- -15.3%
- Active inventory
- 320
- Price-to-rent
- 6.0×
Monthly cashflow live
- Estimated rent
- $2,447 medium interval (Pro) →
- Mortgage (P&I)
- −$918
- Tax from tax record
- −$48 /mo · $573/yr
- Insurance
- −$73
- Flood insurance flood zone
- −$427 /mo · $5,118/yr
- HOA
- −$0
- Vacancy / Maint / Mgmt
- −$514
- Net cashflow
- $468
Break-even live
UW: 25.0% down · 7.5% · 30yr · 1.5% tax · 5.0% vac · 8.0% maint · 8.0% mgmt
Financing live
Cash to close
- Down payment
- $43,750
- Closing costs
- $5,250
- Reserves months
- —
- Total cash needed
- —
Loan-product check · same deal, 3 products live
Conventional
25% down · 7.5% · 30yr
- Down + closing
- —
- Monthly P&I
- —
- Monthly cashflow
- —
- DSCR
- —
- Eligible?
- —
Personal DTI + credit; lowest rate.
DSCR
20% down · 8.5% · 30yr
- Down + closing
- —
- Monthly P&I
- —
- Monthly cashflow
- —
- DSCR
- —
- Eligible?
- —
No personal income docs; deal must DSCR.
Hard money
10% down · 12.0% · 12mo
- Down + closing
- —
- Monthly P&I
- —
- Monthly cashflow
- —
- DSCR
- —
- Eligible?
- —
Short-term bridge; refi at stabilization.
Rent comps 4 comps
| Address | Beds | Baths | Sqft | Rent | $/sqft | DOM | Units | Dist |
|---|---|---|---|---|---|---|---|---|
| 1701 NW 22nd St Crystal River, FL | 3.0 | 2.0 | 1537 | $2,100 | $1.37 | 21d | 1 | 0.34mi |
| 10785 W Spring Cir Crystal River, FL | 3.0 | 2.0 | 1344 | $1,600 | $1.19 | 21d | 1 | 0.42mi |
| 10906 W Cove Harbor Dr Crystal River, FL | 2.0 | 2.0 | 1409 | $2,950 | $2.09 | 21d | 1 | 0.43mi |
| 373 NW 14th Pl Crystal River, FL | 2.0 | 2.0 | 1422 | $3,000 | $2.11 | 21d | 1 | 1.31mi |
Listing history 8 events
-
2026-05-03status Pending
-
2026-04-23status Active
-
2026-04-16status Pending
-
2026-04-13$175,000 Active
-
1995-11-01soldstatus $65,000
-
1983-06-01soldstatus $79,500
-
1980-11-01soldstatus $55,000
-
1978-08-01soldstatus $37,700
ⓘ Source: listings_history table (triggers on properties + properties_extension) + one-shot
backfill from property_details.listing_events for pre-trigger history.
Tax reassessment forecast FL · Resets to sale price
- Current annual tax
- $573 · $48/mo
- Projected year-2 tax
- $1,452 · $121/mo
- Expected delta
- +$879/yr (+$73/mo · 153.4%)
ⓘ Screening estimate from a state-policy table — verify with the county assessor before closing.
Climate risk First Street
- Flood 10/10 Extreme FEMA zone AE · 99% chance over 30 yrs
- Wildfire 4/10 Moderate
- Heat 10/10 Extreme 7 d/yr ≥110°F today · 26 d/yr by 30 yrs out
- Wind 9/10 Extreme 99% chance of damaging wind over 30 yrs
- Air quality 1/10 Low 0 unhealthy d/yr today · 0 by 30 yrs out
Nearby sold comps map
Loading sold comps map…
Walkable amenities ~0.75 mi
Loading nearby amenities…
Taxation est. · year 1
- Rental income
- $29,360
- − Mortgage interest
- −$9,803
- − Property taxes
- −$573
- − Insurance
- −$5,994
- − Repairs & maintenance
- −$2,349
- − Management
- −$2,349
- − Depreciation
- −$5,091
- Taxable income
- $3,202
- Est. tax owed @ 24.0%
- −$768
- After-tax cash flow
- $4,846/yr
For passive investors: Depreciation is non-cash, so a rental often shows a tax loss while cash-flowing — sheltering income. Rental losses are passive: they offset passive income freely, and up to $25,000/yr can offset ordinary (W-2) income if you actively participate and your MAGI is under $100k (phasing out to $0 by $150k); unused losses carry forward. On sale, claimed depreciation is recaptured at up to 25%, and gains may owe capital-gains tax (a 1031 exchange can defer both). Figures are a year-1 estimate at your 24.0% rate — not tax advice; consult a CPA.
Schools (NCES district)
- District
- Citrus
- NCES district ID
- 1200270
- Math proficiency
- 49% ▼ -10.00%
- Reading proficiency
- 50% ▼ -6.00%
- Median HH income
- $38,618
- Composite
- 41.28/100
- National rank
- #3519
- State rank
- #44 of 73 in FL
Livability — Crystal River
- Score
- 66/100
- State rank
- #603
- US rank
- #11564
Category grades
Schools grade is shown separately in the Schools card above.
Census & demographics
- Census place
- Crystal River, FL
- County
- Citrus County · 111,314 people
- City population
- 10,163
- Metro
- Homosassa Springs, FL
- Population (ZIP)
- 10,163
- Household income
- $50,779
- Rent vs Own
- Severe rent burden
- 264.0
Population outlook (Citrus County) Hauer SSP2
- Today (2025)
- 138,622 people
- By 2030
- 136,886 · -1.3%
- By 2040
- 132,009 · -4.8%
- By 2050
- 125,196 · -9.7%
- By 2075
- 108,570 · -21.7%
- By 2100
- 84,454 · -39.1%
Race, ethnicity, and origin ACS 2023
- Neighborhood character
- Predominantly White (88%)
- Race & ethnicity
- White 88% Two or more races 6% Hispanic / Latino 5% Asian 2%
- Common ancestry
- Lithuanian 3% Romanian 3% Slovak 2%
- Foreign-born
- 5% · Canada, Jamaica, South Korea
- Languages at home
- 96% English-only · Spanish 3%
Political lean MEDSL · Citrus
- 2024 margin
- Solid R (+45.9) · D 26.8% · R 72.6%
- 2008→2024 swing
- -29.8pp toward R · 2008: -16.1pp · 2024: -45.9pp
- All cycles
- 2024: R+45.9 2020: R+41.0 2016: R+39.7 2012: R+21.9 2008: R+16.1
Not yet ingested
- Civics
- —
Market trends
- HPI YoY
- ▼ -57.32%
- Current HPI
- 317.7637
- Rent YoY
- —
- Metro
- Homosassa Springs, FL
- State GDP YoY
- ▲ 3.28%
- F500 in state
- 36
Industry mix (Fortune 500 HQ in FL)
| Industry | F500 HQs | Revenue |
|---|---|---|
| Industrial Technology | 2 | $29B |
|
||
| Insurance | 2 | $17B |
|
||
| Retail | 1 | $60B |
|
||
| Technology Distribution | 1 | $58B |
|
||
| Homebuilding | 1 | $35B |
|
||
| Technology Manufacturing | 1 | $35B |
|
||
Price history
+364.2% since first listed8 events — show timeline
- 2026-05-03 Pending — RACC
- 2026-04-23 Relisted — RACC
- 2026-04-16 Pending — RACC
- 2026-04-13 Listed $175,000 RACC
- 1995-11-01 Sold (Public Records) $65,000 Public Records
- 1983-06-01 Sold (Public Records) $79,500 Public Records
- 1980-11-01 Sold (Public Records) $55,000 Public Records
- 1978-08-01 Sold (Public Records) $37,700 Public Records
Property tax history
-1.5%/yrLatest (2025): $573 · +4.7% YoY. Source: county tax records.
Cash-flow waterfall
monthlySold comps — $/sqft
last 12 mo · ≤1 miLoading sold comps…