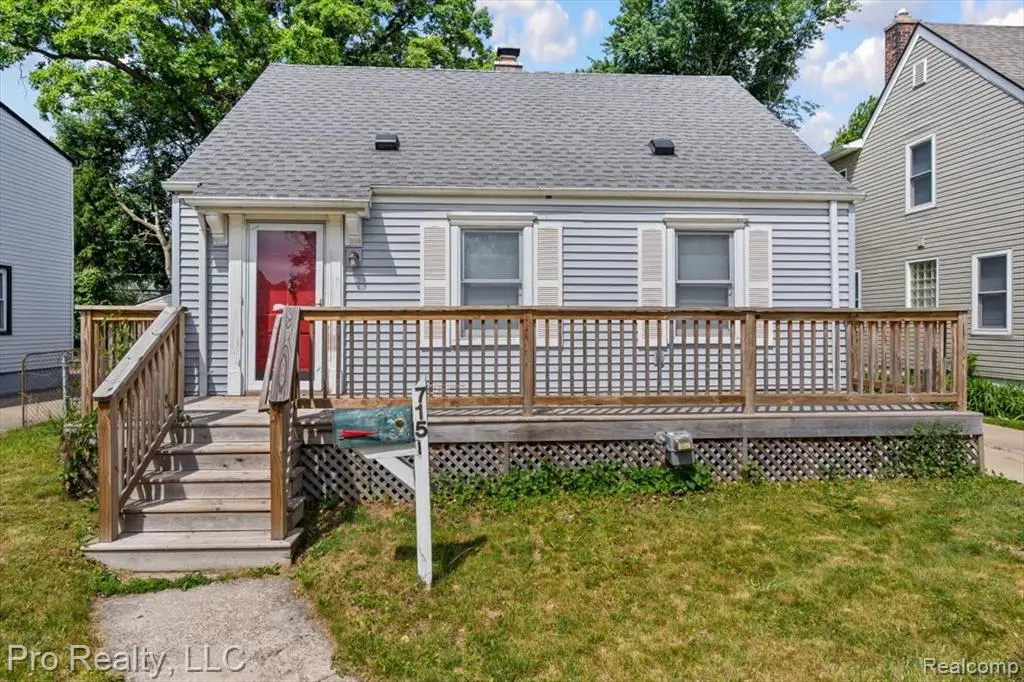
715 N Altadena Ave · Royal Oak, MI
Flood risk 1/10 · Minimal
- FEMA flood zone
- X (unshaded)
- Chance of flooding over 30 yrs
- 0.0%
- Est. flood insurance / yr
- $507 – $1,088
Fire risk 1/10 · Minimal
- Est. fire insurance / yr
- $784 – $1,456
Heat risk 2/10 · Minimal
- Hot days now (above 98°F)
- 7 days/yr
- Hot days in 30 yrs
- 15 days/yr
Wind risk 2/10 · Minimal
- Chance of severe wind over 30 yrs
- —
Air-quality risk 3/10 · Minor
- Unhealthy air days now
- 3 days/yr
- Unhealthy air days in 30 yrs
- 5 days/yr
Risk factors via First Street. Map © Google.
Why this score? — see what drove the C- grade
The composite is a weighted blend of 9 inputs, each scored 0–100. Each bar is that input's sub-score; the figure is the points it added to the 100-point composite (weight × sub-score).
- ARV discount +15.0/15.0
- Cash flow +13.2/30.0
- Schools +4.4/10.0
- Livability +4.2/5.0
- DSCR +4.0/10.0
- 1% rule +3.9/10.0
- Rent growth +3.7/5.0
- Condition / age +2.5/5.0
- Appreciation +0.0/10.0
$289,900
🖨 Deal sheet (PDF) 📄 Offer letter ✓ Due diligence
Listing remarks MLS
Charming Bungalow nestled on a beautiful street in the heart of Royal Oak. Minutes from downtown. Nice open layout from the kitchen to the dining area. Hardwood floors are exposed throughout the home and the basement offers an additional half bath a Nice fenced yard.
Key facts
- Fenced yard
- Open layout
- Hardwood floors
Tags
Property features AI
Exterior
- Parking: Detached 1-car garage
- Utilities: Public water; Public sewer
- Home design: Single family residence; One and one-half stories; Ground-level entry
- Construction: Vinyl siding; Block foundation
- Exterior features: Paved road access; Lot approximately 0.13 acres (45 x 126)
Interior
- Bathrooms: 1 full bathroom; 1 half bathroom
- Heating & cooling: Forced air heating (natural gas); No cooling
- Interior features: Partially finished basement; Basement present
Neighborhood map
What this means for you Summary
Snapshot
- This is a 3-bed/1.0-bath single-family listed at $290k.
Deal economics
- At list price, monthly cash flow is $-7 ($-87/yr) — negative.
- To cash-flow at today's rent, offer at most $289k (0.4% below list).
- To meet the 1% rule (rent ≥ 1% of price), the offer needs to be $257k (11.3% below list).
- Recommended offer: $257k (11.3% below list) — sets the bar for 1% rule.
- Cap rate 6.3% vs local median 3.7% in Royal Oak — top-decile yield for the area; either an underpriced asset or a hidden risk that comps aren't pricing in. Stress-test before assuming the spread holds.
Location & tenants
- Location reads 83/100 on livability (#50 in MI, #1,020 nationally) — a professional / high-income tenant draw. Strengths: crime A+, commute A+, employment A+; Watch: amenities D+.
- Royal Oak Schools (suburban): math 41% / reading 59% proficiency, ranked #89 of 540 in MI (top 16%) — acceptable for families but not a draw, mixed tenant base, ~2y average lease; only 20% free/reduced lunch — higher-income household profile.
- Zoned schools: Keller Elementary (math 27% / reading 52%, grade F, #606 of 1,397 statewide, top 48%, 440 students, 23% FRL); Royal Oak Middle School (math 35% / reading 56%, grade D+, #161 of 493 statewide, top 33%, 1,060 students, 28% FRL); Royal Oak High School (math 49% / reading 75%, grade B-, #58 of 713 statewide, top 9%, 1,341 students, 26% FRL).
- Market conditions: Rents rising fast (+4.7%/yr); 217 active listings in the ZIP; 29 comparable units currently listed for rent nearby; rentals leasing fast (median 5d on market — plan ~1-2 weeks tenant-placement turnaround); high-income renter base; 2,614 units permitted in Oakland County in 2024 (721 in 5+ unit buildings).
Forward outlook
- Local home prices are declining (-3.0%/yr); year-one equity from $2k of loan paydown is wiped out by about $9k of value loss. Plan a longer hold.
- Oakland County population projected at +10% by 2050 — modest demand growth; plan on rents tracking national, not racing it.
Negotiation context
- Only 6 days on market — expect competitive offers; lowballing is unlikely to land.
- 7 sale attempts since 22y ago with the ask held roughly flat each time — persistent listings suggest the price (not the market) is what's stuck; bring a comps-based counter.
- Current owner paid $109k; list at $290k implies a 166% gain — meaningful room to come down on a strong offer.
Risks & watch-outs
- Watch-outs: built in 1939 — expect roof / HVAC / electrical / plumbing capex.
Questions for the listing agent
- What do current leases actually rent for vs. the listed asking? Can we see a recent rent roll and the last 12 months of T-12 income?
- Built in 1939 — when were the roof, HVAC, electrical panel, plumbing, and water heater last replaced?
- Is there a deadline driving the sale (1031 exchange, divorce, estate, relocation)? That informs how much negotiation room exists.
- Schools are B-rated — typically a magnet for longer-tenancy family renters. What's the average tenant stay here, and is there a school-zone premium baked into asking?
- What's the average days-on-market for RENTAL listings here right now (not sales)? A rising rental-DOM trend means longer vacancies and softer asking-rent achievability than the comps imply.
- What's the recent tenant-quality profile in this submarket — average credit score on applications, eviction rate, late-payment / NSF rate, and stable-employment percentage? A property-management company in the area should have these aggregated.
- How much new for-sale + rental construction is in the pipeline within 1–3 miles? Heavy new supply typically softens prices + rents 12–24 months out; constrained supply supports both.
Investment metrics
- 1% rule
- 0.89% ✗
- Cap rate
- 6.26%
- Cash-on-cash
- -0.11%
- DSCR
- 1.00
- GRM
- 9.4
CMA / ARV
- ARV (on-the-fly)
- $393,792
- Comps found
- 12
Show comp detail 12 sales within ~0.75 mi
| Address | Dist | Beds/Ba | Sqft | Sold | Price | $/sf | Match |
|---|---|---|---|---|---|---|---|
| 606 N Alexander Ave | 0.09mi | 3/2.0 | 1,809 (+3%) | 1mo | $367,000 | $203 | 86 |
| 715 N Altadena Ave | 0.00mi | 3/1.5 | 1,536 (-13%) | 0mo | $275,000 | $179 | 77 |
| 511 Gardenia Ave | 0.35mi | 3/2.0 | 1,717 (-2%) | 1mo | $421,000 | $245 | 75 |
| 506 N Altadena Ave | 0.14mi | 3/2.0 | 1,572 (-11%) | 0mo | $352,000 | $224 | 72 |
| 201 N Rembrandt Ave | 0.33mi | 3/1.0 | 1,926 (+10%) | 1mo | $335,000 | $174 | 68 |
| 418 N Blair Ave | 0.25mi | 3/1.5 | 1,972 (+12%) | 1mo | $405,000 | $205 | 65 |
| 515 Potter Ave | 0.20mi | 3/2.0 | 1,983 (+13%) | 1mo | $495,000 | $250 | 64 |
| 233 Gardenia Ave | 0.48mi | 2/1.5 (-1) | 1,679 (-4%) | 1mo | $390,000 | $232 | 62 |
| 900 N Edison Ave | 0.54mi | 3/1.0 | 1,623 (-8%) | 0mo | $315,000 | $194 | 62 |
| 923 N Center St | 0.66mi | 3/1.5 | 1,829 (+4%) | 1mo | $465,000 | $254 | 60 |
| 334 Marlin Ave | 0.64mi | 3/2.0 | 1,638 (-7%) | 1mo | $335,000 | $205 | 54 |
| 1617 N Vermont Ave | 0.57mi | 3/2.0 | 1,587 (-10%) | 0mo | $420,000 | $265 | 53 |
Match score weights: distance 35% · size 25% · config 20% · recency 20%. Top-matched comps best support the ARV.
Projected returns pro-forma
-3.0% appreciation · 4.72% rent growth · sell at horizon
- IRR
- -14.5%
- Equity multiple
- 0.47×
- Total profit
- $-42,848
- Equity at exit
- $43,225
- IRR
- -3.1%
- Equity multiple
- 0.77×
- Total profit
- $-18,414
- Equity at exit
- $25,065
Cash invested: $81,172 (down + closing). Projections, not guarantees.
Landlord ↔ Tenant lean methodology
- Overall (STATE)
- 62 Landlord-Friendly
- State Michigan
- 62 Landlord-Friendly · EVEN
- County
- — inherits STATE
- City
- — inherits STATE
ZIP-level market 48067
- Rents YoY
- 4.7%
- Active inventory
- 217
- Price-to-rent
- 9.4×
Monthly cashflow live
- Estimated rent
- $2,572 high interval (Pro) →
- Mortgage (P&I)
- −$1,520
- Tax from tax record
- −$398 /mo · $4,777/yr
- Insurance
- −$121
- HOA
- −$0
- Vacancy / Maint / Mgmt
- −$540
- Net cashflow
- $-7
Break-even live
Sensitivity live
| Price | -10% $157 | -5% $75 | +0% $-7 | +5% $-89 | +10% $-171 |
|---|---|---|---|---|---|
| Rent | -10% $-210 | -5% $-109 | +0% $-7 | +5% $94 | +10% $196 |
| Rate | -1.0pp $139 | -0.5pp $67 | base $-7 | +0.5pp $-82 | +1.0pp $-159 |
UW: 25.0% down · 7.5% · 30yr · 1.5% tax · 5.0% vac · 8.0% maint · 8.0% mgmt
Financing live
Cash to close
- Down payment
- $72,475
- Closing costs
- $8,697
- Reserves months
- —
- Total cash needed
- —
Loan-product check · same deal, 3 products live
Conventional
25% down · 7.5% · 30yr
- Down + closing
- —
- Monthly P&I
- —
- Monthly cashflow
- —
- DSCR
- —
- Eligible?
- —
Personal DTI + credit; lowest rate.
DSCR
20% down · 8.5% · 30yr
- Down + closing
- —
- Monthly P&I
- —
- Monthly cashflow
- —
- DSCR
- —
- Eligible?
- —
No personal income docs; deal must DSCR.
Hard money
10% down · 12.0% · 12mo
- Down + closing
- —
- Monthly P&I
- —
- Monthly cashflow
- —
- DSCR
- —
- Eligible?
- —
Short-term bridge; refi at stabilization.
Rent comps 29 comps
| Address | Beds | Baths | Sqft | Rent | $/sqft | DOM | Units | Dist |
|---|---|---|---|---|---|---|---|---|
| 709 Hawthorn Ave Royal Oak, MI | 3.0 | 1.5 | 2248 | $3,000 | $1.33 | 26d | 1 | 0.22mi |
| 1106 Grove Ave Royal Oak, MI | 4.0 | 2.5 | 1289 | $2,325 | $1.80 | 0d | 1 | 0.41mi |
| 406 N Campbell Rd Royal Oak, MI | 3.0 | 2.0 | 1814 | $2,500 | $1.38 | 0d | 1 | 0.48mi |
| 1132 N Campbell Rd Royal Oak, MI | 2.0–3.0 | 1.0–1.5 | 1125 | $2,085 | $1.85 | 1d | 8 | 0.57mi |
| 617 E 3rd St Royal Oak, MI | 4.0 | 2.5 | 2225 | $3,100 | $1.39 | 1d | 1 | 0.58mi |
| 508 Marlin Ave Royal Oak, MI | 3.0 | 2.5 | 1678 | $3,000 | $1.79 | 22d | 1 | 0.59mi |
| 615 E 5th St Royal Oak, MI | 4.0 | 3.0 | 1329 | $3,000 | $2.26 | 26d | 1 | 0.67mi |
| 118 N Main St Royal Oak, MI | 3.0 | 1.0–3.0 | 1432 | $6,200 | $4.33 | 0d | 4 | 0.68mi |
| 211 Woodsboro Dr Unit LOWER Royal Oak, MI | 3.0 | 2.0 | 1800 | $1,425 | $0.79 | 26d | 1 | 0.77mi |
| 215 Woodsboro Dr Royal Oak, MI | 3.0 | 2.0 | 2542 | $2,200 | $0.87 | 6d | 1 | 0.77mi |
| 1414 Crooks Rd Unit 2 Royal Oak, MI | 3.0 | 2.0 | 1400 | $1,800 | $1.29 | 26d | 1 | 0.78mi |
| 325 E 6th St Unit 325-10 Royal Oak, MI | 2.0 | 1.5 | 1400 | $1,895 | $1.35 | 7d | 1 | 0.80mi |
| 100 W 5th St Royal Oak, MI | 2.0 | 2.0 | 1283 | $3,015 | $2.35 | 7d | 2 | 0.88mi |
| 674 W Eleven Mile Rd Unit 4B Royal Oak, MI | 2.0 | 2.5 | 1577 | $2,700 | $1.71 | 12d | 1 | 1.02mi |
| 642 Bellaire Ave Madison Heights, MI | 3.0 | 2.5 | 1750 | $2,423 | $1.38 | 23d | 1 | 1.07mi |
| 1723 Edgewood Dr Unit Labs Royal Oak, MI | 3.0 | 3.0 | 1451 | $3,000 | $2.07 | 7d | 1 | 1.08mi |
| 610 W 4th St Royal Oak, MI | 3.0 | 2.5 | 1700 | $2,400 | $1.41 | 0d | 1 | 1.08mi |
| 1031 N Sherman Dr Unit A Royal Oak, MI | 3.0 | 2.5 | 1500 | $3,000 | $2.00 | 3d | 1 | 1.21mi |
| 1016 Greenleaf Dr Royal Oak, MI | 4.0 | 2.5 | 2249 | $2,950 | $1.31 | 7d | 1 | 1.22mi |
| 1100 S Main St Royal Oak, MI | 1.0–2.0 | 1.0–2.0 | 1179 | $6,000 | $5.09 | 0d | 3 | 1.22mi |
| 927 Cedarhill Dr Royal Oak, MI | 4.0 | 2.5 | 1620 | $2,500 | $1.54 | 26d | 1 | 1.24mi |
| 1414 Owana Ave Royal Oak, MI | 3.0 | 1.0 | 1489 | $1,675 | $1.12 | 23d | 1 | 1.27mi |
| 1605 Anne Dr Royal Oak, MI | 2.0 | 3.5 | 1814 | $2,900 | $1.60 | 4d | 1 | 1.33mi |
| 1572 Maryland Club Dr Royal Oak, MI | 2.0 | 2.0 | 1477 | $2,450 | $1.66 | 5d | 1 | 1.35mi |
| 2702 N Main St Royal Oak, MI | 3.0 | 1.5 | 1500 | $2,350 | $1.57 | 4d | 1 | 1.38mi |
| 1337 S Washington Ave Royal Oak, MI | 2.0 | 2.0 | 1380 | $2,350 | $1.70 | 0d | 1 | 1.42mi |
| 159 Allenhurst Ave Royal Oak, MI | 3.0 | 2.0 | 1955 | $2,700 | $1.38 | 0d | 1 | 1.43mi |
| 160 Tiffany Ln Royal Oak, MI | 3.0 | 2.0 | 2275 | $3,000 | $1.32 | 0d | 1 | 1.46mi |
| 25090 Woodward Ave Royal Oak, MI | 1.0–3.0 | 1.0–2.5 | 1139 | $4,195 | $3.68 | 0d | 11 | 1.49mi |
Listing history 5 events
-
2026-06-13statusdays on market $289,900 Pending 6 DOM
-
2026-06-09days on market $289,900 Active 4 DOM
-
2026-06-08days on market $289,900 Active 3 DOM
-
2026-06-07remarks 267-char remark
-
2026-06-07$289,900 Active 2 DOM
ⓘ Source: listings_history table (triggers on properties + properties_extension) + one-shot
backfill from property_details.listing_events for pre-trigger history.
Tax reassessment forecast MI · Partial reset (capped growth)
- Current annual tax
- $4,777 · $398/mo
- Projected year-2 tax
- $4,777 · $398/mo
- Expected delta
- $0/yr ($0/mo · 0.0%)
ⓘ Screening estimate from a state-policy table — verify with the county assessor before closing.
Climate risk First Street
- Flood 1/10 Low FEMA zone X (unshaded) · 0% chance over 30 yrs
- Wildfire 1/10 Low
- Heat 2/10 Low 7 d/yr ≥98°F today · 15 d/yr by 30 yrs out
- Wind 2/10 Low
- Air quality 3/10 Moderate 3 unhealthy d/yr today · 5 by 30 yrs out
Nearby sold comps map
Loading sold comps map…
Walkable amenities ~0.75 mi
Loading nearby amenities…
Taxation est. · year 1
- Rental income
- $30,864
- − Mortgage interest
- −$16,239
- − Property taxes
- −$4,777
- − Insurance
- −$1,450
- − Repairs & maintenance
- −$2,469
- − Management
- −$2,469
- − Depreciation
- −$8,433
- Taxable loss
- −$4,973
- Est. tax savings @ 24.0%
- +$1,193
- After-tax cash flow
- $1,107/yr
For passive investors: Depreciation is non-cash, so a rental often shows a tax loss while cash-flowing — sheltering income. Rental losses are passive: they offset passive income freely, and up to $25,000/yr can offset ordinary (W-2) income if you actively participate and your MAGI is under $100k (phasing out to $0 by $150k); unused losses carry forward. On sale, claimed depreciation is recaptured at up to 25%, and gains may owe capital-gains tax (a 1031 exchange can defer both). Figures are a year-1 estimate at your 24.0% rate — not tax advice; consult a CPA.
Schools (NCES district)
- District
- Royal Oak Schools
- NCES district ID
- 2630300
- Math proficiency
- 41% ▼ -10.00%
- Reading proficiency
- 59% ▼ -3.00%
- Median HH income
- $65,456
- Composite
- 44.19/100
- National rank
- #2853
- State rank
- #89 of 540 in MI
Livability — Royal Oak
- Score
- 83/100
- State rank
- #50
- US rank
- #1020
Category grades
Schools grade is shown separately in the Schools card above.
Census & demographics
- Census place
- Royal Oak, MI
- County
- Oakland County · 1,009,092 people
- City population
- 57,974
- Metro
- Detroit-Warren-Dearborn, MI
- Population (ZIP)
- 24,868
- Household income
- $112,840
- Rent vs Own
- Severe rent burden
- 625.0
Population outlook (Oakland County) Hauer SSP2
- Today (2025)
- 1,335,747 people
- By 2030
- 1,375,100 · +2.9%
- By 2040
- 1,435,385 · +7.5%
- By 2050
- 1,469,250 · +10.0%
- By 2075
- 1,531,946 · +14.7%
- By 2100
- 1,450,485 · +8.6%
Race, ethnicity, and origin ACS 2023
- Neighborhood character
- Predominantly White (82%)
- Race & ethnicity
- White 82% Hispanic / Latino 7% Two or more races 7% Black 3% Asian 3%
- Hispanic origin (detail)
- Mexican 3%
- Common ancestry
- Romanian 12% Lithuanian 4% Slovak 4%
- Foreign-born
- 7% · Canada, China, South Korea
- Languages at home
- 92% English-only · Spanish 2% Other Indo-European 2% Russian/Polish/Slavic 1%
Political lean MEDSL · Oakland
- 2024 margin
- D (+10.6) · D 54.4% · R 43.8% · Other 1.9%
- 2008→2024 swing
- -3.9pp toward R · 2008: 14.5pp · 2024: 10.6pp
- All cycles
- 2024: D+10.6 2020: D+14.1 2016: D+8.1 2012: D+8.1 2008: D+14.5
Not yet ingested
- Civics
- —
Market trends
- HPI YoY
- ▼ -571.62%
- Current HPI
- 224.5887
- Rent YoY
- ▲ 4.72%
- Metro
- Detroit-Warren-Dearborn, MI
- State GDP YoY
- ▲ 1.37%
- F500 in state
- 28
Industry mix (Fortune 500 HQ in MI)
| Industry | F500 HQs | Revenue |
|---|---|---|
| Automotive Parts | 3 | $48B |
|
||
| Automotive | 2 | $372B |
|
||
| Chemicals | 1 | $45B |
|
||
| Automotive Retail | 1 | $29B |
|
||
| Healthcare / Medical Devices | 1 | $23B |
|
||
| Automotive Technology | 1 | $20B |
|
||
Price history
+314.1% since first listed16 events — show timeline
- 2026-06-05 Listed $289,900 MiRealSource-MiMLS
- 2026-06-05 Listed $289,900 REALCOMP
- 2011-12-05 Sold (MLS) $108,900 REALCOMP
- 2011-12-05 Sold (MLS) $108,900 MiRealSource-MiMLS
- 2011-11-08 Listing Removed — MiRealSource-MiMLS
- 2011-08-05 Listed $109,900 REALCOMP
- 2011-08-05 Listed $109,900 MiRealSource-MiMLS
- 2010-12-08 Listing Removed — REALCOMP
- 2010-07-05 Listed $139,500 REALCOMP
- 2004-07-15 Sold (Public Records) $178,000 Public Records
- 2004-06-23 Sold (MLS) $178,000 MiRealSource-MiMLS
- 2004-06-23 Sold (MLS) $178,000 REALCOMP
- 2004-05-17 Listing Removed — MiRealSource-MiMLS
- 2004-03-23 Listed $184,900 MiRealSource-MiMLS
- 2004-03-23 Listed $184,900 REALCOMP
- 1992-08-04 Sold (Public Records) $70,000 Public Records
Property tax history
+5.0%/yrLatest (2025): $4,777 · +2.7% YoY. Source: county tax records.
Cash-flow waterfall
monthlySold comps — $/sqft
last 12 mo · ≤1 miLoading sold comps…