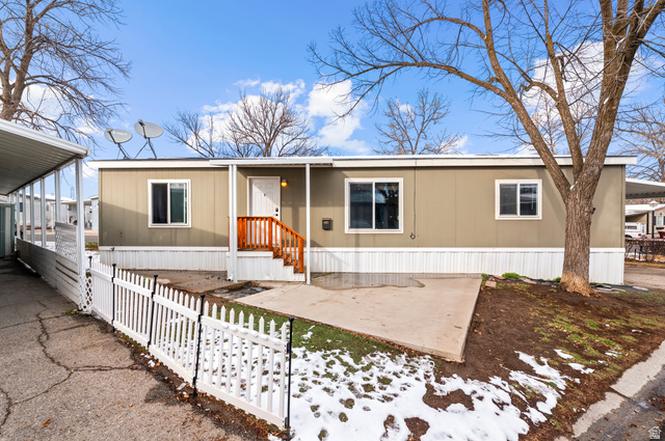
219 E Detroiter Cir · Murray, UT
Flood risk 10/10 · Severe
- FEMA flood zone
- X (unshaded)
- Chance of flooding over 30 yrs
- 0.99%
- Est. flood insurance / yr
- $507 – $1,088
Fire risk 1/10 · Minimal
- Est. fire insurance / yr
- $453 – $841
Heat risk 4/10 · Minor
- Hot days now (above 95°F)
- 7 days/yr
- Hot days in 30 yrs
- 19 days/yr
Wind risk 1/10 · Minimal
- Chance of severe wind over 30 yrs
- —
Air-quality risk 4/10 · Minor
- Unhealthy air days now
- 5 days/yr
- Unhealthy air days in 30 yrs
- 6 days/yr
Risk factors via First Street. Map © Google.
Why this score? — see what drove the B- grade
The composite is a weighted blend of 9 inputs, each scored 0–100. Each bar is that input's sub-score; the figure is the points it added to the 100-point composite (weight × sub-score).
- Cash flow +30.0/30.0
- 1% rule +10.0/10.0
- DSCR +10.0/10.0
- ARV discount +7.5/15.0
- Livability +4.1/5.0
- Schools +3.5/10.0
- Condition / age +2.5/5.0
- Rent growth +1.7/5.0
- Appreciation +0.0/10.0
$89,999
🖨 Deal sheet 📄 Offer letter ✓ Due diligence
Listing remarks
Welcome to easy living in the heart of Murray. This well-maintained 3-bedroom, 2-bath home is located in a peaceful 55+ community designed for comfort, connection, and low-maintenance living. The spacious layout offers generous bedrooms, two full bathrooms, and a bright, open living area. Enjoy the simplicity of community living with a monthly lot fee of $1,085. Pets are welcome (with community restrictions), so your furry companions can feel at home too. All new residents must be approved through a credit and background check. If you're looking for a comfortable, affordable place to call home in a quiet and welcoming community, this could be the perfect fit.
Key facts
- Parking
- Community pool
- Built 2016
Property features AI
Finance
- HOA & community: Has homeowners association (Nicholas); HOA fee $15 per month; Community pool; Located in a senior community (Cottonwood Cove subdivision)
Exterior
- Parking: Covered carport (1 covered space, 1 total parking space)
- Utilities: Natural gas connected; Electricity connected; Sewer connected; Culinary water connected
- Home design: Mobile home; Built and currently standing
- Construction: Asphalt roof; Construction materials: Other
- Exterior features: Double-pane windows; Storage shed(s); Faces southwest
Interior
- Kitchen: Gas range; Refrigerator
- Bedrooms: Three main-level bedrooms; Primary bedroom on the 1st floor
- Flooring: Laminate flooring
- Bathrooms: Two full bathrooms
- Heating & cooling: Central gas heating; Central air conditioning
- Interior features: Gas range; Blinds on windows; Refrigerator included; Laminate flooring; Slab foundation (no basement)
Neighborhood map
What this means for you Summary
Snapshot
- This is a 3-bed/2.0-bath manufactured listed at $90k.
Deal economics
- At list price, monthly cash flow is $702 ($8k/yr) — positive.
- The deal already cash-flows at list — no discount required.
- Meets the 1% rule at list price ($2k rent vs $90k).
- Recommended offer: $82k (9.0% below list) — sets the bar for market timing.
Location & tenants
- Location reads 82/100 on livability (#29 in UT, #1,169 nationally) — a professional / high-income tenant draw. Strengths: commute A+, housing A+, health & safety A; Watch: cost of living C-, crime D.
- Murray District (suburban): math 37% / reading 43% proficiency, ranked #46 of 80 in UT (top 58%) — families likely to look elsewhere, expect single-tenant / working-renter base with shorter leases.
- Zoned schools: Mcmillan School (math 52% / reading 60%, grade C+, #88 of 585 statewide, top 16%, 481 students, 27% FRL); Hillcrest Jr High (math 24% / reading 31%, grade F, #113 of 138 statewide, top 83%, 776 students, 39% FRL); Murray High (math 29% / reading 45%, grade F, #78 of 171 statewide, top 49%, 1,400 students, 24% FRL) — zoned schools at 30% FRL track the district average.
- Market conditions: Rents falling (-3.0%/yr); 226 active listings in the ZIP; 40 comparable units currently listed for rent nearby; rentals leasing fast (median 5d on market — plan ~1-2 weeks tenant-placement turnaround); 4,970 units permitted in Salt Lake County in 2024 (1,963 in 5+ unit buildings).
Forward outlook
- Local home prices are declining (-3.0%/yr); year-one equity from $622 of loan paydown is wiped out by about $3k of value loss. Plan a longer hold.
- Salt Lake County population projected at +37% by 2050 — long-run rental-demand tailwind backs the buy-and-hold thesis.
- At projected returns (-3.0% appreciation + 0.0% rent growth), your $25k cash investment doubles in ~4 years — after that, you're playing with house money.
Negotiation context
- It's been on market 114 days — a 9% lower offer ($82k) is reasonable based on typical stale-listing flexibility.
Risks & watch-outs
- Watch-outs: flood insurance adds $66/mo.
- Climate carrying-cost: severe flood risk — expect insurance premiums to compound above CPI over the hold.
Questions for the listing agent
- It's been on market 114 days. Have you received any prior offers? Is the seller open to a 9% concession, seller financing, or rate buy-down credit?
- What's the actual annual flood-insurance premium (NFIP or private), and is the property in a SFHA with mandatory coverage?
- What does the HOA fee cover, when was the last increase, and are there any pending special assessments or reserve-fund shortfalls?
- Why hasn't it sold? Are there any deal-killer items the seller is aware of (foundation, flood, title, zoning, code violations)?
- Is there a deadline driving the sale (1031 exchange, divorce, estate, relocation)? That informs how much negotiation room exists.
- Schools are B-rated — typically a magnet for longer-tenancy family renters. What's the average tenant stay here, and is there a school-zone premium baked into asking?
- Crime grade is D in this area — have there been break-ins, vandalism, or insurance claims at this property in the last 3 years? What carrier currently insures it and at what premium?
- What's the average days-on-market for RENTAL listings here right now (not sales)? A rising rental-DOM trend means longer vacancies and softer asking-rent achievability than the comps imply.
- What's the recent tenant-quality profile in this submarket — average credit score on applications, eviction rate, late-payment / NSF rate, and stable-employment percentage? A property-management company in the area should have these aggregated.
- How much new for-sale + rental construction is in the pipeline within 1–3 miles? Heavy new supply typically softens prices + rents 12–24 months out; constrained supply supports both.
Investment metrics
- 1% rule
- 1.98% ✓
- Cap rate
- 16.54%
- Cash-on-cash
- 36.58%
- DSCR
- 2.63
- GRM
- 4.2
CMA / ARV
No comps found within radius.
Projected returns pro-forma
-3.0% appreciation · 0.0% rent growth · sell at horizon
- IRR
- 25.0%
- Equity multiple
- 1.99×
- Total profit
- $24,973
- Equity at exit
- $13,419
- IRR
- 30.8%
- Equity multiple
- 3.36×
- Total profit
- $59,463
- Equity at exit
- $7,781
Cash invested: $25,200 (down + closing). Projections, not guarantees.
Landlord ↔ Tenant lean methodology
- Overall (STATE)
- 86 Strongly Landlord-Friendly
- State Utah
- 86 Strongly Landlord-Friendly · R+15
- County
- — inherits STATE
- City
- — inherits STATE
ZIP-level market 84107
- Rents YoY
- -3.0%
- Active inventory
- 226
- Price-to-rent
- 4.2×
Monthly cashflow live
- Estimated rent
- $1,779 high interval (Pro) →
- Mortgage (P&I)
- −$472
- Tax est. 1.5%
- −$112 /mo · $1,350/yr
- Insurance
- −$37
- Flood insurance flood zone
- −$66 /mo · $798/yr
- HOA
- −$15
- Vacancy / Maint / Mgmt
- −$374
- Net cashflow
- $702
Break-even live
UW: 25.0% down · 7.5% · 30yr · 1.5% tax · 5.0% vac · 8.0% maint · 8.0% mgmt
Financing live
Cash to close
- Down payment
- $22,500
- Closing costs
- $2,700
- Reserves months
- —
- Total cash needed
- —
Loan-product check · same deal, 3 products live
Conventional
25% down · 7.5% · 30yr
- Down + closing
- —
- Monthly P&I
- —
- Monthly cashflow
- —
- DSCR
- —
- Eligible?
- —
Personal DTI + credit; lowest rate.
DSCR
20% down · 8.5% · 30yr
- Down + closing
- —
- Monthly P&I
- —
- Monthly cashflow
- —
- DSCR
- —
- Eligible?
- —
No personal income docs; deal must DSCR.
Hard money
10% down · 12.0% · 12mo
- Down + closing
- —
- Monthly P&I
- —
- Monthly cashflow
- —
- DSCR
- —
- Eligible?
- —
Short-term bridge; refi at stabilization.
Rent comps 40 comps
| Address | Beds | Baths | Sqft | Rent | $/sqft | DOM | Units | Dist |
|---|---|---|---|---|---|---|---|---|
| 333 E 4500 S #13 Salt Lake City, UT | 2.0 | 1.0 | 1400 | $1,400 | $1.00 | 3d | 1 | 0.22mi |
| 4150 S 300 E Salt Lake City, UT | 1.0–2.0 | 1.0–2.0 | 844 | $2,179 | $2.58 | 3d | 17 | 0.24mi |
| 4109 S 300 E Salt Lake City, UT | 2.0 | 2.0 | 1334 | $2,600 | $1.95 | 1d | 1 | 0.37mi |
| 4410 S Main St Salt Lake City, UT | 2.0 | 1.0–2.0 | 892 | $2,810 | $3.15 | 3d | 76 | 0.37mi |
| 47 W Fireclay Ave Salt Lake City, UT | 1.0–2.0 | 1.0–2.0 | 902 | $2,088 | $2.31 | 3d | 36 | 0.38mi |
| 4197 S Main St Millcreek, UT | 3.0 | 1.0–2.0 | 891 | $1,858 | $2.08 | 3d | 13 | 0.39mi |
| 340 E Gordon Ln Salt Lake City, UT | 2.0 | 1.0 | 850 | $1,295 | $1.52 | 4d | 3 | 0.39mi |
| 4080 S 300 E Unit F Millcreek, UT | 2.0 | 1.0 | 1200 | $1,125 | $0.94 | 23d | 1 | 0.39mi |
| 448 E Damsel Dr Salt Lake City, UT | 2.0 | 1.0–2.0 | 1180 | $1,512 | $1.28 | 16d | 4 | 0.40mi |
| 4072 S 300 E Millcreek, UT | 2.0 | 2.5 | 1200 | $1,895 | $1.58 | 23d | 1 | 0.42mi |
| 4150 S 500 E Salt Lake City, UT | 1.0–2.0 | 1.0–2.0 | 832 | $1,325 | $1.59 | 23d | 1 | 0.44mi |
| 54 W Fireclay Ave Salt Lake City, UT | 1.0–2.0 | 1.0–2.0 | 962 | $1,775 | $1.84 | 23d | 1 | 0.46mi |
| 4624 S Meadow Rd Unit Down Murray, UT | 2.0 | 1.0 | 1200 | $2,000 | $1.67 | 12d | 1 | 0.46mi |
| 293 E Hill Ave Unit 10 Millcreek, UT | 3.0 | 2.0 | 1030 | $1,195 | $1.16 | 14d | 1 | 0.48mi |
| 4115 S 430 E Millcreek, UT | 1.0–2.0 | 1.0–1.5 | 876 | $1,350 | $1.54 | 16d | 13 | 0.48mi |
| 44 W Iko Ave Millcreek, UT | 2.0 | 2.5 | 1296 | $2,200 | $1.70 | 4d | 1 | 0.51mi |
| 136 W Fireclay Ave Murray, UT | 1.0–3.0 | 1.0–2.0 | 991 | $1,589 | $1.60 | 3d | 12 | 0.53mi |
| 428 E Park Oak Pl Salt Lake City, UT | 3.0 | 2.5 | 1500 | $2,300 | $1.53 | 4d | 1 | 0.53mi |
| 335 E Woodlake Dr Salt Lake City, UT | 1.0–2.0 | 1.0–2.0 | 881 | $1,561 | $1.77 | 1d | 11 | 0.54mi |
| 514 E 4090 S Salt Lake City, UT | 1.0–2.0 | 1.0–2.0 | 825 | $1,521 | $1.84 | 2d | 25 | 0.58mi |
| 162 W 4490 S Murray, UT | 1.0–3.0 | 1.0–2.0 | 854 | $1,800 | $2.11 | 23d | 22 | 0.59mi |
| 3993 S Main St Millcreek, UT | 1.0–2.0 | 1.0–2.0 | 838 | $1,650 | $1.97 | 3d | 25 | 0.60mi |
| 480 E Brandt Ct Salt Lake City, UT | 2.0–3.0 | 1.5 | 1200 | $2,009 | $1.67 | 4d | 4 | 0.67mi |
| 4320 S 700 E Salt Lake City, UT | 2.0 | 1.0 | 920 | $1,314 | $1.43 | 3d | 3 | 0.68mi |
| 2 Regal St Murray, UT | 2.0 | 1.0 | 1004 | $1,195 | $1.19 | 3d | 7 | 0.73mi |
| 3910 S Main St Millcreek, UT | 1.0–2.0 | 1.0–2.0 | 747 | $1,652 | $2.21 | 4d | 6 | 0.76mi |
| 593 E 4010 S Salt Lake City, UT | 2.0 | 1.5 | 1602 | $950 | $0.59 | 19d | 1 | 0.78mi |
| 265 Rigdon Ave Unit 1 South Salt Lake, UT | 2.0 | 1.0 | 900 | $1,195 | $1.33 | 21d | 1 | 0.83mi |
| 212 4800 S Murray, UT | 3.0 | 1.0 | 1066 | $1,845 | $1.73 | 3d | 1 | 0.91mi |
| 184 E Vine St Salt Lake City, UT | 2.0 | 2.0 | 962 | $1,899 | $1.97 | 3d | 4 | 0.93mi |
| 3808 S West Temple South Salt Lake, UT | 2.0 | 1.0–2.0 | 786 | $1,830 | $2.33 | 1d | 10 | 0.93mi |
| 3708 S McCall St South Salt Lake, UT | 2.0 | 1.0 | 885 | $1,300 | $1.47 | 16d | 1 | 0.94mi |
| 3708 S McCall St South Salt Lake, UT | 2.0 | 1.0 | 885 | $1,300 | $1.47 | 14d | 1 | 0.94mi |
| 4380 S 900 E Millcreek, UT | 3.0 | 2.5 | 1409 | $2,499 | $1.77 | 23d | 1 | 0.96mi |
| 4380 S 900 E #104 Millcreek, UT | 3.0 | 2.5 | 1410 | $2,699 | $1.91 | 3d | 1 | 0.96mi |
| 4380 S 900 E Millcreek, UT | 3.0 | 2.5 | 1409 | $2,499 | $1.77 | 14d | 1 | 0.96mi |
| 4386 S 900 E Millcreek, UT | 2.0 | 3.5 | 1704 | $2,599 | $1.53 | 3d | 1 | 0.96mi |
| 4756 East Murray, UT | 2.0 | 1.0 | 900 | $1,500 | $1.67 | 23d | 1 | 1.00mi |
| 4545 S Arcadia Green Way Salt Lake City, UT | 2.0 | 2.0 | 1000 | $1,425 | $1.43 | 1d | 4 | 1.00mi |
| 4364 S 900 E Millcreek, UT | 3.0 | 2.5 | 1409 | $2,499 | $1.77 | 23d | 1 | 1.01mi |
HOA detail
- Monthly dues
- $15 · $180/yr
Listing history 16 events
-
2026-06-18days on market $89,999 Active 114 DOM
-
2026-06-17days on market $89,999 Active 113 DOM
-
2026-06-16days on market $89,999 Active 112 DOM
-
2026-06-15days on market $89,999 Active 111 DOM
-
2026-06-13days on market $89,999 Active 109 DOM
-
2026-06-13days on market $89,999 Active 108 DOM
-
2026-06-09days on market $89,999 Active 105 DOM
-
2026-06-08days on market $89,999 Active 104 DOM
-
2026-06-07days on market $89,999 Active 103 DOM
-
2026-06-05days on market $89,999 Active 100 DOM
-
2026-06-03days on market $89,999 Active 99 DOM
-
2026-06-02days on market $89,999 Active 98 DOM
-
2026-06-01days on market $89,999 Active 97 DOM
-
2026-05-31pricedays on market $89,999 Active 96 DOM
-
2026-04-20price $98,000
-
2026-02-24$100,000 Active
ⓘ Source: listings_history table (triggers on properties + properties_extension) + one-shot
backfill from property_details.listing_events for pre-trigger history.
Climate risk First Street
- Flood 10/10 Extreme FEMA zone X (unshaded) · 99% chance over 30 yrs
- Wildfire 1/10 Low
- Heat 4/10 Moderate 7 d/yr ≥95°F today · 19 d/yr by 30 yrs out
- Wind 1/10 Low
- Air quality 4/10 Moderate 5 unhealthy d/yr today · 6 by 30 yrs out
Nearby sold comps map
Loading sold comps map…
Walkable amenities ~0.75 mi
Loading nearby amenities…
Taxation est. · year 1
- Rental income
- $21,344
- − Mortgage interest
- −$5,041
- − Property taxes
- −$1,350
- − Insurance
- −$1,247
- − Repairs & maintenance
- −$1,708
- − Management
- −$1,708
- − HOA
- −$180
- − Depreciation
- −$2,618
- Taxable income
- $7,492
- Est. tax owed @ 24.0%
- −$1,798
- After-tax cash flow
- $6,623/yr
For passive investors: Depreciation is non-cash, so a rental often shows a tax loss while cash-flowing — sheltering income. Rental losses are passive: they offset passive income freely, and up to $25,000/yr can offset ordinary (W-2) income if you actively participate and your MAGI is under $100k (phasing out to $0 by $150k); unused losses carry forward. On sale, claimed depreciation is recaptured at up to 25%, and gains may owe capital-gains tax (a 1031 exchange can defer both). Figures are a year-1 estimate at your 24.0% rate — not tax advice; consult a CPA.
Schools (NCES district)
- District
- Murray District
- NCES district ID
- 4900600
- Math proficiency
- 37% ▼ -8.00%
- Reading proficiency
- 43% ▼ -6.00%
- Median HH income
- $53,804
- Composite
- 34.84/100
- National rank
- #5096
- State rank
- #46 of 80 in UT
Livability — Murray
- Score
- 82/100
- State rank
- #29
- US rank
- #1169
Category grades
Schools grade is shown separately in the Schools card above.
Census & demographics
- Census place
- Murray, UT
- County
- Salt Lake County · 1,195,750 people
- City population
- 38,257
- Metro
- Salt Lake City, UT
- Population (ZIP)
- 38,257
- Household income
- $72,108
- Rent vs Own
- Severe rent burden
- 2149.0
Population outlook (Salt Lake County) Hauer SSP2
- Today (2025)
- 1,305,860 people
- By 2030
- 1,402,611 · +7.4%
- By 2040
- 1,594,533 · +22.1%
- By 2050
- 1,787,244 · +36.9%
- By 2075
- 2,224,138 · +70.3%
- By 2100
- 2,551,390 · +95.4%
Race, ethnicity, and origin ACS 2023
- Neighborhood character
- Predominantly White (65%)
- Race & ethnicity
- White 65% Hispanic / Latino 18% Two or more races 12% Asian 5% Black 4% Pacific Islander 2%
- Hispanic origin (detail)
- Mexican 10%
- Common ancestry
- Italian 4% Slovak 4% Iranian 2%
- Foreign-born
- 16% · Canada, Jamaica, China
- Languages at home
- 78% English-only · Spanish 10% Other Indo-European 4% Other Asian/Pacific 2%
Political lean MEDSL · Salt Lake
- 2024 margin
- D (+10.2) · D 53.7% · R 43.5% · Other 2.8%
- 2008→2024 swing
- +10.1pp toward D · 2008: 0.1pp · 2024: 10.2pp
- All cycles
- 2024: D+10.2 2020: D+11.0 2016: D+10.2 2012: R+19.3 2008: D+0.1
Not yet ingested
- Civics
- —
Market trends
- HPI YoY
- ▼ -404.21%
- Current HPI
- 309.8745
- Rent YoY
- ▼ -3.04%
- Metro
- Salt Lake City, UT
- State GDP YoY
- ▲ 3.54%
- F500 in state
- 2
Industry mix (Fortune 500 HQ in UT)
| Industry | F500 HQs | Revenue |
|---|---|---|
| Financial Services | 1 | $3B |
|
||
Price history
-2.0% since first listed2 events — show timeline
- 2026-04-20 Price Changed $98,000 WFRMLS
- 2026-02-24 Listed $100,000 WFRMLS
Cash-flow waterfall
monthlySold comps — $/sqft
last 12 mo · ≤1 miLoading sold comps…