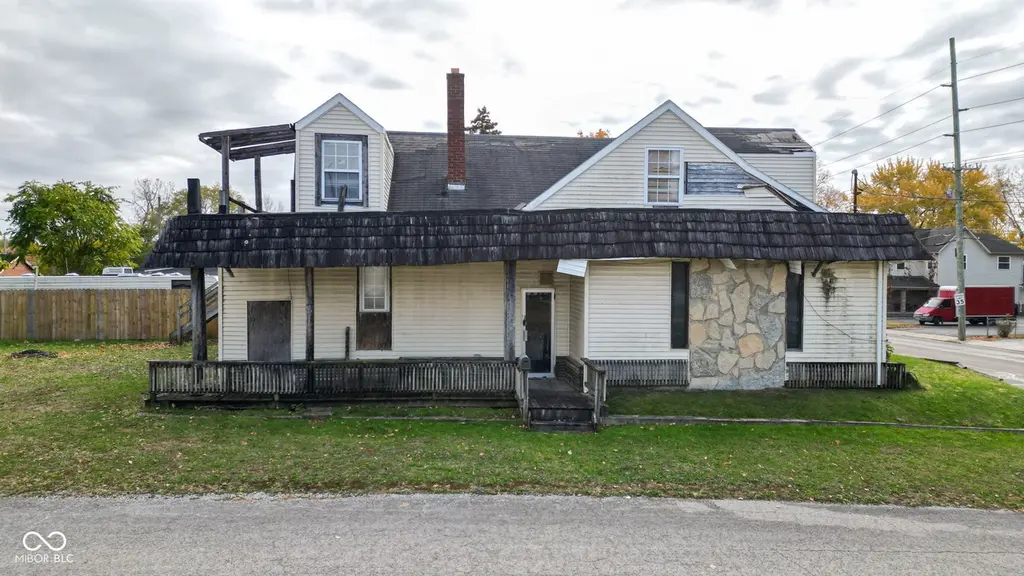
3302 Columbus Ave · Anderson, IN
Flood risk No data
- FEMA flood zone
- —
- Chance of flooding over 30 yrs
- —
- Est. flood insurance / yr
- —
Fire risk No data
- Est. fire insurance / yr
- —
Heat risk No data
- Hot days now (above threshold)
- —
- Hot days in 30 yrs
- —
Wind risk No data
- Chance of severe wind over 30 yrs
- —
Air-quality risk No data
- Unhealthy air days now
- —
- Unhealthy air days in 30 yrs
- —
Risk factors via First Street. Map © Google.
Why this score? — see what drove the B- grade
The composite is a weighted blend of 9 inputs, each scored 0–100. Each bar is that input's sub-score; the figure is the points it added to the 100-point composite (weight × sub-score).
- Cash flow +30.0/30.0
- 1% rule +10.0/10.0
- DSCR +10.0/10.0
- ARV discount +7.5/15.0
- Livability +3.0/5.0
- Rent growth +2.5/5.0
- Condition / age +2.5/5.0
- Schools +1.6/10.0
- Appreciation +0.0/10.0
$50,000
🖨 Deal sheet 📄 Offer letter ✓ Due diligence
Listing remarks MLS
This Home with Great Potential! Discover this single-family home ready for a full cosmetic refresh, located in Anderson. This property features a zoning Commercial and Residential. Built in 1939, the home offers unique character, a spacious lot, and is located near shopping, schools, and restaurants. Also located on a great commercial area next to a party planning agency. With a little love and vision, this property could shine again! Don't miss this chance to own a home at an unbeatable price. Schedule your private showing today!
Key facts
- 5,663 sq ft lot
- Garage
- Built 1939
Tags
Neighborhood map
What this means for you Summary
Snapshot
- This is a 1-bed/2.0-bath single-family listed at $50k.
Deal economics
- At list price, monthly cash flow is $402 ($5k/yr) — positive.
- The deal already cash-flows at list — no discount required.
- Meets the 1% rule at list price ($946 rent vs $50k).
- Recommended offer: $44k (12.0% below list) — sets the bar for market timing.
- Cap rate 15.9% vs local median 6.5% in Anderson — top-decile yield for the area; either an underpriced asset or a hidden risk that comps aren't pricing in. Stress-test before assuming the spread holds.
Location & tenants
- Location reads 60/100 on livability (#521 in IN) — a middle-class / working-renter tenant base. Strengths: cost of living A+, housing A+; Watch: schools F, crime D-, amenities F.
- Anderson Community School Corporation (urban): math 15% / reading 23% proficiency, ranked #280 of 301 in IN (top 93%) — low school quality limits family demand, transient renter base, plan for 1-2y turnover; 70% free/reduced lunch — lower-income household profile, screen leases tightly.
- Market conditions: 150 active listings in the ZIP; 184 units permitted in Madison County in 2024 (0 in 5+ unit buildings).
Forward outlook
- Local home prices are declining (-3.0%/yr); year-one equity from $346 of loan paydown is wiped out by about $2k of value loss. Plan a longer hold.
- Madison County population projected at -14% by 2050 — secular population decline; favor cash flow + early exit over multi-decade hold.
- At projected returns (-3.0% appreciation + 3.0% rent growth), your $14k cash investment doubles in ~4 years — after that, you're playing with house money.
Negotiation context
- It's been on market 688 days — a 12% lower offer ($44k) is reasonable based on typical stale-listing flexibility.
- 2 sale attempts since 13y ago; this cycle's ask has dropped $21k (29%) from the opening price — seller is motivated, your offer sets the floor, not the list.
- Current owner paid $2k; list at $50k implies a 1900% gain — meaningful room to come down on a strong offer.
Risks & watch-outs
- Watch-outs: built in 1939 — expect roof / HVAC / electrical / plumbing capex.
Questions for the listing agent
- It's been on market 688 days. Have you received any prior offers? Is the seller open to a 12% concession, seller financing, or rate buy-down credit?
- Built in 1939 — when were the roof, HVAC, electrical panel, plumbing, and water heater last replaced?
- Why hasn't it sold? Are there any deal-killer items the seller is aware of (foundation, flood, title, zoning, code violations)?
- Is there a deadline driving the sale (1031 exchange, divorce, estate, relocation)? That informs how much negotiation room exists.
- Schools are F-rated, which usually means shorter tenancies and higher turnover. Who's the typical renter profile here, and what's been the actual vacancy rate?
- Crime grade is D in this area — have there been break-ins, vandalism, or insurance claims at this property in the last 3 years? What carrier currently insures it and at what premium?
- What's the average days-on-market for RENTAL listings here right now (not sales)? A rising rental-DOM trend means longer vacancies and softer asking-rent achievability than the comps imply.
- What's the recent tenant-quality profile in this submarket — average credit score on applications, eviction rate, late-payment / NSF rate, and stable-employment percentage? A property-management company in the area should have these aggregated.
- How much new for-sale + rental construction is in the pipeline within 1–3 miles? Heavy new supply typically softens prices + rents 12–24 months out; constrained supply supports both.
Investment metrics
- 1% rule
- 1.89% ✓
- Cap rate
- 15.95%
- Cash-on-cash
- 34.47%
- DSCR
- 2.53
- GRM
- 4.4
CMA / ARV
- ARV (median comp)
- $100,272
- List price
- $50,000
- Delta
- -50.14%
- Verdict
- UNDERPRICED
- Comps
- 20 within 1.0 mi
Show comp detail 7 sales within ~0.75 mi
| Address | Dist | Beds/Ba | Sqft | Sold | Price | $/sf | Match |
|---|---|---|---|---|---|---|---|
| 3411 Columbus Ave | 0.09mi | 2/1.0 (+1) | 2,112 (-14%) | 5mo | $162,000 | $77 | 59 |
| 209 E 37th St | 0.64mi | 2/1.0 (+1) | 2,342 (-5%) | 10mo | $145,000 | $62 | 45 |
| 2806 Meridian St | 0.74mi | 2/1.0 (+1) | 2,328 (-5%) | 4mo | $133,000 | $57 | 45 |
| 3737 Forest Ter | 0.46mi | 2/1.5 (+1) | 2,208 (-10%) | 12mo | $125,000 | $57 | 44 |
| 414 E 31st St | 0.42mi | 2/1.0 (+1) | 2,631 (+7%) | 20mo | $56,800 | $22 | 43 |
| 2100 E 38th St | 0.71mi | 2/1.0 (+1) | 2,655 (+8%) | 5mo | $60,000 | $23 | 40 |
| 1711 E 32nd St | 0.43mi | 2/1.0 (+1) | 2,240 (-9%) | 20mo | $93,000 | $42 | 39 |
Match score weights: distance 35% · size 25% · config 20% · recency 20%. Top-matched comps best support the ARV.
Projected returns pro-forma
-3.0% appreciation · 3.0% rent growth · sell at horizon
- IRR
- 29.9%
- Equity multiple
- 2.25×
- Total profit
- $17,528
- Equity at exit
- $7,455
- IRR
- 37.2%
- Equity multiple
- 4.45×
- Total profit
- $48,305
- Equity at exit
- $4,323
Cash invested: $14,000 (down + closing). Projections, not guarantees.
Landlord ↔ Tenant lean methodology
- Overall (STATE)
- 90 Strongly Landlord-Friendly
- State Indiana
- 90 Strongly Landlord-Friendly · R+11
- County
- — inherits STATE
- City
- — inherits STATE
ZIP-level market 46013
- Home prices YoY
- -26.9%
- Active inventory
- 150
- Price-to-rent
- 4.4×
Monthly cashflow live
- Estimated rent
- $946 medium interval (Pro) →
- Mortgage (P&I)
- −$262
- Tax est. 1.5%
- −$62 /mo · $750/yr
- Insurance
- −$21
- HOA
- −$0
- Vacancy / Maint / Mgmt
- −$199
- Net cashflow
- $402
Break-even live
UW: 25.0% down · 7.5% · 30yr · 1.5% tax · 5.0% vac · 8.0% maint · 8.0% mgmt
Financing live
Cash to close
- Down payment
- $12,500
- Closing costs
- $1,500
- Reserves months
- —
- Total cash needed
- —
Loan-product check · same deal, 3 products live
Conventional
25% down · 7.5% · 30yr
- Down + closing
- —
- Monthly P&I
- —
- Monthly cashflow
- —
- DSCR
- —
- Eligible?
- —
Personal DTI + credit; lowest rate.
DSCR
20% down · 8.5% · 30yr
- Down + closing
- —
- Monthly P&I
- —
- Monthly cashflow
- —
- DSCR
- —
- Eligible?
- —
No personal income docs; deal must DSCR.
Hard money
10% down · 12.0% · 12mo
- Down + closing
- —
- Monthly P&I
- —
- Monthly cashflow
- —
- DSCR
- —
- Eligible?
- —
Short-term bridge; refi at stabilization.
Listing history 19 events
-
2026-06-18days on market $50,000 Active 688 DOM
-
2026-06-17days on market $50,000 Active 687 DOM
-
2026-06-16days on market $50,000 Active 686 DOM
-
2026-06-15days on market $50,000 Active 685 DOM
-
2026-06-13days on market $50,000 Active 683 DOM
-
2026-06-09days on market $50,000 Active 679 DOM
-
2026-06-08days on market $50,000 Active 678 DOM
-
2026-06-07days on market $50,000 Active 677 DOM
-
2026-06-05days on market $50,000 Active 674 DOM
-
2026-06-03days on market $50,000 Active 673 DOM
-
2026-06-02days on market $50,000 Active 672 DOM
-
2026-06-01days on market $50,000 Active 671 DOM
-
2026-05-31days on market $50,000 Active 670 DOM
-
2025-11-10price $50,000 536-char remark
Show marketing remark (536 chars)
This Home with Great Potential! Discover this single-family home ready for a full cosmetic refresh, located in Anderson. This property features a zoning Commercial and Residential. Built in 1939, the home offers unique character, a spacious lot, and is located near shopping, schools, and restaurants. Also located on a great commercial area next to a party planning agency. With a little love and vision, this property could shine again! Don't miss this chance to own a home at an unbeatable price. Schedule your private showing today!
-
2025-10-28price $59,000 536-char remark
Show marketing remark (536 chars)
This Home with Great Potential! Discover this single-family home ready for a full cosmetic refresh, located in Anderson. This property features a zoning Commercial and Residential. Built in 1939, the home offers unique character, a spacious lot, and is located near shopping, schools, and restaurants. Also located on a great commercial area next to a party planning agency. With a little love and vision, this property could shine again! Don't miss this chance to own a home at an unbeatable price. Schedule your private showing today!
-
2024-07-30$70,700 Active 536-char remark
Show marketing remark (536 chars)
This Home with Great Potential! Discover this single-family home ready for a full cosmetic refresh, located in Anderson. This property features a zoning Commercial and Residential. Built in 1939, the home offers unique character, a spacious lot, and is located near shopping, schools, and restaurants. Also located on a great commercial area next to a party planning agency. With a little love and vision, this property could shine again! Don't miss this chance to own a home at an unbeatable price. Schedule your private showing today!
-
2013-08-19historical 148-char remark
Show marketing remark (148 chars)
Foreclosures is fixer upper opportunity for cash buyer investors. All data is believed accurate but not warranted. Property is sold as is, where is.
-
2013-08-19soldstatus $2,500 148-char remark
Show marketing remark (148 chars)
Foreclosures is fixer upper opportunity for cash buyer investors. All data is believed accurate but not warranted. Property is sold as is, where is.
-
2013-06-20$7,499 148-char remark
Show marketing remark (148 chars)
Foreclosures is fixer upper opportunity for cash buyer investors. All data is believed accurate but not warranted. Property is sold as is, where is.
ⓘ Source: listings_history table (triggers on properties + properties_extension) + one-shot
backfill from property_details.listing_events for pre-trigger history.
Nearby sold comps map
Loading sold comps map…
Walkable amenities ~0.75 mi
Loading nearby amenities…
Taxation est. · year 1
- Rental income
- $11,358
- − Mortgage interest
- −$2,801
- − Property taxes
- −$750
- − Insurance
- −$250
- − Repairs & maintenance
- −$909
- − Management
- −$909
- − Depreciation
- −$1,455
- Taxable income
- $4,285
- Est. tax owed @ 24.0%
- −$1,028
- After-tax cash flow
- $3,798/yr
For passive investors: Depreciation is non-cash, so a rental often shows a tax loss while cash-flowing — sheltering income. Rental losses are passive: they offset passive income freely, and up to $25,000/yr can offset ordinary (W-2) income if you actively participate and your MAGI is under $100k (phasing out to $0 by $150k); unused losses carry forward. On sale, claimed depreciation is recaptured at up to 25%, and gains may owe capital-gains tax (a 1031 exchange can defer both). Figures are a year-1 estimate at your 24.0% rate — not tax advice; consult a CPA.
Schools (NCES district)
- District
- Anderson Community School Corporation
- NCES district ID
- 1800150
- Math proficiency
- 15% ▼ -14.00%
- Reading proficiency
- 23% ▼ -7.00%
- Median HH income
- $38,208
- Composite
- 15.93/100
- National rank
- #9250
- State rank
- #280 of 301 in IN
Livability — Anderson
- Score
- 60/100
- State rank
- #521
- US rank
- #18709
Category grades
Schools grade is shown separately in the Schools card above.
Census & demographics
- Census place
- Anderson, IN
- County
- Madison County · 69,445 people
- City population
- 57,762
- Metro
- Indianapolis-Carmel-Anderson, IN
- Population (ZIP)
- 19,073
- Household income
- $49,310
- Rent vs Own
- Severe rent burden
- 612.0
Population outlook (Madison County) Hauer SSP2
- Today (2025)
- 125,800 people
- By 2030
- 122,640 · -2.5%
- By 2040
- 115,420 · -8.3%
- By 2050
- 108,148 · -14.0%
- By 2075
- 91,838 · -27.0%
- By 2100
- 75,670 · -39.8%
Race, ethnicity, and origin ACS 2023
- Neighborhood character
- Predominantly White (83%)
- Race & ethnicity
- White 83% Two or more races 8% Black 7% Hispanic / Latino 3%
- Common ancestry
- Lithuanian 2% Slovak 2% Italian 1%
- Foreign-born
- 0% · Canada
- Languages at home
- 97% English-only · Spanish 2%
Political lean MEDSL · Madison
- 2024 margin
- Strong R (+26.9) · D 35.6% · R 62.5% · Other 1.9%
- 2008→2024 swing
- -33.5pp toward R · 2008: 6.5pp · 2024: -26.9pp
- All cycles
- 2024: R+26.9 2020: R+22.6 2016: R+25.7 2012: R+4.5 2008: D+6.5
Not yet ingested
- Civics
- —
Market trends
- HPI YoY
- ▼ -86.70%
- Current HPI
- 235.7485
- Rent YoY
- —
- Metro
- Indianapolis-Carmel-Anderson, IN
- State GDP YoY
- ▲ 2.90%
- F500 in state
- 18
Industry mix (Fortune 500 HQ in IN)
| Industry | F500 HQs | Revenue |
|---|---|---|
| Industrial Machinery | 2 | $37B |
|
||
| Healthcare | 1 | $177B |
|
||
| Pharmaceuticals | 1 | $45B |
|
||
| Metals / Steel | 1 | $18B |
|
||
| Agriculture | 1 | $17B |
|
||
| Packaging | 1 | $12B |
|
||
Price history
+566.8% since first listed6 events — show timeline
- 2025-11-10 Price Changed $50,000 MIBOR as Distributed by MLS Grid
- 2025-10-28 Price Changed $59,000 MIBOR as Distributed by MLS Grid
- 2024-07-30 Listed $70,700 MIBOR as Distributed by MLS Grid
- 2013-08-19 Listing Removed — MIBOR as Distributed by MLS Grid
- 2013-08-19 Sold (MLS) $2,500 MIBOR as Distributed by MLS Grid
- 2013-06-20 Listed $7,499 MIBOR as Distributed by MLS Grid
Cash-flow waterfall
monthlySold comps — $/sqft
last 12 mo · ≤1 miLoading sold comps…