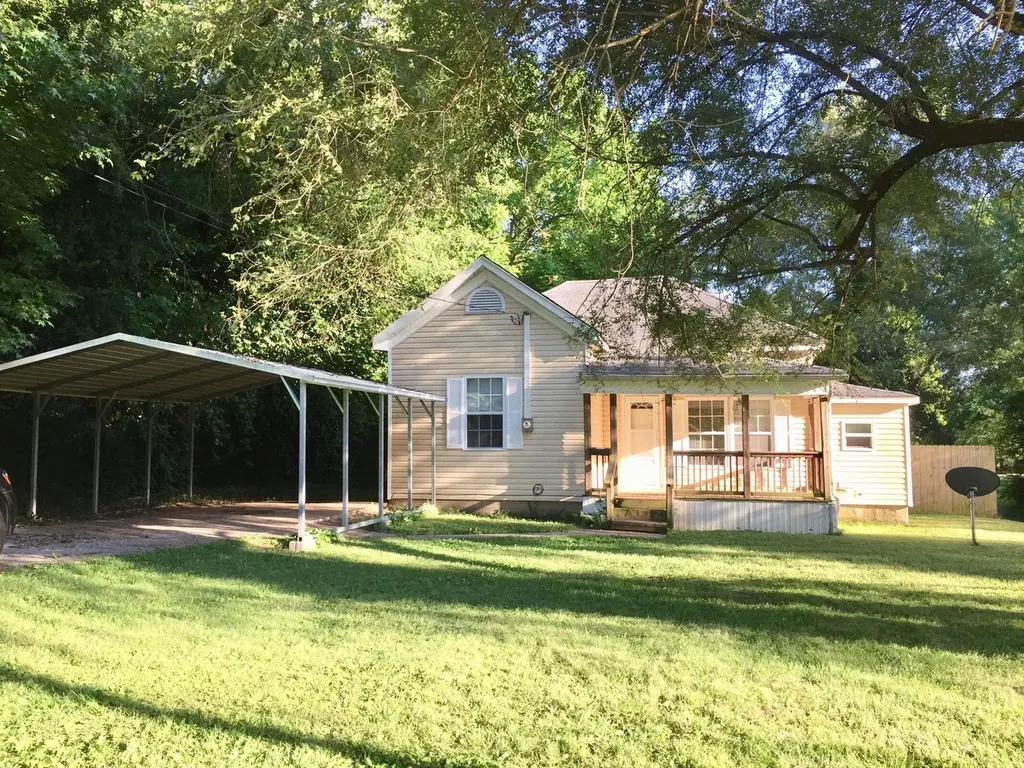
2646 W Brower St · Springfield, MO
Flood risk 1/10 · Minimal
- FEMA flood zone
- X (unshaded)
- Chance of flooding over 30 yrs
- 0.0%
- Est. flood insurance / yr
- $507 – $1,088
Fire risk 1/10 · Minimal
- Est. fire insurance / yr
- $1,054 – $1,958
Heat risk 4/10 · Minor
- Hot days now (above 104°F)
- 6 days/yr
- Hot days in 30 yrs
- 18 days/yr
Wind risk 2/10 · Minimal
- Chance of severe wind over 30 yrs
- 0.0%
Air-quality risk 2/10 · Minimal
- Unhealthy air days now
- 1 days/yr
- Unhealthy air days in 30 yrs
- 2 days/yr
Risk factors via First Street. Map © Google.
Why this score? — see what drove the D grade
The composite is a weighted blend of 9 inputs, each scored 0–100. Each bar is that input's sub-score; the figure is the points it added to the 100-point composite (weight × sub-score).
- Cash flow +15.2/30.0
- ARV discount +8.1/15.0
- DSCR +4.7/10.0
- Livability +3.8/5.0
- Rent growth +3.7/5.0
- Schools +3.2/10.0
- 1% rule +3.0/10.0
- Condition / age +2.5/5.0
- Appreciation +0.0/10.0
$114,000
🖨 Deal sheet (PDF) 📄 Offer letter ✓ Due diligence
Listing remarks MLS
Investment, Rental Income. Cute Bungalow!! This house has 692 sqft, with 2 bedrooms, 1 full bathroom, a laundry room, and 2 carports. Plenty of kitchen cabinets and the kitchen appliances stay: refrigerator, natural gas cook stove. Flooring is laminate. Large backyard; 312' x 70', mostly fenced, and a storage shed for extra storage. The plumbing and electrical has been updated over time. Long-time renters and the monthly $800. income and leased through October here in Springfield, MO. Buy your first rental house or use your 1031exchange money to buy this one. The owner prefers to sell in as-is condition and chooses not to make any repairs if called out by the inspector. Pictures are from prior to tenant occupied.
Key facts
- Updated electrical
- Laundry room
- Large backyard
Tags
Neighborhood map
What this means for you Summary
Snapshot
- This is a 2-bed/1.0-bath single-family listed at $114k.
Deal economics
- At list price, monthly cash flow is $40 ($477/yr) — positive.
- The deal already cash-flows at list — no discount required.
- To meet the 1% rule (rent ≥ 1% of price), the offer needs to be $91k (20.0% below list).
- Recommended offer: $91k (20.0% below list) — sets the bar for 1% rule.
- Cap rate 6.7% vs local median 4.6% in Springfield — top-decile yield for the area; either an underpriced asset or a hidden risk that comps aren't pricing in. Stress-test before assuming the spread holds.
Location & tenants
- Location reads 75/100 on livability (#57 in MO, #4,121 nationally) — a middle-class / working-renter tenant base. Strengths: commute A+, cost of living A+, housing A+; Watch: crime F, employment F.
- Springfield R-XII (urban): math 32% / reading 46% proficiency, ranked #174 of 324 in MO (top 54%) — families likely to look elsewhere, expect single-tenant / working-renter base with shorter leases.
- Zoned schools: York Elem. (math 32% / reading 47%, grade F, #537 of 1,115 statewide, top 53%, 204 students, 89% FRL); Pipkin Middle (math 20% / reading 29%, grade F, #324 of 391 statewide, top 83%, 340 students, 82% FRL) — zoned schools average 86% FRL vs 46% district-wide (39 pts higher); higher-poverty schools than district average — tighter screening recommended.
- Market conditions: Rents rising fast (+4.8%/yr); 520 active listings in the ZIP; 9 comparable units currently listed for rent nearby; rentals lingering (median 46d on market — plan ~5-8 weeks vacancy on turnover, expect pricing pressure); 67% of comp listings sitting > 30 days — soft ceiling on asking rent; 1,302 units permitted in Greene County in 2024 (250 in 5+ unit buildings).
Forward outlook
- Local home prices are declining (-3.0%/yr); year-one equity from $788 of loan paydown is wiped out by about $3k of value loss. Plan a longer hold.
- Greene County population projected at +25% by 2050 — long-run rental-demand tailwind backs the buy-and-hold thesis.
Negotiation context
- It's been on market 91 days — a 9% lower offer ($104k) is reasonable based on typical stale-listing flexibility.
- 2 sale attempts with the ask held roughly flat each time — persistent listings suggest the price (not the market) is what's stuck; bring a comps-based counter.
Risks & watch-outs
- Watch-outs: built in 1897 — expect roof / HVAC / electrical / plumbing capex.
Questions for the listing agent
- It's been on market 91 days. Have you received any prior offers? Is the seller open to a 20% concession, seller financing, or rate buy-down credit?
- Built in 1897 — when were the roof, HVAC, electrical panel, plumbing, and water heater last replaced?
- Why hasn't it sold? Are there any deal-killer items the seller is aware of (foundation, flood, title, zoning, code violations)?
- Is there a deadline driving the sale (1031 exchange, divorce, estate, relocation)? That informs how much negotiation room exists.
- Crime grade is F in this area — have there been break-ins, vandalism, or insurance claims at this property in the last 3 years? What carrier currently insures it and at what premium?
- The area grade is low — what's the realistic commute time and amenity access for the typical tenant pool here? Any planned neighborhood developments (good or bad) we should know about?
- What's the average days-on-market for RENTAL listings here right now (not sales)? A rising rental-DOM trend means longer vacancies and softer asking-rent achievability than the comps imply.
- What's the recent tenant-quality profile in this submarket — average credit score on applications, eviction rate, late-payment / NSF rate, and stable-employment percentage? A property-management company in the area should have these aggregated.
- How much new for-sale + rental construction is in the pipeline within 1–3 miles? Heavy new supply typically softens prices + rents 12–24 months out; constrained supply supports both.
Investment metrics
- 1% rule
- 0.80% ✗
- Cap rate
- 6.71%
- Cash-on-cash
- 1.49%
- DSCR
- 1.07
- GRM
- 10.4
CMA / ARV
- ARV (median comp)
- $115,577
- List price
- $114,000
- Delta
- -1.36%
- Verdict
- FAIR
- Comps
- 20 within 1.0 mi
Show comp detail 12 sales within ~0.75 mi
| Address | Dist | Beds/Ba | Sqft | Sold | Price | $/sf | Match |
|---|---|---|---|---|---|---|---|
| 1122 N Brown Ave | 0.32mi | 2/1.0 | 704 (+2%) | 6mo | $115,000 | $163 | 77 |
| 1024 N Fulbright Ave | 0.20mi | 2/1.0 | 672 (-3%) | 10mo | $115,000 | $171 | 77 |
| 2435 W Calhoun St | 0.45mi | 2/1.0 | 700 (+1%) | 3mo | $140,000 | $200 | 75 |
| 1030 N Warren Ave | 0.46mi | 2/1.0 | 700 (+1%) | 7mo | $95,000 | $136 | 70 |
| 1200 N Ethyl Ave | 0.31mi | 2/1.0 | 728 (+5%) | 8mo | $69,900 | $96 | 70 |
| 810 N West Ave | 0.23mi | 2/1.0 | 768 (+11%) | 3mo | $119,000 | $155 | 69 |
| 229 N Scenic Ave | 0.53mi | 2/1.0 | 664 (-4%) | 12mo | $87,500 | $132 | 58 |
| 612 N Park Ave | 0.50mi | 2/1.0 | 624 (-10%) | 4mo | $89,900 | $144 | 57 |
| 207 N Forest Ave | 0.61mi | 2/1.0 | 624 (-10%) | 6mo | $125,000 | $200 | 50 |
| 2831 W Elm St | 0.74mi | 2/1.0 | 770 (+11%) | 4mo | $106,000 | $138 | 44 |
| 1016 N Wabash Ave | 0.74mi | 2/1.0 | 630 (-9%) | 9mo | $89,900 | $143 | 43 |
| 2956 W Olive St | 0.66mi | 1/1.0 (-1) | 780 (+13%) | 9mo | $159,900 | $205 | 36 |
Match score weights: distance 35% · size 25% · config 20% · recency 20%. Top-matched comps best support the ARV.
Projected returns pro-forma
-3.0% appreciation · 4.82% rent growth · sell at horizon
- IRR
- -12.2%
- Equity multiple
- 0.55×
- Total profit
- $-14,294
- Equity at exit
- $16,998
- IRR
- -0.9%
- Equity multiple
- 0.93×
- Total profit
- $-2,159
- Equity at exit
- $9,857
Cash invested: $31,920 (down + closing). Projections, not guarantees.
Landlord ↔ Tenant lean methodology
- Overall (STATE)
- 81 Strongly Landlord-Friendly
- State Missouri
- 81 Strongly Landlord-Friendly · R+10
- County
- — inherits STATE
- City
- — inherits STATE
ZIP-level market 65802
- Home prices YoY
- -31.9%
- Rents YoY
- 4.8%
- Active inventory
- 520
- Price-to-rent
- 10.4×
Monthly cashflow live
- Estimated rent
- $912 high interval (Pro) →
- Mortgage (P&I)
- −$598
- Tax from tax record
- −$35 /mo · $422/yr
- Insurance
- −$48
- HOA
- −$0
- Vacancy / Maint / Mgmt
- −$191
- Net cashflow
- $40
Break-even live
Sensitivity live
| Price | -10% $104 | -5% $72 | +0% $40 | +5% $7 | +10% $-25 |
|---|---|---|---|---|---|
| Rent | -10% $-32 | -5% $4 | +0% $40 | +5% $76 | +10% $112 |
| Rate | -1.0pp $97 | -0.5pp $69 | base $40 | +0.5pp $10 | +1.0pp $-20 |
UW: 25.0% down · 7.5% · 30yr · 1.5% tax · 5.0% vac · 8.0% maint · 8.0% mgmt
Financing live
Cash to close
- Down payment
- $28,500
- Closing costs
- $3,420
- Reserves months
- —
- Total cash needed
- —
Loan-product check · same deal, 3 products live
Conventional
25% down · 7.5% · 30yr
- Down + closing
- —
- Monthly P&I
- —
- Monthly cashflow
- —
- DSCR
- —
- Eligible?
- —
Personal DTI + credit; lowest rate.
DSCR
20% down · 8.5% · 30yr
- Down + closing
- —
- Monthly P&I
- —
- Monthly cashflow
- —
- DSCR
- —
- Eligible?
- —
No personal income docs; deal must DSCR.
Hard money
10% down · 12.0% · 12mo
- Down + closing
- —
- Monthly P&I
- —
- Monthly cashflow
- —
- DSCR
- —
- Eligible?
- —
Short-term bridge; refi at stabilization.
Rent comps 9 comps
| Address | Beds | Baths | Sqft | Rent | $/sqft | DOM | Units | Dist |
|---|---|---|---|---|---|---|---|---|
| 2712 W Nichols St Springfield, MO | 2.0 | 1.0 | 619 | $795 | $1.28 | 45d | 1 | 0.17mi |
| 2711 W Olive St Springfield, MO | 1.0 | 1.0 | 621 | $750 | $1.21 | 25d | 1 | 0.49mi |
| 522 N Park Ave Springfield, MO | 1.0 | 1.0 | 608 | $950 | $1.56 | 45d | 1 | 0.49mi |
| 520 S Scenic Ave Unit 101-A Springfield, MO | 1.0 | 1.0 | 550 | $650 | $1.18 | 45d | 1 | 0.75mi |
| 1740 W Olive St Springfield, MO | 3.0 | 1.0 | 736 | $1,195 | $1.62 | 15d | 1 | 0.91mi |
| 1911 W Elm St Springfield, MO | 2.0 | 1.0 | 580 | $875 | $1.51 | 45d | 1 | 0.96mi |
| 916 N Kansas Expy Springfield, MO | 1.0 | 1.0 | 573 | $595 | $1.04 | 45d | 1 | 0.96mi |
| 1126 W Hamilton St Springfield, MO | 2.0 | 1.0 | 648 | $895 | $1.38 | 25d | 1 | 1.33mi |
| 2115 N Grace Ave Springfield, MO | 2.0 | 1.0 | 650 | $850 | $1.31 | 45d | 1 | 1.39mi |
Listing history 19 events
-
2026-06-17days on market $114,000 Active 91 DOM
-
2026-06-16days on market $114,000 Active 90 DOM
-
2026-06-15days on market $114,000 Active 89 DOM
-
2026-06-14days on market $114,000 Active 87 DOM
-
2026-06-10days on market $114,000 Active 84 DOM
-
2026-06-09days on market $114,000 Active 83 DOM
-
2026-06-08days on market $114,000 Active 82 DOM
-
2026-06-07days on market $114,000 Active 81 DOM
-
2026-06-03days on market $114,000 Active 77 DOM
-
2026-06-02days on market $114,000 Active 76 DOM
-
2026-06-01days on market $114,000 Active 75 DOM
-
2026-05-31days on market $114,000 Active 74 DOM
-
2026-05-30days on market $114,000 Active 73 DOM
-
2026-03-18$114,000 Active 722-char remark
Show marketing remark (722 chars)
Investment, Rental Income. Cute Bungalow!! This house has 692 sqft, with 2 bedrooms, 1 full bathroom, a laundry room, and 2 carports. Plenty of kitchen cabinets and the kitchen appliances stay: refrigerator, natural gas cook stove. Flooring is laminate. Large backyard; 312' x 70', mostly fenced, and a storage shed for extra storage. The plumbing and electrical has been updated over time. Long-time renters and the monthly $800. income and leased through October here in Springfield, MO. Buy your first rental house or use your 1031exchange money to buy this one. The owner prefers to sell in as-is condition and chooses not to make any repairs if called out by the inspector. Pictures are from prior to tenant occupied.
-
2026-03-03price $114,000
-
2025-12-09$119,000 Active
-
2017-06-22soldstatus
-
2010-09-28soldstatus
-
2008-04-08soldstatus
ⓘ Source: listings_history table (triggers on properties + properties_extension) + one-shot
backfill from property_details.listing_events for pre-trigger history.
Tax reassessment forecast MO · Resets to sale price
- Current annual tax
- $422 · $35/mo
- Projected year-2 tax
- $1,106 · $92/mo
- Expected delta
- +$684/yr (+$57/mo · 162.1%)
ⓘ Screening estimate from a state-policy table — verify with the county assessor before closing.
Climate risk First Street
- Flood 1/10 Low FEMA zone X (unshaded) · 0% chance over 30 yrs
- Wildfire 1/10 Low
- Heat 4/10 Moderate 6 d/yr ≥104°F today · 18 d/yr by 30 yrs out
- Wind 2/10 Low 0% chance of damaging wind over 30 yrs
- Air quality 2/10 Low 1 unhealthy d/yr today · 2 by 30 yrs out
Nearby sold comps map
Loading sold comps map…
Walkable amenities ~0.75 mi
Loading nearby amenities…
Taxation est. · year 1
- Rental income
- $10,940
- − Mortgage interest
- −$6,386
- − Property taxes
- −$422
- − Insurance
- −$570
- − Repairs & maintenance
- −$875
- − Management
- −$875
- − Depreciation
- −$3,316
- Taxable loss
- −$1,504
- Est. tax savings @ 24.0%
- +$361
- After-tax cash flow
- $838/yr
For passive investors: Depreciation is non-cash, so a rental often shows a tax loss while cash-flowing — sheltering income. Rental losses are passive: they offset passive income freely, and up to $25,000/yr can offset ordinary (W-2) income if you actively participate and your MAGI is under $100k (phasing out to $0 by $150k); unused losses carry forward. On sale, claimed depreciation is recaptured at up to 25%, and gains may owe capital-gains tax (a 1031 exchange can defer both). Figures are a year-1 estimate at your 24.0% rate — not tax advice; consult a CPA.
Schools (NCES district)
- District
- Springfield R-XII
- NCES district ID
- 2928860
- Math proficiency
- 32% ▼ -2.00%
- Reading proficiency
- 46% ▼ -3.00%
- Median HH income
- $37,886
- Composite
- 32.45/100
- National rank
- #5717
- State rank
- #174 of 324 in MO
Livability — Springfield
- Score
- 75/100
- State rank
- #57
- US rank
- #4121
Category grades
Schools grade is shown separately in the Schools card above.
Census & demographics
- Census place
- Springfield, MO
- County
- Greene County · 244,327 people
- City population
- 223,044
- Metro
- Springfield, MO
- Population (ZIP)
- 46,739
- Household income
- $55,019
- Rent vs Own
- Severe rent burden
- 1818.0
Population outlook (Greene County) Hauer SSP2
- Today (2025)
- 319,054 people
- By 2030
- 335,135 · +5.0%
- By 2040
- 366,186 · +14.8%
- By 2050
- 397,431 · +24.6%
- By 2075
- 477,035 · +49.5%
- By 2100
- 520,828 · +63.2%
Race, ethnicity, and origin ACS 2023
- Neighborhood character
- Predominantly White (81%)
- Race & ethnicity
- White 81% Two or more races 8% Hispanic / Latino 5% Black 4% Asian 2%
- Common ancestry
- Slovak 2% Lithuanian 2% Italian 2%
- Foreign-born
- 3% · Canada, Vietnam
- Languages at home
- 95% English-only · Spanish 2% Vietnamese 1% Other Indo-European 1%
Political lean MEDSL · Greene
- 2024 margin
- Strong R (+20.8) · D 38.9% · R 59.7% · Other 1.4%
- 2008→2024 swing
- -5.0pp toward R · 2008: -15.8pp · 2024: -20.8pp
- All cycles
- 2024: R+20.8 2020: R+20.1 2016: R+27.4 2012: R+24.4 2008: R+15.8
Not yet ingested
- Civics
- —
Market trends
- HPI YoY
- ▼ -99.72%
- Current HPI
- 212.9826
- Rent YoY
- ▲ 4.82%
- Metro
- Springfield, MO
- State GDP YoY
- ▲ 1.84%
- F500 in state
- 20
Industry mix (Fortune 500 HQ in MO)
| Industry | F500 HQs | Revenue |
|---|---|---|
| Healthcare | 1 | $163B |
|
||
| Insurance | 1 | $21B |
|
||
| Industrial Technology | 1 | $17B |
|
||
| Retail | 1 | $16B |
|
||
| Industrial Distribution | 1 | $10B |
|
||
| Utilities | 1 | $9B |
|
||
Price history
-4.2% since first listed6 events — show timeline
- 2026-03-18 Listed $114,000 SOMO
- 2026-03-03 Price Changed $114,000 SOMO
- 2025-12-09 Listed $119,000 SOMO
- 2017-06-22 Sold (Public Records) — Public Records
- 2010-09-28 Sold (Public Records) — Public Records
- 2008-04-08 Sold (Public Records) — Public Records
Property tax history
+0.3%/yrLatest (2025): $422 · +5.3% YoY. Source: county tax records.
Cash-flow waterfall
monthlySold comps — $/sqft
last 12 mo · ≤1 miLoading sold comps…