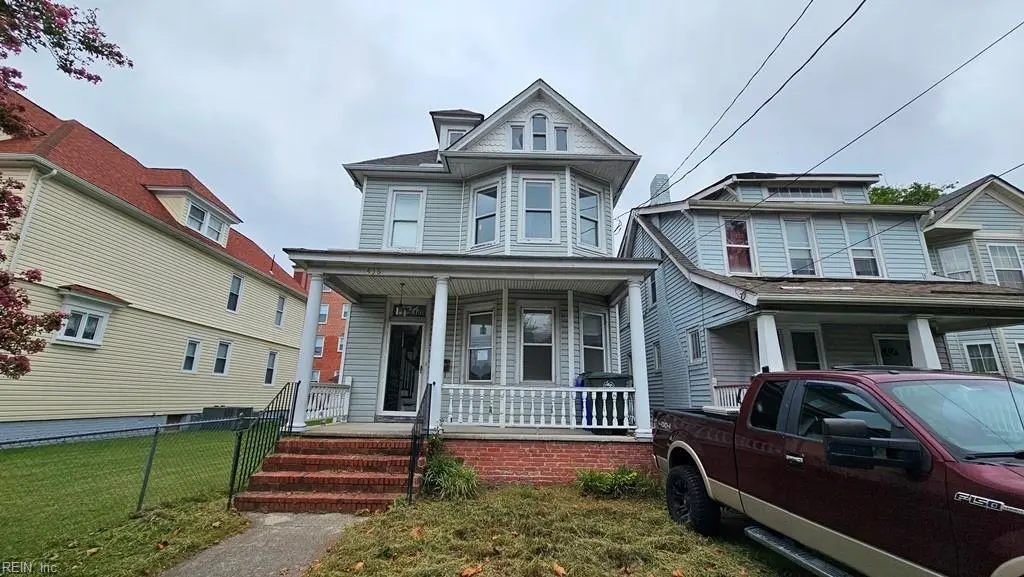
436 W 34th St · Norfolk, VA
Flood risk 5/10 · Moderate
- FEMA flood zone
- X (shaded)
- Chance of flooding over 30 yrs
- 0.21%
- Est. flood insurance / yr
- $507 – $1,088
Fire risk 1/10 · Minimal
- Est. fire insurance / yr
- $666 – $1,236
Heat risk 9/10 · Severe
- Hot days now (above 106°F)
- 7 days/yr
- Hot days in 30 yrs
- 16 days/yr
Wind risk 8/10 · Major
- Chance of severe wind over 30 yrs
- 80.0%
Air-quality risk 3/10 · Minor
- Unhealthy air days now
- 2 days/yr
- Unhealthy air days in 30 yrs
- 5 days/yr
Risk factors via First Street. Map © Google.
Why this score? — see what drove the B- grade
The composite is a weighted blend of 9 inputs, each scored 0–100. Each bar is that input's sub-score; the figure is the points it added to the 100-point composite (weight × sub-score).
- Cash flow +25.3/30.0
- ARV discount +15.0/15.0
- DSCR +8.4/10.0
- 1% rule +6.6/10.0
- Livability +4.2/5.0
- Rent growth +4.0/5.0
- Schools +3.5/10.0
- Condition / age +2.5/5.0
- Appreciation +0.0/10.0
$224,900
🖨 Deal sheet 📄 Offer letter ✓ Due diligence
Listing remarks
Unlock the charm of this classic Victorian nestled in the Virginia Place neighborhood of Norfolk. A welcoming front porch invites you into this two-story home featuring 10' ceilings, three bedrooms, and two bathrooms. Brimming with potential, this property is a blank canvas awaiting your vision. While it needs some TLC, it's the perfect opportunity to restore a piece of history and build instant equity. The walk-in attic offers incredible possibilities. Don't miss your chance to bring this diamond in the rough back to its former glory (there's even hardwood under the carpet. .)! Your dream home awaits your personal touch!
Key facts
- Walk-in attic
- 2,635 sq ft lot
- Built 1917
Tags
Property features AI
Finance
- Other: Fixer upper
- HOA & community: No HOA or association fees reported
Exterior
- Parking: Street parking
- Utilities: City/County sewer; Electric water heater; Electric power
- Home design: Detached Victorian home; 2 stories; Crawl foundation
- Construction: Vinyl exterior siding; Asphalt shingle roof; Crawl foundation
- Exterior features: Partial fence; Vinyl siding; Asphalt shingle roof
Interior
- Kitchen: Range
- Bedrooms: No bedroom and full bathroom on first floor
- Flooring: Carpet; Vinyl; Wood
- Bathrooms: 2 full bathrooms
- Heating & cooling: Forced hot air heating; Central air conditioning
- Interior features: One fireplace; Attic; Breakfast area; Porch; Carpet, vinyl and wood flooring
Neighborhood map
What this means for you Summary
Snapshot
- This is a 3-bed/2.0-bath single-family listed at $225k.
Deal economics
- At list price, monthly cash flow is $513 ($6k/yr) — positive.
- The deal already cash-flows at list — no discount required.
- Meets the 1% rule at list price ($3k rent vs $225k).
- Recommended offer: $222k (1.5% below list) — sets the bar for market timing.
- Cap rate 9.0% vs local median 4.0% in Norfolk — top-decile yield for the area; either an underpriced asset or a hidden risk that comps aren't pricing in. Stress-test before assuming the spread holds.
Location & tenants
- Location reads 83/100 on livability (#43 in VA, #1,026 nationally) — a professional / high-income tenant draw. Strengths: amenities A+, commute A+, health & safety A+; Watch: employment C-, crime F.
- Norfolk City Public School District (urban): math 27% / reading 56% proficiency, ranked #118 of 131 in VA (top 90%) — families likely to look elsewhere, expect single-tenant / working-renter base with shorter leases.
- Zoned schools: Granby Elementary (math 21% / reading 41%, grade F, #1,004 of 1,108 statewide, top 91%, 464 students, 99% FRL); Granby High (math 33% / reading 80%, grade C, #270 of 319 statewide, top 86%, 1,837 students, 94% FRL) — zoned schools average 97% FRL vs 59% district-wide (38 pts higher); higher-poverty schools than district average — tighter screening recommended.
- Market conditions: Rents rising fast (+6.0%/yr); 100 active listings in the ZIP; 40 comparable units currently listed for rent nearby; rentals at typical pace (median 20d on market — plan ~3-4 weeks tenant-placement turnaround); 438 units permitted in Norfolk city in 2024 (273 in 5+ unit buildings).
- This rent runs 42% of the median local income ($75k/yr) — at the standard rent-burdened threshold; future hikes will face affordability resistance.
Forward outlook
- Local home prices are declining (-3.0%/yr); year-one equity from $2k of loan paydown is wiped out by about $7k of value loss. Plan a longer hold.
- At projected returns (-3.0% appreciation + 6.0% rent growth), your $63k cash investment doubles in ~9 years — after that, you're playing with house money.
Negotiation context
- It's been on market 16 days — a 2% lower offer ($222k) is reasonable based on typical stale-listing flexibility.
- 3 sale attempts with the ask held roughly flat each time — persistent listings suggest the price (not the market) is what's stuck; bring a comps-based counter.
Risks & watch-outs
- Watch-outs: built in 1917 — expect roof / HVAC / electrical / plumbing capex.
- Climate carrying-cost: moderate flood risk; severe wind risk, 80% chance of damaging wind over 30y; extreme-heat days projected 7→16/yr by 2055 (HVAC capex compounding) — expect insurance premiums to compound above CPI over the hold.
Questions for the listing agent
- Built in 1917 — when were the roof, HVAC, electrical panel, plumbing, and water heater last replaced?
- Is there a deadline driving the sale (1031 exchange, divorce, estate, relocation)? That informs how much negotiation room exists.
- Schools are A-rated — typically a magnet for longer-tenancy family renters. What's the average tenant stay here, and is there a school-zone premium baked into asking?
- Crime grade is F in this area — have there been break-ins, vandalism, or insurance claims at this property in the last 3 years? What carrier currently insures it and at what premium?
- What's the average days-on-market for RENTAL listings here right now (not sales)? A rising rental-DOM trend means longer vacancies and softer asking-rent achievability than the comps imply.
- What's the recent tenant-quality profile in this submarket — average credit score on applications, eviction rate, late-payment / NSF rate, and stable-employment percentage? A property-management company in the area should have these aggregated.
- How much new for-sale + rental construction is in the pipeline within 1–3 miles? Heavy new supply typically softens prices + rents 12–24 months out; constrained supply supports both.
Investment metrics
- 1% rule
- 1.16% ✓
- Cap rate
- 9.03%
- Cash-on-cash
- 9.78%
- DSCR
- 1.44
- GRM
- 7.2
CMA / ARV
- ARV (median comp)
- $351,414
- List price
- $224,900
- Delta
- -36.00%
- Verdict
- UNDERPRICED
- Comps
- 20 within 1.0 mi
Show comp detail 12 sales within ~0.75 mi
| Address | Dist | Beds/Ba | Sqft | Sold | Price | $/sf | Match |
|---|---|---|---|---|---|---|---|
| 436 W 34th St | 0.00mi | 3/2.0 | 2,225 (0%) | 0mo | $220,000 | $99 | 100 |
| 3611 Debree Ave | 0.15mi | 4/2.5 (+1) | 2,236 (+0%) | 1mo | $405,000 | $181 | 84 |
| 526 W 36th St | 0.13mi | 4/2.5 (+1) | 2,200 (-1%) | 4mo | $374,900 | $170 | 82 |
| 408 W 29th St | 0.20mi | 4/2.0 (+1) | 2,153 (-3%) | 2mo | $342,000 | $159 | 79 |
| 205 W 36th St | 0.28mi | 4/2.5 (+1) | 2,199 (-1%) | 1mo | $284,000 | $129 | 77 |
| 624 W 28th St | 0.29mi | 4/2.5 (+1) | 2,225 (0%) | 3mo | $380,000 | $171 | 77 |
| 228 W 27th St | 0.37mi | 4/2.5 (+1) | 2,191 (-2%) | 4mo | $260,000 | $119 | 70 |
| 223 W 34th St | 0.23mi | 4/2.5 (+1) | 1,948 (-12%) | 4mo | $335,000 | $172 | 58 |
| 111 E 29th St | 0.47mi | 4/3.0 (+1) | 2,332 (+5%) | 3mo | $445,000 | $191 | 58 |
| 221 E 40th St | 0.63mi | 4/2.5 (+1) | 2,128 (-4%) | 4mo | $375,000 | $176 | 53 |
| 108 E 41st St | 0.60mi | 4/3.0 (+1) | 2,341 (+5%) | 4mo | $502,500 | $215 | 51 |
| 737 Pennsylvania Ave | 0.53mi | 3/1.5 | 1,920 (-14%) | 1mo | $426,500 | $222 | 50 |
Match score weights: distance 35% · size 25% · config 20% · recency 20%. Top-matched comps best support the ARV.
Projected returns pro-forma
-3.0% appreciation · 5.98% rent growth · sell at horizon
- IRR
- 1.8%
- Equity multiple
- 1.07×
- Total profit
- $4,360
- Equity at exit
- $33,533
- IRR
- 14.1%
- Equity multiple
- 2.29×
- Total profit
- $81,296
- Equity at exit
- $19,445
Cash invested: $62,972 (down + closing). Projections, not guarantees.
Landlord ↔ Tenant lean methodology
- Overall (STATE)
- 55 Moderately Landlord-Leaning
- State Virginia
- 55 Moderately Landlord-Leaning · D+2
- County
- — inherits STATE
- City
- — inherits STATE
ZIP-level market 23508
- Rents YoY
- 6.0%
- Active inventory
- 100
- Price-to-rent
- 7.2×
Monthly cashflow live
- Estimated rent
- $2,617 high interval (Pro) →
- Mortgage (P&I)
- −$1,179
- Tax from tax record
- −$281 /mo · $3,375/yr
- Insurance
- −$94
- HOA
- −$0
- Vacancy / Maint / Mgmt
- −$550
- Net cashflow
- $513
Break-even live
UW: 25.0% down · 7.5% · 30yr · 1.5% tax · 5.0% vac · 8.0% maint · 8.0% mgmt
Financing live
Cash to close
- Down payment
- $56,225
- Closing costs
- $6,747
- Reserves months
- —
- Total cash needed
- —
Loan-product check · same deal, 3 products live
Conventional
25% down · 7.5% · 30yr
- Down + closing
- —
- Monthly P&I
- —
- Monthly cashflow
- —
- DSCR
- —
- Eligible?
- —
Personal DTI + credit; lowest rate.
DSCR
20% down · 8.5% · 30yr
- Down + closing
- —
- Monthly P&I
- —
- Monthly cashflow
- —
- DSCR
- —
- Eligible?
- —
No personal income docs; deal must DSCR.
Hard money
10% down · 12.0% · 12mo
- Down + closing
- —
- Monthly P&I
- —
- Monthly cashflow
- —
- DSCR
- —
- Eligible?
- —
Short-term bridge; refi at stabilization.
Rent comps 40 comps
| Address | Beds | Baths | Sqft | Rent | $/sqft | DOM | Units | Dist |
|---|---|---|---|---|---|---|---|---|
| 325 W 31st St Unit 6 Norfolk, VA | 3.0 | 1.0 | 1400 | $1,750 | $1.25 | 23d | 1 | 0.18mi |
| 410 W 29th St Norfolk, VA | 4.0 | 2.0 | 2001 | $2,500 | $1.25 | 14d | 1 | 0.22mi |
| 630 W 36th St Norfolk, VA | 4.0 | 1.5 | 1650 | $2,200 | $1.33 | 23d | 1 | 0.23mi |
| 220 Broadway St Norfolk, VA | 4.0 | 3.0 | 2540 | $3,500 | $1.38 | 43d | 1 | 0.25mi |
| 426 W 28th St Norfolk, VA | 3.0 | 3.0 | 2034 | $2,850 | $1.40 | 17d | 1 | 0.26mi |
| 212 Broadway St Norfolk, VA | 4.0 | 2.5 | 2350 | $2,800 | $1.19 | 14d | 1 | 0.28mi |
| 212 Broadway St Norfolk, VA | 4.0 | 2.5 | 2349 | $2,900 | $1.23 | 17d | 1 | 0.28mi |
| 623 Virginia Ave Norfolk, VA | 3.0 | 1.5 | 1600 | $2,200 | $1.38 | 17d | 1 | 0.33mi |
| 3239 Granby St Norfolk, VA | 4.0 | 3.5 | 2350 | $2,600 | $1.11 | 11d | 1 | 0.34mi |
| 407 Pennsylvania Ave Norfolk, VA | 4.0 | 2.5 | 2200 | $3,200 | $1.45 | 43d | 1 | 0.36mi |
| 3805 Granby St Unit D Norfolk, VA | 3.0 | 2.5 | 1911 | $2,500 | $1.31 | 23d | 1 | 0.37mi |
| 3611 Colley Ave Apt 106 Norfolk, VA | 3.0 | 2.0 | 2686 | $2,550 | $0.95 | 17d | 1 | 0.41mi |
| 4013 Colley Ave Norfolk, VA | 4.0 | 2.0 | 1450 | $2,600 | $1.79 | 43d | 1 | 0.48mi |
| 4511 Newport Ave Unit 4511 -A Norfolk, VA | 4.0 | 3.0 | 2068 | $2,600 | $1.26 | 43d | 1 | 0.48mi |
| 4608 Gosnold Ave Norfolk, VA | 4.0 | 2.5 | 2600 | $4,700 | $1.81 | 23d | 1 | 0.56mi |
| 829 43rd St Norfolk, VA | 4.0 | 1.5 | 1500 | $2,695 | $1.80 | 23d | 1 | 0.59mi |
| 4010 Holly Ave Unit 2 Norfolk, VA | 3.0 | 1.0 | 1400 | $1,700 | $1.21 | 43d | 1 | 0.75mi |
| 810 Brandon Ave Norfolk, VA | 3.0 | 1.0 | 1420 | $2,350 | $1.65 | 14d | 1 | 0.80mi |
| 1215 W 27th St Norfolk, VA | 3.0 | 3.0 | 1700 | $2,700 | $1.59 | 43d | 1 | 0.82mi |
| 1218 W 26th St Norfolk, VA | 3.0 | 2.5 | 1524 | $2,250 | $1.48 | 7d | 1 | 0.85mi |
| 824 50th St Norfolk, VA | 3.0 | 1.5 | 1516 | $2,400 | $1.58 | 23d | 1 | 0.88mi |
| 823 Shirley Ave Norfolk, VA | 3.0 | 2.5 | 2740 | $3,775 | $1.38 | 10d | 1 | 0.92mi |
| 901 Shirley Ave Unit A2 Norfolk, VA | 3.0 | 2.0 | 1800 | $2,195 | $1.22 | 43d | 1 | 0.93mi |
| 901 Shirley Ave Unit A2 Norfolk, VA | 3.0 | 2.0 | 1800 | $2,195 | $1.22 | 20d | 1 | 0.93mi |
| 1009 Brandon Ave Unit 6 Norfolk, VA | 2.0 | 1.0 | 1400 | $1,500 | $1.07 | 12d | 1 | 0.96mi |
| 3114 Luxembourg Ave Norfolk, VA | 4.0 | 2.5 | 2300 | $3,100 | $1.35 | 17d | 1 | 1.02mi |
| 736 W Princess Anne Rd #102 Norfolk, VA | 2.0 | 2.0 | 1513 | $2,400 | $1.59 | 2d | 1 | 1.02mi |
| 736 W Princess Anne Rd #102 Norfolk, VA | 2.0 | 2.0 | 1500 | $2,400 | $1.60 | 43d | 1 | 1.02mi |
| 810 W Princess Anne Rd #303 Norfolk, VA | 3.0 | 2.0 | 1483 | $2,300 | $1.55 | 23d | 1 | 1.04mi |
| 810 W Princess Anne Rd #303 Norfolk, VA | 3.0 | 2.0 | 1483 | $2,400 | $1.62 | 43d | 1 | 1.04mi |
| 625 W Princess Anne Rd Unit 6 Norfolk, VA | 3.0 | 1.5 | 1650 | $1,995 | $1.21 | 20d | 1 | 1.05mi |
| 621 W Princess Anne Rd Norfolk, VA | 2.0 | 1.0 | 1535 | $1,950 | $1.27 | 10d | 1 | 1.05mi |
| 881 Rugby St Norfolk, VA | 3.0 | 2.0 | 1600 | $2,650 | $1.66 | 23d | 1 | 1.05mi |
| 1336 W 38th St Unit A Norfolk, VA | 4.0 | 1.5 | 1474 | $2,200 | $1.49 | 3d | 1 | 1.05mi |
| 622 Graydon Ave Unit 5 Norfolk, VA | 3.0 | 2.0 | 1500 | $1,700 | $1.13 | 16d | 1 | 1.07mi |
| 1350 W 38th St Unit B Norfolk, VA | 3.0 | 3.0 | 2200 | $2,650 | $1.20 | 7d | 1 | 1.08mi |
| 1350 W 38th St Unit A Norfolk, VA | 4.0 | 2.0 | 2600 | $3,200 | $1.23 | 7d | 1 | 1.08mi |
| 907 Rugby St Norfolk, VA | 3.0 | 2.0 | 1515 | $2,200 | $1.45 | 43d | 1 | 1.08mi |
| 1415 Claremont Ave Norfolk, VA | 3.0 | 2.5 | 2129 | $3,000 | $1.41 | 3d | 1 | 1.08mi |
| 937 Bolling Ave Norfolk, VA | 3.0 | 3.5 | 2034 | $2,995 | $1.47 | 21d | 1 | 1.09mi |
Listing history 9 events
-
2026-05-11$224,900 Active 628-char remark
-
2026-02-28historical
-
2026-02-27status Active
-
2026-02-23historical Active Under Contract
-
2026-01-22price $219,900
-
2025-12-16price $229,900
-
2025-10-23price $239,900
-
2025-09-24price $249,900
-
2025-08-22$259,900 Active
ⓘ Source: listings_history table (triggers on properties + properties_extension) + one-shot
backfill from property_details.listing_events for pre-trigger history.
Tax reassessment forecast VA · Resets to sale price
- Current annual tax
- $3,375 · $281/mo
- Projected year-2 tax
- $3,375 · $281/mo
- Expected delta
- $0/yr ($0/mo · 0.0%)
ⓘ Screening estimate from a state-policy table — verify with the county assessor before closing.
Climate risk First Street
- Flood 5/10 Major FEMA zone X (shaded) · 21% chance over 30 yrs
- Wildfire 1/10 Low
- Heat 9/10 Extreme 7 d/yr ≥106°F today · 16 d/yr by 30 yrs out
- Wind 8/10 Severe 80% chance of damaging wind over 30 yrs
- Air quality 3/10 Moderate 2 unhealthy d/yr today · 5 by 30 yrs out
Nearby sold comps map
Loading sold comps map…
Walkable amenities ~0.75 mi
Loading nearby amenities…
Taxation est. · year 1
- Rental income
- $31,405
- − Mortgage interest
- −$12,598
- − Property taxes
- −$3,375
- − Insurance
- −$1,124
- − Repairs & maintenance
- −$2,512
- − Management
- −$2,512
- − Depreciation
- −$6,543
- Taxable income
- $2,741
- Est. tax owed @ 24.0%
- −$658
- After-tax cash flow
- $5,500/yr
For passive investors: Depreciation is non-cash, so a rental often shows a tax loss while cash-flowing — sheltering income. Rental losses are passive: they offset passive income freely, and up to $25,000/yr can offset ordinary (W-2) income if you actively participate and your MAGI is under $100k (phasing out to $0 by $150k); unused losses carry forward. On sale, claimed depreciation is recaptured at up to 25%, and gains may owe capital-gains tax (a 1031 exchange can defer both). Figures are a year-1 estimate at your 24.0% rate — not tax advice; consult a CPA.
Schools (NCES district)
- District
- Norfolk City Public School District
- NCES district ID
- 5102670
- Math proficiency
- 27% ▼ -44.00%
- Reading proficiency
- 56% ▼ -10.00%
- Median HH income
- $44,358
- Composite
- 35.08/100
- National rank
- #5026
- State rank
- #118 of 131 in VA
Livability — Norfolk
- Score
- 83/100
- State rank
- #43
- US rank
- #1026
Category grades
Schools grade is shown separately in the Schools card above.
Census & demographics
- Census place
- Norfolk, VA
- County
- Norfolk City · 214,042 people
- City population
- 214,042
- Metro
- Virginia Beach-Norfolk-Newport News, VA-NC
- Population (ZIP)
- 19,432
- Household income
- $74,885
- Rent vs Own
- Severe rent burden
- 861.0
Population outlook (Norfolk County) Hauer SSP2
- Today (2025)
- 249,032 people
- By 2030
- 252,347 · +1.3%
- By 2040
- 253,644 · +1.9%
- By 2050
- 251,913 · +1.2%
- By 2075
- 245,281 · -1.5%
- By 2100
- 219,548 · -11.8%
Race, ethnicity, and origin ACS 2023
- Neighborhood character
- Diverse neighborhood (Simpson 0.64)
- Race & ethnicity
- White 49% Black 33% Two or more races 9% Hispanic / Latino 7% Asian 4%
- Hispanic origin (detail)
- Mexican 2% Puerto Rican 2% Cuban 2%
- Common ancestry
- Lithuanian 2% Slovak 2% Romanian 1%
- Foreign-born
- 6% · Canada, China
- Languages at home
- 90% English-only · Spanish 3% Other Indo-European 3% French/Haitian/Cajun 1%
Political lean MEDSL · Norfolk
- 2024 margin
- Solid D (+41.5) · D 70.0% · R 28.5% · Other 1.6%
- 2008→2024 swing
- -1.4pp toward R · 2008: 43.0pp · 2024: 41.5pp
- All cycles
- 2024: D+41.5 2020: D+45.6 2016: D+42.0 2012: D+44.0 2008: D+43.0
Not yet ingested
- Civics
- —
Market trends
- HPI YoY
- ▼ -401.24%
- Current HPI
- 312.9923
- Rent YoY
- ▲ 5.98%
- Metro
- Virginia Beach-Norfolk-Newport News, VA-NC
- State GDP YoY
- ▲ 2.40%
- F500 in state
- 50
Industry mix (Fortune 500 HQ in VA)
| Industry | F500 HQs | Revenue |
|---|---|---|
| Aerospace / Defense | 4 | $236B |
|
||
| Technology / Defense | 3 | $32B |
|
||
| Financial Services | 2 | $176B |
|
||
| Utilities | 2 | $27B |
|
||
| Insurance | 2 | $25B |
|
||
| Technology | 2 | $15B |
|
||
Price history
-15.4% since first listed12 events — show timeline
- 2026-06-05 Sold (MLS) $220,000 REINMLS
- 2026-05-27 Pending — REINMLS
- 2026-05-23 Contingent — REINMLS
- 2026-05-11 Listed $224,900 REINMLS
- 2026-02-28 Listing Removed — REINMLS
- 2026-02-27 Relisted — REINMLS
- 2026-02-23 Contingent — REINMLS
- 2026-01-22 Price Changed $219,900 REINMLS
- 2025-12-16 Price Changed $229,900 REINMLS
- 2025-10-23 Price Changed $239,900 REINMLS
- 2025-09-24 Price Changed $249,900 REINMLS
- 2025-08-22 Listed $259,900 REINMLS
Property tax history
+4.5%/yrLatest (2025): $3,375 · +3.4% YoY. Source: county tax records.
Cash-flow waterfall
monthlySold comps — $/sqft
last 12 mo · ≤1 miLoading sold comps…