9691 Stoneypointe Dr · Ira, MI
Flood risk 1/10 · Minimal
- FEMA flood zone
- X (unshaded)
- Chance of flooding over 30 yrs
- 0.0%
- Est. flood insurance / yr
- $507 – $1,088
Fire risk 2/10 · Minimal
- Est. fire insurance / yr
- $784 – $1,456
Heat risk 3/10 · Minor
- Hot days now (above 96°F)
- 7 days/yr
- Hot days in 30 yrs
- 15 days/yr
Wind risk 1/10 · Minimal
- Chance of severe wind over 30 yrs
- —
Air-quality risk 4/10 · Minor
- Unhealthy air days now
- 4 days/yr
- Unhealthy air days in 30 yrs
- 6 days/yr
Risk factors via First Street. Map © Google.
Why this score? — see what drove the D grade
The composite is a weighted blend of 9 inputs, each scored 0–100. Each bar is that input's sub-score; the figure is the points it added to the 100-point composite (weight × sub-score).
- Cash flow +15.0/30.0
- ARV discount +7.5/15.0
- 1% rule +5.0/10.0
- DSCR +5.0/10.0
- Schools +4.4/10.0
- Rent growth +2.5/5.0
- Livability +2.5/5.0
- Condition / age +2.2/5.0
- Appreciation +0.0/10.0
$29,900
🖨 Deal sheet 📄 Offer letter ✓ Due diligence
Listing remarks MLS
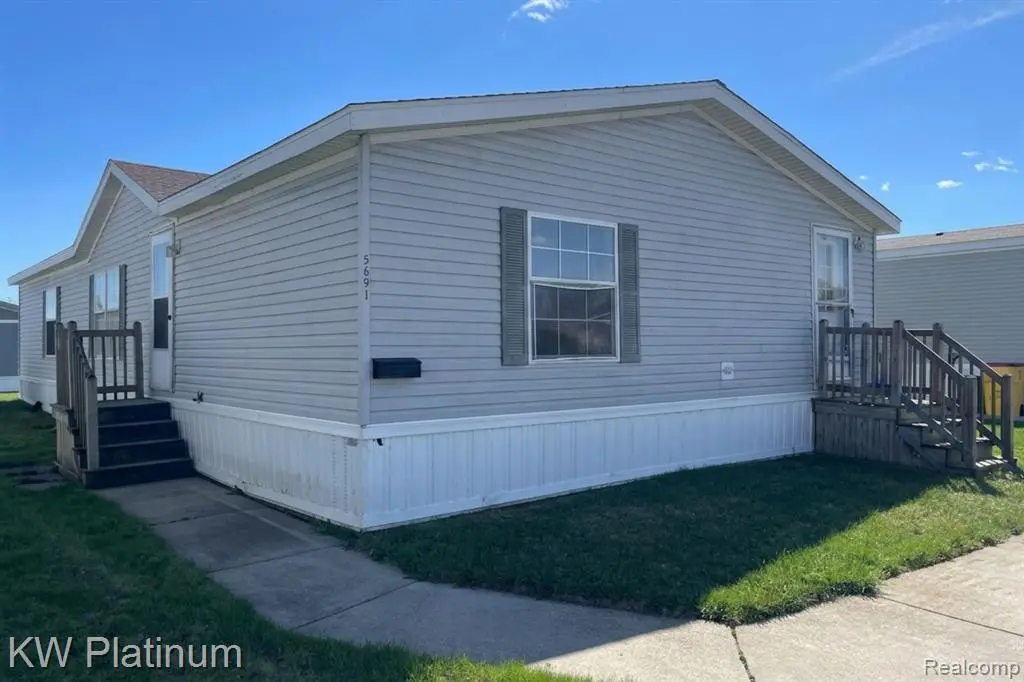
WELCOME TO THE SHORES OF ANCHOR BAY, JUST OUTSIDE OF NEW BALTIMORE! THIS 3 BEDROOM, 2 FULL BATH RANCH IS READY FOR IT'S NEW OWNER. THERE'S AN UPDATED FURANCE AND WATER HEATER. ALL APPLIANCES ARE INCLUDED. ANCHOR BAY SCHOOLS. KEYS AT CLOSING. CALL TODAY FOR A PRIVATE SHOWING!
Key facts
- 3,000 sq ft lot
- Community pool
- Built 1997
Property features AI
Finance
- HOA & community: Homeowners association with monthly fee of $638; HOA covers grounds maintenance, trash, and water
Exterior
- Parking: No garage
- Utilities: Public water; Public sewer
- Home design: Single-family residence; One level; Ground-level entry with steps
- Construction: Vinyl siding
- Exterior features: Community pool; Community clubhouse; Paved road access; Lot approximately 30 x 100
Interior
- Kitchen: Free-standing gas range; Free-standing refrigerator; Dishwasher; Disposal
- Bathrooms: Two full bathrooms
- Heating & cooling: Forced air heating (natural gas); Central air conditioning; Ceiling fans
- Interior features: Gas fireplace in the living room; Crawl space basement; Laundry room
- Laundry & utility: Washer and dryer; Gas water heater
Neighborhood map
What this means for you Summary
Snapshot
- This is a 3-bed/2.0-bath single-family listed at $30k. Condition is rated fair.
Deal economics
- At list price, monthly cash flow is $616 ($7k/yr) — positive.
- The deal already cash-flows at list — no discount required.
- Meets the 1% rule at list price ($2k rent vs $30k).
- Recommended offer: $29k (3.0% below list) — sets the bar for market timing.
Location & tenants
- Location reads: area grade D — affects rentability + tenant quality, not the cash-flow math above.
- Anchor Bay School District (suburban): math 44% / reading 54% proficiency, ranked #91 of 540 in MI (top 17%) — families likely to look elsewhere, expect single-tenant / working-renter base with shorter leases; only 20% free/reduced lunch — higher-income household profile.
- Market conditions: 36 active listings in the ZIP; 2 comparable units currently listed for rent nearby; 232 units permitted in St. Clair County in 2024 (0 in 5+ unit buildings).
Forward outlook
- Local home prices are declining (-3.0%/yr); year-one equity from $207 of loan paydown is wiped out by about $897 of value loss. Plan a longer hold.
- St. Clair County population projected at -20% by 2050 — secular population decline; favor cash flow + early exit over multi-decade hold.
- At projected returns (-3.0% appreciation + 3.0% rent growth), your $8k cash investment doubles in ~2 years — after that, you're playing with house money.
Negotiation context
- It's been on market 49 days — a 3% lower offer ($29k) is reasonable based on typical stale-listing flexibility.
- 2 sale attempts with the ask held roughly flat each time — persistent listings suggest the price (not the market) is what's stuck; bring a comps-based counter.
Risks & watch-outs
- Watch-outs: HOA is 35% of rent.
Questions for the listing agent
- It's been on market 49 days. Have you received any prior offers? Is the seller open to a 3% concession, seller financing, or rate buy-down credit?
- Have any recent inspections been done? Can we get a copy of the seller's disclosures and any deferred-maintenance estimates?
- What does the HOA fee cover, when was the last increase, and are there any pending special assessments or reserve-fund shortfalls?
- Is there a deadline driving the sale (1031 exchange, divorce, estate, relocation)? That informs how much negotiation room exists.
- The area grade is low — what's the realistic commute time and amenity access for the typical tenant pool here? Any planned neighborhood developments (good or bad) we should know about?
- What's the average days-on-market for RENTAL listings here right now (not sales)? A rising rental-DOM trend means longer vacancies and softer asking-rent achievability than the comps imply.
- What's the recent tenant-quality profile in this submarket — average credit score on applications, eviction rate, late-payment / NSF rate, and stable-employment percentage? A property-management company in the area should have these aggregated.
- How much new for-sale + rental construction is in the pipeline within 1–3 miles? Heavy new supply typically softens prices + rents 12–24 months out; constrained supply supports both.
Investment metrics
- 1% rule
- 6.18% ✓
- Cap rate
- 31.01%
- Cash-on-cash
- 88.29%
- DSCR
- 4.93
- GRM
- 1.3
CMA / ARV
- ARV (median comp)
- $304,278
- List price
- $29,900
- Delta
- -90.17%
- Verdict
- UNDERPRICED
- Comps
- 17 within 1.0 mi
Show comp detail 3 sales within ~0.75 mi
| Address | Dist | Beds/Ba | Sqft | Sold | Price | $/sf | Match |
|---|---|---|---|---|---|---|---|
| 10520 Frontenay Ct | 0.55mi | 3/2.0 | 1,568 (+2%) | 24mo | $142,000 | $91 | 51 |
| 6802 Church Rd | 0.75mi | 3/2.0 | 1,618 (+6%) | 8mo | $330,000 | $204 | 49 |
| 10425 LE Grande Blvd | 0.31mi | 3/1.5 | 1,344 (-12%) | 23mo | $129,000 | $96 | 43 |
Match score weights: distance 35% · size 25% · config 20% · recency 20%. Top-matched comps best support the ARV.
Projected returns pro-forma
-3.0% appreciation · 3.0% rent growth · sell at horizon
- IRR
- 89.3%
- Equity multiple
- 5.16×
- Total profit
- $34,807
- Equity at exit
- $4,458
- IRR
- 92.4%
- Equity multiple
- 10.86×
- Total profit
- $82,533
- Equity at exit
- $2,585
Cash invested: $8,372 (down + closing). Projections, not guarantees.
Landlord ↔ Tenant lean methodology
- Overall (STATE)
- 62 Landlord-Friendly
- State Michigan
- 62 Landlord-Friendly · EVEN
- County
- — inherits STATE
- City
- — inherits STATE
ZIP-level market 48023
- Home prices YoY
- -18.6%
- Active inventory
- 36
- Price-to-rent
- 1.3×
Monthly cashflow live
- Estimated rent
- $1,849 medium interval (Pro) →
- Mortgage (P&I)
- −$157
- Tax est. 1.5%
- −$37 /mo · $448/yr
- Insurance
- −$12
- HOA
- −$638
- Vacancy / Maint / Mgmt
- −$388
- Net cashflow
- $616
Break-even live
UW: 25.0% down · 7.5% · 30yr · 1.5% tax · 5.0% vac · 8.0% maint · 8.0% mgmt
Financing live
Cash to close
- Down payment
- $7,475
- Closing costs
- $897
- Reserves months
- —
- Total cash needed
- —
Loan-product check · same deal, 3 products live
Conventional
25% down · 7.5% · 30yr
- Down + closing
- —
- Monthly P&I
- —
- Monthly cashflow
- —
- DSCR
- —
- Eligible?
- —
Personal DTI + credit; lowest rate.
DSCR
20% down · 8.5% · 30yr
- Down + closing
- —
- Monthly P&I
- —
- Monthly cashflow
- —
- DSCR
- —
- Eligible?
- —
No personal income docs; deal must DSCR.
Hard money
10% down · 12.0% · 12mo
- Down + closing
- —
- Monthly P&I
- —
- Monthly cashflow
- —
- DSCR
- —
- Eligible?
- —
Short-term bridge; refi at stabilization.
Rent comps 2 comps
| Address | Beds | Baths | Sqft | Rent | $/sqft | DOM | Units | Dist |
|---|---|---|---|---|---|---|---|---|
| 7061 Bethuy Rd Ira Township, MI | 1.0–4.0 | 1.0–2.0 | 1204 | $1,576 | $1.31 | 3d | 1 | 0.45mi |
| 9769 Dixie Hwy Ira Township, MI | 3.0 | 2.0 | 1056 | $2,500 | $2.37 | 24d | 1 | 0.94mi |
HOA detail
- Monthly dues
- $638 · $7,656/yr
- Likely covers
- water
Listing history 15 events
-
2026-06-18days on market $29,900 Active 49 DOM
-
2026-06-17days on market $29,900 Active 48 DOM
-
2026-06-16days on market $29,900 Active 47 DOM
-
2026-06-15days on market $29,900 Active 46 DOM
-
2026-06-13days on market $29,900 Active 44 DOM
-
2026-06-09days on market $29,900 Active 40 DOM
-
2026-06-08days on market $29,900 Active 39 DOM
-
2026-06-07days on market $29,900 Active 38 DOM
-
2026-06-04days on market $29,900 Active 35 DOM
-
2026-06-03days on market $29,900 Active 34 DOM
-
2026-06-02days on market $29,900 Active 33 DOM
-
2026-06-01days on market $29,900 Active 32 DOM
-
2026-05-31days on market $29,900 Active 31 DOM
-
2026-04-30$29,900 Active 275-char remark
Show marketing remark (275 chars)
WELCOME TO THE SHORES OF ANCHOR BAY, JUST OUTSIDE OF NEW BALTIMORE! THIS 3 BEDROOM, 2 FULL BATH RANCH IS READY FOR IT'S NEW OWNER. THERE'S AN UPDATED FURANCE AND WATER HEATER. ALL APPLIANCES ARE INCLUDED. ANCHOR BAY SCHOOLS. KEYS AT CLOSING. CALL TODAY FOR A PRIVATE SHOWING!
ⓘ Source: listings_history table (triggers on properties + properties_extension) + one-shot
backfill from property_details.listing_events for pre-trigger history.
Climate risk First Street
- Flood 1/10 Low FEMA zone X (unshaded) · 0% chance over 30 yrs
- Wildfire 2/10 Low
- Heat 3/10 Moderate 7 d/yr ≥96°F today · 15 d/yr by 30 yrs out
- Wind 1/10 Low
- Air quality 4/10 Moderate 4 unhealthy d/yr today · 6 by 30 yrs out
Nearby sold comps map
Loading sold comps map…
Walkable amenities ~0.75 mi
Loading nearby amenities…
Taxation est. · year 1
- Rental income
- $22,187
- − Mortgage interest
- −$1,675
- − Property taxes
- −$448
- − Insurance
- −$150
- − Repairs & maintenance
- −$1,775
- − Management
- −$1,775
- − HOA
- −$7,656
- − Depreciation
- −$870
- Taxable income
- $7,838
- Est. tax owed @ 24.0%
- −$1,881
- After-tax cash flow
- $5,511/yr
For passive investors: Depreciation is non-cash, so a rental often shows a tax loss while cash-flowing — sheltering income. Rental losses are passive: they offset passive income freely, and up to $25,000/yr can offset ordinary (W-2) income if you actively participate and your MAGI is under $100k (phasing out to $0 by $150k); unused losses carry forward. On sale, claimed depreciation is recaptured at up to 25%, and gains may owe capital-gains tax (a 1031 exchange can defer both). Figures are a year-1 estimate at your 24.0% rate — not tax advice; consult a CPA.
Condition & rehab AI · 12 photos
This home requires moderate renovations, including exterior siding, kitchen cabinets, bathroom fixtures, and flooring. Painting and updating these areas can significantly increase its resale and rental value.
Repairs flagged
- Major exterior siding — Significant weathering and discoloration
- Major kitchen cabinets — Older, dated design
- Major bathroom fixtures — Older, dated design
- Major flooring — Worn carpet, visible wear
Value-add opportunities
- Both Paint interior walls — Fresh paint can improve the home's appearance and value
- Both Replace kitchen cabinets — Modern cabinets can significantly increase the home's appeal and value
- Both Replace bathroom fixtures — Up-to-date fixtures can improve the home's functionality and value
- Both Replace flooring — New flooring can improve the home's appearance and functionality, and can be a significant selling point
Renovation cost estimate screening
| Repair item | Severity | Est. cost |
|---|---|---|
| exterior siding · Significant weathering and discoloration | Major | $15,000–50,000 |
| kitchen cabinets · Older, dated design | Major | $15,000–50,000 |
| bathroom fixtures · Older, dated design | Major | $15,000–50,000 |
| flooring · Worn carpet, visible wear | Major | $15,000–50,000 |
| Total estimated repair cost · 4 items | $60,000–200,000 |
Value-add ROI direction
- Both Paint interior walls — Fresh paint can improve the home's appearance and value ↑
- Both Replace kitchen cabinets — Modern cabinets can significantly increase the home's appeal and value ↑
- Both Replace bathroom fixtures — Up-to-date fixtures can improve the home's functionality and value ↑
- Both Replace flooring — New flooring can improve the home's appearance and functionality, and can be a significant selling point ↑
ⓘ Cost ranges are severity-bucket heuristics (US national rule-of-thumb). Get contractor quotes + a written scope before underwriting a rehab budget.
Schools (NCES district)
- District
- Anchor Bay School District
- NCES district ID
- 2602790
- Math proficiency
- 44% ▼ -12.00%
- Reading proficiency
- 54% ▼ -7.00%
- Median HH income
- $70,173
- Composite
- 43.85/100
- National rank
- #2925
- State rank
- #91 of 540 in MI
Livability — Ira
No livability data for this city. (Only ~50 U.S. cities are tracked.)
Census & demographics
- Population (ZIP)
- 4,980
Population outlook (St. Clair County) Hauer SSP2
- Today (2025)
- 154,587 people
- By 2030
- 150,031 · -2.9%
- By 2040
- 138,177 · -10.6%
- By 2050
- 124,390 · -19.5%
- By 2075
- 95,825 · -38.0%
- By 2100
- 68,672 · -55.6%
Race, ethnicity, and origin ACS 2023
- Neighborhood character
- Predominantly White (91%)
- Race & ethnicity
- White 91% Two or more races 5% Black 3%
- Common ancestry
- Romanian 16% Lithuanian 7% Slovak 2%
- Foreign-born
- 1%
- Languages at home
- 99% English-only · Arabic 1%
Political lean MEDSL · St. Clair
- 2024 margin
- Solid R (+34.6) · D 32.0% · R 66.6% · Other 1.4%
- 2008→2024 swing
- -37.3pp toward R · 2008: 2.6pp · 2024: -34.6pp
- All cycles
- 2024: R+34.6 2020: R+30.2 2016: R+31.4 2012: R+7.1 2008: D+2.6
Not yet ingested
- Civics
- —
Market trends
- HPI YoY
- ▼ -45.80%
- Current HPI
- 200.5277
- Rent YoY
- —
- Metro
- —
- State GDP YoY
- ▲ 1.37%
- F500 in state
- 28
Industry mix (Fortune 500 HQ in MI)
| Industry | F500 HQs | Revenue |
|---|---|---|
| Automotive Parts | 3 | $48B |
|
||
| Automotive | 2 | $372B |
|
||
| Chemicals | 1 | $45B |
|
||
| Automotive Retail | 1 | $29B |
|
||
| Healthcare / Medical Devices | 1 | $23B |
|
||
| Automotive Technology | 1 | $20B |
|
||
Price history
+0.0% since first listed2 events — show timeline
- 2026-04-30 Listed $29,900 MiRealSource-MiMLS
- 2026-04-30 Listed $29,900 REALCOMP
Cash-flow waterfall
monthlySold comps — $/sqft
last 12 mo · ≤1 miLoading sold comps…