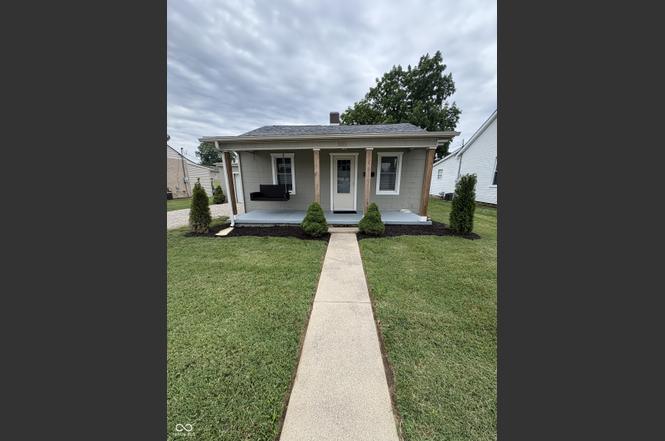
505 N Clay St · Edinburgh, IN
Flood risk 3/10 · Minor
- FEMA flood zone
- X (unshaded)
- Chance of flooding over 30 yrs
- 0.2%
- Est. flood insurance / yr
- $473 – $860
Fire risk 1/10 · Minimal
- Est. fire insurance / yr
- $717 – $1,331
Heat risk 4/10 · Minor
- Hot days now (above 103°F)
- 7 days/yr
- Hot days in 30 yrs
- 19 days/yr
Wind risk 2/10 · Minimal
- Chance of severe wind over 30 yrs
- 1.0%
Air-quality risk 2/10 · Minimal
- Unhealthy air days now
- 1 days/yr
- Unhealthy air days in 30 yrs
- 1 days/yr
Risk factors via First Street. Map © Google.
Why this score? — see what drove the F grade
The composite is a weighted blend of 9 inputs, each scored 0–100. Each bar is that input's sub-score; the figure is the points it added to the 100-point composite (weight × sub-score).
- ARV discount +7.5/15.0
- Cash flow +7.1/30.0
- Livability +3.1/5.0
- Schools +2.8/10.0
- Rent growth +2.5/5.0
- Condition / age +2.5/5.0
- 1% rule +1.9/10.0
- DSCR +1.3/10.0
- Appreciation +0.0/10.0
$159,900
🖨 Deal sheet (PDF) 📄 Offer letter ✓ Due diligence
Listing remarks MLS
Just one mile from Interstate 65, this two bedroom one bath home with attached one car garage has lots of potential. This block home has upgraded electrical system, new tub/shower combo, new vanity and toilet. New vinyl runs from bath into hall and on into the kitchen. Kitchen includes refrigerator, microwave, gas range and dishwasher. As part of the sale there is a storage building in the back yard. A full basement provides lots of storage. The washer/dryer hookups are on the main floor in a room by themselves. With some work, this home makes home ownership affordable. Property is being sold "As Is".
Key facts
- Covered front porch
- Unfinished basement
- Storage shed
Tags
Property features AI
Finance
- Other: Lot approximately 0.15 acres (< 1/4 acre)
Exterior
- Parking: Attached garage (1 car)
- Utilities: Public water; Municipal sewer connected; Natural gas connected; Cable available; 100 Amp electric service
- Home design: Single-family residence; Updated/remodeled condition; One level
- Construction: Block construction; Block foundation
- Exterior features: Sidewalks; Mature trees; Porch; Exterior storage
Interior
- Kitchen: Dishwasher; Microwave; Gas oven; Refrigerator
- Bedrooms: Two bedrooms on the main level
- Bathrooms: One full bathroom on the main level
- Heating & cooling: Forced air heating (natural gas); Central air conditioning
- Interior features: Attic access; Unfinished basement; Porch; Storage
- Laundry & utility: Laundry room (main level); Electric water heater
Neighborhood map
What this means for you Summary
Snapshot
- This is a 2-bed/1.0-bath single-family listed at $160k.
Deal economics
- At list price, monthly cash flow is $-226 ($-3k/yr) — negative.
- To cash-flow at today's rent, offer at most $120k (25.0% below list).
- To meet the 1% rule (rent ≥ 1% of price), the offer needs to be $110k (31.2% below list).
- Recommended offer: $110k (31.2% below list) — sets the bar for 1% rule.
- Cap rate 4.6% vs local median 3.4% in Edinburgh — top-decile yield for the area; either an underpriced asset or a hidden risk that comps aren't pricing in. Stress-test before assuming the spread holds.
Location & tenants
- Location reads 61/100 on livability (#505 in IN) — a middle-class / working-renter tenant base. Strengths: cost of living A+, housing A+, crime B+; Watch: employment D, amenities F, commute F.
- Edinburgh Community School Corporation (suburban): math 27% / reading 39% proficiency, ranked #214 of 301 in IN (top 71%) — families likely to look elsewhere, expect single-tenant / working-renter base with shorter leases.
- Zoned schools: East Side Elementary School (math 32% / reading 32%, grade F, #652 of 994 statewide, top 68%, 432 students, 75% FRL); Edinburgh Comm Middle School (math 17% / reading 42%, grade F, #212 of 330 statewide, top 67%, 173 students, 71% FRL); Edinburgh Community High School (math 24% / reading 64%, grade F, #169 of 369 statewide, top 51%, 232 students, 62% FRL).
- Market conditions: 37 active listings in the ZIP; 1 comparable units currently listed for rent nearby; 1,133 units permitted in Johnson County in 2024 (0 in 5+ unit buildings).
Forward outlook
- Local home prices are declining (-3.0%/yr); year-one equity from $1k of loan paydown is wiped out by about $5k of value loss. Plan a longer hold.
- Johnson County population projected at +26% by 2050 — long-run rental-demand tailwind backs the buy-and-hold thesis.
Negotiation context
- Only 4 days on market — expect competitive offers; lowballing is unlikely to land.
- 5 sale attempts since 17y ago with the ask held roughly flat each time — persistent listings suggest the price (not the market) is what's stuck; bring a comps-based counter.
- Current owner paid $67k; list at $160k implies a 139% gain — meaningful room to come down on a strong offer.
Risks & watch-outs
- Watch-outs: built in 1930 — expect roof / HVAC / electrical / plumbing capex.
Questions for the listing agent
- What do current leases actually rent for vs. the listed asking? Can we see a recent rent roll and the last 12 months of T-12 income?
- Built in 1930 — when were the roof, HVAC, electrical panel, plumbing, and water heater last replaced?
- Is there a deadline driving the sale (1031 exchange, divorce, estate, relocation)? That informs how much negotiation room exists.
- Schools are D-rated, which usually means shorter tenancies and higher turnover. Who's the typical renter profile here, and what's been the actual vacancy rate?
- The area grade is low — what's the realistic commute time and amenity access for the typical tenant pool here? Any planned neighborhood developments (good or bad) we should know about?
- What's the average days-on-market for RENTAL listings here right now (not sales)? A rising rental-DOM trend means longer vacancies and softer asking-rent achievability than the comps imply.
- What's the recent tenant-quality profile in this submarket — average credit score on applications, eviction rate, late-payment / NSF rate, and stable-employment percentage? A property-management company in the area should have these aggregated.
- How much new for-sale + rental construction is in the pipeline within 1–3 miles? Heavy new supply typically softens prices + rents 12–24 months out; constrained supply supports both.
Investment metrics
- 1% rule
- 0.69% ✗
- Cap rate
- 4.60%
- Cash-on-cash
- -6.06%
- DSCR
- 0.73
- GRM
- 12.1
CMA / ARV
- ARV (on-the-fly)
- $159,831
- Comps found
- 7
Show comp detail 7 sales within ~0.75 mi
| Address | Dist | Beds/Ba | Sqft | Sold | Price | $/sf | Match |
|---|---|---|---|---|---|---|---|
| 203 N Clay St | 0.24mi | 2/1.0 | 912 (+1%) | 7mo | $108,000 | $118 | 82 |
| 408 Franklin St | 0.07mi | 3/1.0 (+1) | 864 (-4%) | 8mo | $205,000 | $237 | 78 |
| 213 Franklin St | 0.20mi | 3/1.0 (+1) | 937 (+4%) | 7mo | $176,000 | $188 | 73 |
| 114 Lind Dr | 0.39mi | 3/1.0 (+1) | 925 (+2%) | 14mo | $125,000 | $135 | 61 |
| 632 N Park Dr | 0.48mi | 2/1.0 | 930 (+3%) | 23mo | $155,000 | $167 | 53 |
| 307 Franklin St | 0.15mi | 2/1.0 | 775 (-14%) | 22mo | $137,000 | $177 | 51 |
| 601 Middle Park Dr | 0.59mi | 3/1.0 (+1) | 985 (+9%) | 21mo | $189,500 | $192 | 34 |
Match score weights: distance 35% · size 25% · config 20% · recency 20%. Top-matched comps best support the ARV.
Projected returns pro-forma
-3.0% appreciation · 3.0% rent growth · sell at horizon
- IRR
- -26.7%
- Equity multiple
- 0.10×
- Total profit
- $-40,305
- Equity at exit
- $23,842
- IRR
- -24.1%
- Equity multiple
- -0.20×
- Total profit
- $-53,603
- Equity at exit
- $13,825
Cash invested: $44,772 (down + closing). Projections, not guarantees.
Landlord ↔ Tenant lean methodology
- Overall (STATE)
- 90 Strongly Landlord-Friendly
- State Indiana
- 90 Strongly Landlord-Friendly · R+11
- County
- — inherits STATE
- City
- — inherits STATE
ZIP-level market 46124
- Active inventory
- 37
- Price-to-rent
- 12.1×
Monthly cashflow live
- Estimated rent
- $1,100 medium interval (Pro) →
- Mortgage (P&I)
- −$839
- Tax from tax record
- −$190 /mo · $2,280/yr
- Insurance
- −$67
- HOA
- −$0
- Vacancy / Maint / Mgmt
- −$231
- Net cashflow
- $-226
Break-even live
Sensitivity live
| Price | -10% $-136 | -5% $-181 | +0% $-226 | +5% $-271 | +10% $-317 |
|---|---|---|---|---|---|
| Rent | -10% $-313 | -5% $-270 | +0% $-226 | +5% $-183 | +10% $-139 |
| Rate | -1.0pp $-146 | -0.5pp $-186 | base $-226 | +0.5pp $-268 | +1.0pp $-310 |
UW: 25.0% down · 7.5% · 30yr · 1.5% tax · 5.0% vac · 8.0% maint · 8.0% mgmt
Financing live
Cash to close
- Down payment
- $39,975
- Closing costs
- $4,797
- Reserves months
- —
- Total cash needed
- —
Loan-product check · same deal, 3 products live
Conventional
25% down · 7.5% · 30yr
- Down + closing
- —
- Monthly P&I
- —
- Monthly cashflow
- —
- DSCR
- —
- Eligible?
- —
Personal DTI + credit; lowest rate.
DSCR
20% down · 8.5% · 30yr
- Down + closing
- —
- Monthly P&I
- —
- Monthly cashflow
- —
- DSCR
- —
- Eligible?
- —
No personal income docs; deal must DSCR.
Hard money
10% down · 12.0% · 12mo
- Down + closing
- —
- Monthly P&I
- —
- Monthly cashflow
- —
- DSCR
- —
- Eligible?
- —
Short-term bridge; refi at stabilization.
Rent comps 1 comps
| Address | Beds | Baths | Sqft | Rent | $/sqft | DOM | Units | Dist |
|---|---|---|---|---|---|---|---|---|
| 501 Hammond Dr Edinburgh, IN | 2.0 | 1.0 | 875 | $1,100 | $1.26 | 0d | 1 | 0.49mi |
Listing history 4 events
-
2026-06-16status $159,900 Pending 4 DOM
-
2026-06-15pricedays on market $159,900 Active 4 DOM
-
2026-06-13remarks 323-char remark
-
2026-06-13$159,000 Active 2 DOM
ⓘ Source: listings_history table (triggers on properties + properties_extension) + one-shot
backfill from property_details.listing_events for pre-trigger history.
Tax reassessment forecast IN · Partial reset (capped growth)
- Current annual tax
- $2,280 · $190/mo
- Projected year-2 tax
- $2,280 · $190/mo
- Expected delta
- $0/yr ($0/mo · 0.0%)
ⓘ Screening estimate from a state-policy table — verify with the county assessor before closing.
Climate risk First Street
- Flood 3/10 Moderate FEMA zone X (unshaded) · 20% chance over 30 yrs
- Wildfire 1/10 Low
- Heat 4/10 Moderate 7 d/yr ≥103°F today · 19 d/yr by 30 yrs out
- Wind 2/10 Low 100% chance of damaging wind over 30 yrs
- Air quality 2/10 Low 1 unhealthy d/yr today · 1 by 30 yrs out
Nearby sold comps map
Loading sold comps map…
Walkable amenities ~0.75 mi
Loading nearby amenities…
Taxation est. · year 1
- Rental income
- $13,200
- − Mortgage interest
- −$8,957
- − Property taxes
- −$2,280
- − Insurance
- −$800
- − Repairs & maintenance
- −$1,056
- − Management
- −$1,056
- − Depreciation
- −$4,652
- Taxable loss
- −$5,600
- Est. tax savings @ 24.0%
- +$1,344
- After-tax cash flow
- $-1,370/yr
For passive investors: Depreciation is non-cash, so a rental often shows a tax loss while cash-flowing — sheltering income. Rental losses are passive: they offset passive income freely, and up to $25,000/yr can offset ordinary (W-2) income if you actively participate and your MAGI is under $100k (phasing out to $0 by $150k); unused losses carry forward. On sale, claimed depreciation is recaptured at up to 25%, and gains may owe capital-gains tax (a 1031 exchange can defer both). Figures are a year-1 estimate at your 24.0% rate — not tax advice; consult a CPA.
Schools (NCES district)
- District
- Edinburgh Community School Corporation
- NCES district ID
- 1803240
- Math proficiency
- 27% ▼ -13.00%
- Reading proficiency
- 39% ▼ -8.00%
- Median HH income
- $40,262
- Composite
- 27.72/100
- National rank
- #6906
- State rank
- #214 of 301 in IN
Livability — Edinburgh
- Score
- 61/100
- State rank
- #505
- US rank
- #17914
Category grades
Schools grade is shown separately in the Schools card above.
Census & demographics
- Census place
- Edinburgh, IN
- Population (ZIP)
- 7,638
Population outlook (Johnson County) Hauer SSP2
- Today (2025)
- 170,080 people
- By 2030
- 179,983 · +5.8%
- By 2040
- 198,580 · +16.8%
- By 2050
- 214,661 · +26.2%
- By 2075
- 247,990 · +45.8%
- By 2100
- 257,821 · +51.6%
Race, ethnicity, and origin ACS 2023
- Neighborhood character
- Predominantly White (91%)
- Race & ethnicity
- White 91% Hispanic / Latino 6% Two or more races 2%
- Hispanic origin (detail)
- Mexican 4% Puerto Rican 2%
- Common ancestry
- Serbian 0%
- Foreign-born
- 1% · Vietnam, Canada
- Languages at home
- 93% English-only · Spanish 6%
Political lean MEDSL · Johnson
- 2024 margin
- Solid R (+34.3) · D 32.0% · R 66.3% · Other 1.7%
- 2008→2024 swing
- -8.9pp toward R · 2008: -25.5pp · 2024: -34.3pp
- All cycles
- 2024: R+34.3 2020: R+34.1 2016: R+42.5 2012: R+38.5 2008: R+25.5
Not yet ingested
- Civics
- —
Market trends
- HPI YoY
- ▼ -112.43%
- Current HPI
- 204.1713
- Rent YoY
- —
- Metro
- —
- State GDP YoY
- ▲ 2.90%
- F500 in state
- 18
Industry mix (Fortune 500 HQ in IN)
| Industry | F500 HQs | Revenue |
|---|---|---|
| Industrial Machinery | 2 | $37B |
|
||
| Healthcare | 1 | $177B |
|
||
| Pharmaceuticals | 1 | $45B |
|
||
| Metals / Steel | 1 | $18B |
|
||
| Agriculture | 1 | $17B |
|
||
| Packaging | 1 | $12B |
|
||
Price history
+202.9% since first listed12 events — show timeline
- 2026-06-08 Listed $159,000 MIBOR as Distributed by MLS Grid
- 2022-02-02 Sold (MLS) $66,900 MIBOR as Distributed by MLS Grid
- 2022-01-05 Pending — MIBOR as Distributed by MLS Grid
- 2022-01-01 Price Changed $69,900 MIBOR as Distributed by MLS Grid
- 2021-12-10 Relisted — MIBOR as Distributed by MLS Grid
- 2021-12-05 Pending — MIBOR as Distributed by MLS Grid
- 2021-12-04 Listed $84,900 MIBOR as Distributed by MLS Grid
- 2009-10-23 Listing Removed — MIBOR as Distributed by MLS Grid
- 2009-10-20 Sold (Public Records) $50,500 Public Records
- 2009-10-20 Sold (MLS) $50,500 MIBOR as Distributed by MLS Grid
- 2009-07-02 Listed $52,500 MIBOR as Distributed by MLS Grid
- 2009-07-02 Listed $52,500 MIBOR as Distributed by MLS Grid
Property tax history
+19.2%/yrLatest (2024): $2,280 · +6.6% YoY. Source: county tax records.
Cash-flow waterfall
monthlySold comps — $/sqft
last 12 mo · ≤1 miLoading sold comps…