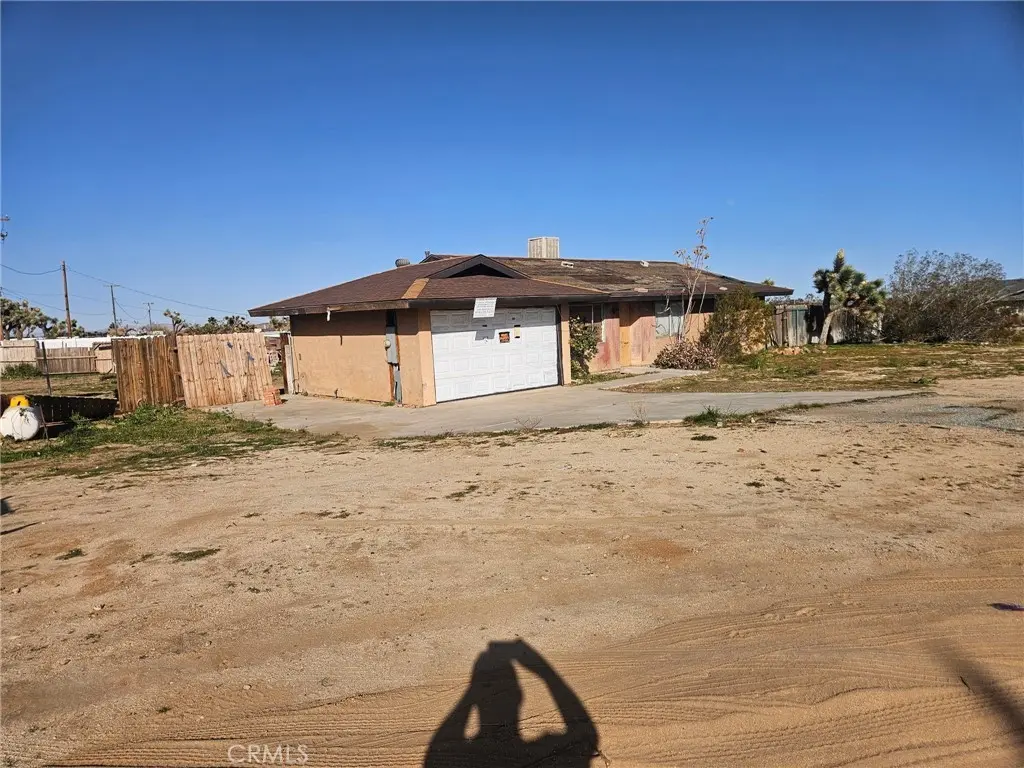
58068 Pimlico St · Yucca Valley, CA
Flood risk 1/10 · Minimal
- FEMA flood zone
- X (unshaded)
- Chance of flooding over 30 yrs
- 0.0%
- Est. flood insurance / yr
- $507 – $1,088
Fire risk 4/10 · Minor
- Est. fire insurance / yr
- $659 – $1,223
Heat risk 6/10 · Moderate
- Hot days now (above 98°F)
- 8 days/yr
- Hot days in 30 yrs
- 23 days/yr
Wind risk 1/10 · Minimal
- Chance of severe wind over 30 yrs
- —
Air-quality risk 6/10 · Moderate
- Unhealthy air days now
- 9 days/yr
- Unhealthy air days in 30 yrs
- 12 days/yr
Risk factors via First Street. Map © Google.
Why this score? — see what drove the B- grade
The composite is a weighted blend of 9 inputs, each scored 0–100. Each bar is that input's sub-score; the figure is the points it added to the 100-point composite (weight × sub-score).
- Cash flow +30.0/30.0
- DSCR +10.0/10.0
- 1% rule +8.8/10.0
- ARV discount +7.5/15.0
- Rent growth +3.5/5.0
- Livability +3.0/5.0
- Condition / age +2.5/5.0
- Schools +2.2/10.0
- Appreciation +0.0/10.0
$157,500
🖨 Deal sheet 📄 Offer letter ✓ Due diligence
Listing remarks MLS
Experienced Investors. .. .. . This 3 bedroom 1.5 bath home features 1,100 square feet of living space and is nestled on an 18,000 square foot, corner, lot. The home requires substantial rehabilitation and the buyer must be qualified for such a project. The property is in a court ordered receivership and the buyer will be required to provide proof of completing similar projects. The property is sold in it's As-Is, Where-Is condition.
Key facts
- 0.41 acre lot
- 2 garage spots
- Built 1984
Neighborhood map
What this means for you Summary
Snapshot
- This is a 3-bed/2.0-bath single-family listed at $158k.
Deal economics
- At list price, monthly cash flow is $703 ($8k/yr) — positive.
- The deal already cash-flows at list — no discount required.
- Meets the 1% rule at list price ($2k rent vs $158k).
- Recommended offer: $143k (9.0% below list) — sets the bar for market timing.
- Cap rate 11.6% vs local median 3.6% in Yucca Valley — top-decile yield for the area; either an underpriced asset or a hidden risk that comps aren't pricing in. Stress-test before assuming the spread holds.
Location & tenants
- Location reads 60/100 on livability (#566 in CA) — a middle-class / working-renter tenant base. Strengths: commute A+, housing A+; Watch: cost of living D+, schools F, crime D-.
- Morongo Unified (town): math 15% / reading 38% proficiency, ranked #395 of 517 in CA (top 76%) — low school quality limits family demand, transient renter base, plan for 1-2y turnover.
- Market conditions: Rents rising fast (+4.1%/yr); 563 active listings in the ZIP; 3 comparable units currently listed for rent nearby; rentals lingering (median 44d on market — plan ~5-8 weeks vacancy on turnover, expect pricing pressure); 67% of comp listings sitting > 30 days — soft ceiling on asking rent; 5,458 units permitted in San Bernardino County in 2024 (1,500 in 5+ unit buildings).
- This rent runs 45% of the median local income ($58k/yr) — at the standard rent-burdened threshold; future hikes will face affordability resistance.
Forward outlook
- Local home prices are declining (-3.0%/yr); year-one equity from $1k of loan paydown is wiped out by about $5k of value loss. Plan a longer hold.
- San Bernardino County population projected at +15% by 2050 — modest demand growth; plan on rents tracking national, not racing it.
- At projected returns (-3.0% appreciation + 4.1% rent growth), your $44k cash investment doubles in ~6 years — after that, you're playing with house money.
Negotiation context
- It's been on market 106 days — a 9% lower offer ($143k) is reasonable based on typical stale-listing flexibility.
- Current owner paid $42k; list at $158k implies a 271% gain — meaningful room to come down on a strong offer.
Risks & watch-outs
- Climate carrying-cost: extreme-heat days projected 8→23/yr by 2055 (HVAC capex compounding) — expect insurance premiums to compound above CPI over the hold.
Questions for the listing agent
- It's been on market 106 days. Have you received any prior offers? Is the seller open to a 9% concession, seller financing, or rate buy-down credit?
- Why hasn't it sold? Are there any deal-killer items the seller is aware of (foundation, flood, title, zoning, code violations)?
- Is there a deadline driving the sale (1031 exchange, divorce, estate, relocation)? That informs how much negotiation room exists.
- Schools are F-rated, which usually means shorter tenancies and higher turnover. Who's the typical renter profile here, and what's been the actual vacancy rate?
- Crime grade is D in this area — have there been break-ins, vandalism, or insurance claims at this property in the last 3 years? What carrier currently insures it and at what premium?
- What's the average days-on-market for RENTAL listings here right now (not sales)? A rising rental-DOM trend means longer vacancies and softer asking-rent achievability than the comps imply.
- What's the recent tenant-quality profile in this submarket — average credit score on applications, eviction rate, late-payment / NSF rate, and stable-employment percentage? A property-management company in the area should have these aggregated.
- How much new for-sale + rental construction is in the pipeline within 1–3 miles? Heavy new supply typically softens prices + rents 12–24 months out; constrained supply supports both.
Investment metrics
- 1% rule
- 1.38% ✓
- Cap rate
- 11.65%
- Cash-on-cash
- 19.13%
- DSCR
- 1.85
- GRM
- 6.0
CMA / ARV
- ARV (median comp)
- $323,622
- List price
- $157,500
- Delta
- -51.33%
- Verdict
- UNDERPRICED
- Comps
- 20 within 1.0 mi
Show comp detail 12 sales within ~0.75 mi
| Address | Dist | Beds/Ba | Sqft | Sold | Price | $/sf | Match |
|---|---|---|---|---|---|---|---|
| 58193 Campanula | 0.15mi | 3/2.0 | 1,000 (-9%) | 1mo | $340,000 | $340 | 77 |
| 3655 Surrey Ave | 0.09mi | 3/2.0 | 1,152 (+5%) | 17mo | $385,000 | $334 | 74 |
| 57783 Saratoga Ave | 0.38mi | 3/1.5 | 1,144 (+4%) | 1mo | $425,000 | $372 | 73 |
| 58375 Del Mar St | 0.40mi | 3/2.0 | 1,040 (-6%) | 1mo | $298,000 | $287 | 71 |
| 3662 Balsa Ave | 0.10mi | 2/1.0 (-1) | 1,008 (-8%) | 9mo | $350,000 | $347 | 65 |
| 57990 Saratoga Ave | 0.12mi | 2/1.0 (-1) | 1,008 (-8%) | 12mo | $269,000 | $267 | 62 |
| 57722 Pimlico St | 0.44mi | 3/2.0 | 1,108 (+1%) | 21mo | $275,000 | $248 | 61 |
| 57862 Canterbury St | 0.31mi | 3/2.0 | 1,176 (+7%) | 18mo | $345,500 | $294 | 59 |
| 57854 Belmont St | 0.33mi | 3/2.0 | 1,196 (+9%) | 14mo | $331,000 | $277 | 58 |
| 57942 Belmont St | 0.25mi | 2/1.0 (-1) | 1,004 (-9%) | 15mo | $286,000 | $285 | 52 |
| 57944 Saratoga Ave | 0.17mi | 4/3.0 (+1) | 1,232 (+12%) | 20mo | $290,000 | $235 | 46 |
| 58257 Caliente St | 0.24mi | 2/1.0 (-1) | 1,008 (-8%) | 24mo | $305,000 | $303 | 46 |
Match score weights: distance 35% · size 25% · config 20% · recency 20%. Top-matched comps best support the ARV.
Projected returns pro-forma
-3.0% appreciation · 4.12% rent growth · sell at horizon
- IRR
- 12.2%
- Equity multiple
- 1.49×
- Total profit
- $21,714
- Equity at exit
- $23,484
- IRR
- 22.0%
- Equity multiple
- 2.97×
- Total profit
- $86,905
- Equity at exit
- $13,618
Cash invested: $44,100 (down + closing). Projections, not guarantees.
Landlord ↔ Tenant lean methodology
- Overall (STATE)
- 18 Strongly Tenant-Friendly
- State California
- 18 Strongly Tenant-Friendly · D+13
- County
- — inherits STATE
- City
- — inherits STATE
ZIP-level market 92284
- Home prices YoY
- -33.1%
- Rents YoY
- 4.1%
- Active inventory
- 563
- Price-to-rent
- 6.0×
Monthly cashflow live
- Estimated rent
- $2,174 medium interval (Pro) →
- Mortgage (P&I)
- −$826
- Tax from tax record
- −$123 /mo · $1,475/yr
- Insurance
- −$66
- HOA
- −$0
- Vacancy / Maint / Mgmt
- −$457
- Net cashflow
- $703
Break-even live
UW: 25.0% down · 7.5% · 30yr · 1.5% tax · 5.0% vac · 8.0% maint · 8.0% mgmt
Financing live
Cash to close
- Down payment
- $39,375
- Closing costs
- $4,725
- Reserves months
- —
- Total cash needed
- —
Loan-product check · same deal, 3 products live
Conventional
25% down · 7.5% · 30yr
- Down + closing
- —
- Monthly P&I
- —
- Monthly cashflow
- —
- DSCR
- —
- Eligible?
- —
Personal DTI + credit; lowest rate.
DSCR
20% down · 8.5% · 30yr
- Down + closing
- —
- Monthly P&I
- —
- Monthly cashflow
- —
- DSCR
- —
- Eligible?
- —
No personal income docs; deal must DSCR.
Hard money
10% down · 12.0% · 12mo
- Down + closing
- —
- Monthly P&I
- —
- Monthly cashflow
- —
- DSCR
- —
- Eligible?
- —
Short-term bridge; refi at stabilization.
Rent comps 3 comps
| Address | Beds | Baths | Sqft | Rent | $/sqft | DOM | Units | Dist |
|---|---|---|---|---|---|---|---|---|
| 3906 Balsa Ave Yucca Valley, CA | 2.0 | 2.0 | 1227 | $1,800 | $1.47 | 43d | 1 | 0.20mi |
| 3878 Hilton Ave Yucca Valley, CA | 4.0 | 2.0 | 1500 | $2,749 | $1.83 | 43d | 1 | 0.30mi |
| 58788 Sun Mesa Dr Yucca Valley, CA | 2.0 | 1.5 | 936 | $1,675 | $1.79 | 15d | 1 | 1.47mi |
Listing history 17 events
-
2026-06-18days on market $157,500 Active 106 DOM
-
2026-06-17days on market $157,500 Active 105 DOM
-
2026-06-16days on market $157,500 Active 104 DOM
-
2026-06-15days on market $157,500 Active 103 DOM
-
2026-06-13days on market $157,500 Active 101 DOM
-
2026-06-13pricedays on market $157,500 Active 100 DOM
-
2026-06-09days on market $162,500 Active 97 DOM
-
2026-06-08days on market $162,500 Active 96 DOM
-
2026-06-07days on market $162,500 Active 95 DOM
-
2026-06-04days on market $162,500 Active 92 DOM
-
2026-06-03days on market $162,500 Active 91 DOM
-
2026-06-02days on market $162,500 Active 90 DOM
-
2026-06-01days on market $162,500 Active 89 DOM
-
2026-05-31days on market $162,500 Active 88 DOM
-
2026-03-04$162,500 Active 438-char remark
Show marketing remark (438 chars)
Experienced Investors. .. .. . This 3 bedroom 1.5 bath home features 1,100 square feet of living space and is nestled on an 18,000 square foot, corner, lot. The home requires substantial rehabilitation and the buyer must be qualified for such a project. The property is in a court ordered receivership and the buyer will be required to provide proof of completing similar projects. The property is sold in it's As-Is, Where-Is condition.
-
1999-09-27soldstatus $42,500
-
1993-09-22soldstatus $8,500
ⓘ Source: listings_history table (triggers on properties + properties_extension) + one-shot
backfill from property_details.listing_events for pre-trigger history.
Tax reassessment forecast CA · Resets to sale price
- Current annual tax
- $1,475 · $123/mo
- Projected year-2 tax
- $1,475 · $123/mo
- Expected delta
- $0/yr ($0/mo · 0.0%)
ⓘ Screening estimate from a state-policy table — verify with the county assessor before closing.
Climate risk First Street
- Flood 1/10 Low FEMA zone X (unshaded) · 0% chance over 30 yrs
- Wildfire 4/10 Moderate
- Heat 6/10 Major 8 d/yr ≥98°F today · 23 d/yr by 30 yrs out
- Wind 1/10 Low
- Air quality 6/10 Major 9 unhealthy d/yr today · 12 by 30 yrs out
Nearby sold comps map
Loading sold comps map…
Walkable amenities ~0.75 mi
Loading nearby amenities…
Taxation est. · year 1
- Rental income
- $26,087
- − Mortgage interest
- −$8,822
- − Property taxes
- −$1,475
- − Insurance
- −$788
- − Repairs & maintenance
- −$2,087
- − Management
- −$2,087
- − Depreciation
- −$4,582
- Taxable income
- $6,247
- Est. tax owed @ 24.0%
- −$1,499
- After-tax cash flow
- $6,936/yr
For passive investors: Depreciation is non-cash, so a rental often shows a tax loss while cash-flowing — sheltering income. Rental losses are passive: they offset passive income freely, and up to $25,000/yr can offset ordinary (W-2) income if you actively participate and your MAGI is under $100k (phasing out to $0 by $150k); unused losses carry forward. On sale, claimed depreciation is recaptured at up to 25%, and gains may owe capital-gains tax (a 1031 exchange can defer both). Figures are a year-1 estimate at your 24.0% rate — not tax advice; consult a CPA.
Schools (NCES district)
- District
- Morongo Unified
- NCES district ID
- 0625860
- Math proficiency
- 15% ▼ -12.00%
- Reading proficiency
- 38% ▼ -3.00%
- Median HH income
- $39,399
- Composite
- 22.19/100
- National rank
- #8156
- State rank
- #395 of 517 in CA
Livability — Yucca Valley
- Score
- 60/100
- State rank
- #566
- US rank
- #18584
Category grades
Schools grade is shown separately in the Schools card above.
Census & demographics
- County
- San Bernardino County · 2,030,291 people
- City population
- 25,415
- Metro
- Riverside-San Bernardino-Ontario, CA
- Population (ZIP)
- 25,415
- Household income
- $58,373
- Rent vs Own
- Severe rent burden
- 1132.0
Population outlook (San Bernardino County) Hauer SSP2
- Today (2025)
- 2,300,329 people
- By 2030
- 2,378,907 · +3.4%
- By 2040
- 2,523,137 · +9.7%
- By 2050
- 2,642,388 · +14.9%
- By 2075
- 2,880,769 · +25.2%
- By 2100
- 2,909,436 · +26.5%
Race, ethnicity, and origin ACS 2023
- Neighborhood character
- Diverse neighborhood (Simpson 0.55)
- Race & ethnicity
- White 62% Hispanic / Latino 25% Two or more races 18% Black 2% Native American 2% Asian 2% Pacific Islander 1%
- Hispanic origin (detail)
- Mexican 20%
- Common ancestry
- Italian 4% Romanian 2% Slovak 2%
- Foreign-born
- 9% · Canada
- Languages at home
- 82% English-only · Spanish 14% Other Indo-European 1% Other Asian/Pacific 1%
Political lean MEDSL · San Bernardino
- 2024 margin
- Toss-up / Even · D 47.5% · R 49.7% · Other 2.8%
- 2008→2024 swing
- -8.5pp toward R · 2008: 6.3pp · 2024: -2.1pp
- All cycles
- 2024: R+2.1 2020: D+10.7 2016: D+9.8 2012: D+5.4 2008: D+6.3
Not yet ingested
- Civics
- —
Market trends
- HPI YoY
- ▼ -241.13%
- Current HPI
- 486.7185
- Rent YoY
- ▲ 4.12%
- Metro
- Riverside-San Bernardino-Ontario, CA
- State GDP YoY
- ▲ 3.21%
- F500 in state
- 116
Industry mix (Fortune 500 HQ in CA)
| Industry | F500 HQs | Revenue |
|---|---|---|
| Technology | 27 | $1,492B |
|
||
| Financial Services | 3 | $174B |
|
||
| Retail | 3 | $44B |
|
||
| Insurance | 3 | $26B |
|
||
| Media / Entertainment | 2 | $115B |
|
||
| Pharmaceuticals / Biotech | 2 | $62B |
|
||
Price history
+1811.8% since first listed3 events — show timeline
- 2026-03-04 Listed $162,500 CRMLS
- 1999-09-27 Sold (Public Records) $42,500 Public Records
- 1993-09-22 Sold (Public Records) $8,500 Public Records
Property tax history
+4.6%/yrLatest (2025): $1,475 · +2.1% YoY. Source: county tax records.
Cash-flow waterfall
monthlySold comps — $/sqft
last 12 mo · ≤1 miLoading sold comps…