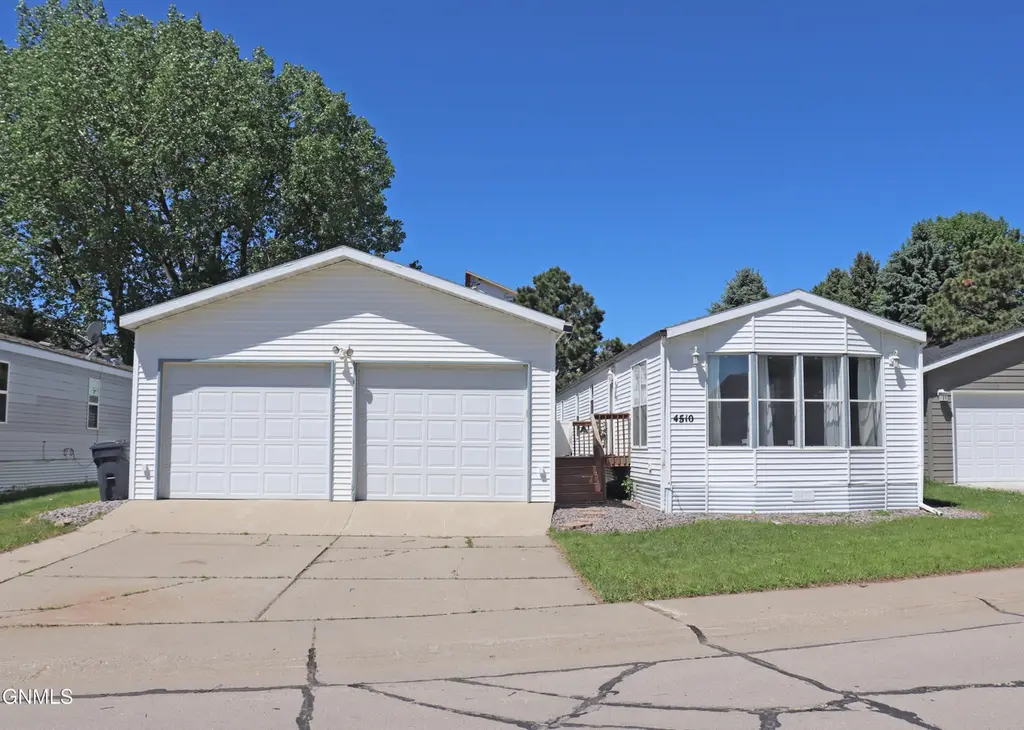
4510 Lafayette Dr · Bismarck, ND
Flood risk 1/10 · Minimal
- FEMA flood zone
- X (unshaded)
- Chance of flooding over 30 yrs
- 0.0%
- Est. flood insurance / yr
- $507 – $1,088
Fire risk 4/10 · Minor
- Est. fire insurance / yr
- $1,289 – $2,393
Heat risk 2/10 · Minimal
- Hot days now (above 97°F)
- 7 days/yr
- Hot days in 30 yrs
- 12 days/yr
Wind risk 2/10 · Minimal
- Chance of severe wind over 30 yrs
- —
Air-quality risk 4/10 · Minor
- Unhealthy air days now
- 4 days/yr
- Unhealthy air days in 30 yrs
- 4 days/yr
Risk factors via First Street. Map © Google.
Why this score? — see what drove the B- grade
The composite is a weighted blend of 9 inputs, each scored 0–100. Each bar is that input's sub-score; the figure is the points it added to the 100-point composite (weight × sub-score).
- Cash flow +25.1/30.0
- 1% rule +10.0/10.0
- DSCR +8.2/10.0
- ARV discount +7.5/15.0
- Rent growth +5.0/5.0
- Livability +4.0/5.0
- Schools +3.7/10.0
- Condition / age +2.5/5.0
- Appreciation +0.0/10.0
$119,000
🖨 Deal sheet 📄 Offer letter ✓ Due diligence
Listing remarks MLS
Welcome to this charming three-bedroom, two-bath home with a bright and open concept living area. This gorgeous well cared for home is located in Century Park. As you walk through the door, you will notice the open floor plan. The sunken living room is spacious and inviting. The kitchen has plenty of storage and counter space (including an island) for all your cooking needs. The main bedroom has plenty of room, including a walk-in closet. The master bath is roomy with counter space and storage (don't forget to look at the beautiful skylight). This home also features a shed to store all your landscaping tools and outdoor gear. This home has a large private fenced-in yard, perfect for entertaining. You will appreciate all the detailed landscaping. The two-stall (heated/insulated) garage will seal the deal with plenty of room for your cars and workbench. Don't miss your chance at this is a perfect home. Call your favorite realtor TODAY!
Key facts
- Pantry
- Large center island
- Open dining area
Tags
Property features AI
Finance
- HOA & community: Homeowners association with playground; Monthly association fee of $534 covering water, sewer and trash
Exterior
- Parking: 2-car garage; Heated garage; Garage door opener; Garage faces front; Lighted garage
- Security: Smoke detector(s)
- Utilities: Public water; Public sewer
- Home design: Residential mobile home (single wide)
- Construction: Vinyl siding; Built as a single-story mobile home
- Exterior features: Rain gutters; Private yard; Fenced backyard; Vinyl fencing
Interior
- Kitchen: Dishwasher; Gas range; Microwave; Range hood; Refrigerator
- Bathrooms: One full bathroom; One three-quarter bathroom
- Heating & cooling: Central air; Ceiling fan(s); Forced air heating; Natural gas heating
- Interior features: Ceiling fans; Pantry; Walk-in closet(s); Skylight(s); One fireplace
- Laundry & utility: Washer; Dryer
Neighborhood map
What this means for you Summary
Snapshot
- This is a 3-bed/2.0-bath manufactured listed at $119k.
Deal economics
- At list price, monthly cash flow is $262 ($3k/yr) — positive.
- The deal already cash-flows at list — no discount required.
- Meets the 1% rule at list price ($2k rent vs $119k).
- Recommended offer: $117k (1.5% below list) — sets the bar for market timing.
- Cap rate 8.9% vs local median 3.1% in Bismarck — top-decile yield for the area; either an underpriced asset or a hidden risk that comps aren't pricing in. Stress-test before assuming the spread holds.
Location & tenants
- Location reads 79/100 on livability (#5 in ND, #2,213 nationally) — a middle-class / working-renter tenant base. Strengths: housing A+, health & safety A+, cost of living A; Watch: crime C-, amenities D+, commute F.
- Bismarck 1 (urban): math 41% / reading 42% proficiency, ranked #25 of 53 in ND (top 47%) — families likely to look elsewhere, expect single-tenant / working-renter base with shorter leases; only 19% free/reduced lunch — higher-income household profile.
- Market conditions: Rents rising fast (+11.8%/yr); 481 active listings in the ZIP; 2 comparable units currently listed for rent nearby; solid renter incomes; 259 units permitted in Burleigh County in 2024 (0 in 5+ unit buildings).
Forward outlook
- Local home prices are declining (-3.0%/yr); year-one equity from $823 of loan paydown is wiped out by about $4k of value loss. Plan a longer hold.
- Burleigh County population projected at +61% by 2050 — long-run rental-demand tailwind backs the buy-and-hold thesis.
- At projected returns (-3.0% appreciation + 8.0% rent growth), your $33k cash investment doubles in ~7 years — after that, you're playing with house money.
Negotiation context
- It's been on market 17 days — a 2% lower offer ($117k) is reasonable based on typical stale-listing flexibility.
- 5 sale attempts since 28y ago with the ask held roughly flat each time — persistent listings suggest the price (not the market) is what's stuck; bring a comps-based counter.
Risks & watch-outs
- Watch-outs: HOA is 28% of rent.
Questions for the listing agent
- What does the HOA fee cover, when was the last increase, and are there any pending special assessments or reserve-fund shortfalls?
- Is there a deadline driving the sale (1031 exchange, divorce, estate, relocation)? That informs how much negotiation room exists.
- Schools are B-rated — typically a magnet for longer-tenancy family renters. What's the average tenant stay here, and is there a school-zone premium baked into asking?
- What's the average days-on-market for RENTAL listings here right now (not sales)? A rising rental-DOM trend means longer vacancies and softer asking-rent achievability than the comps imply.
- What's the recent tenant-quality profile in this submarket — average credit score on applications, eviction rate, late-payment / NSF rate, and stable-employment percentage? A property-management company in the area should have these aggregated.
- How much new for-sale + rental construction is in the pipeline within 1–3 miles? Heavy new supply typically softens prices + rents 12–24 months out; constrained supply supports both.
Investment metrics
- 1% rule
- 1.60% ✓
- Cap rate
- 8.93%
- Cash-on-cash
- 9.43%
- DSCR
- 1.42
- GRM
- 5.2
CMA / ARV
- ARV (on-the-fly)
- $64,448
- Comps found
- 12
Show comp detail 12 sales within ~0.75 mi
| Address | Dist | Beds/Ba | Sqft | Sold | Price | $/sf | Match |
|---|---|---|---|---|---|---|---|
| 4755 British Dr | 0.17mi | 3/2.0 | 1,216 (0%) | 1mo | $54,000 | $44 | 91 |
| 4773 British Dr | 0.18mi | 3/2.0 | 1,216 (0%) | 8mo | $115,000 | $95 | 86 |
| 4206 Patriot Dr | 0.34mi | 3/2.0 | 1,216 (0%) | 2mo | $79,900 | $66 | 83 |
| 4731 British Dr | 0.17mi | 3/2.0 | 1,216 (0%) | 11mo | $55,000 | $45 | 83 |
| 5051 Redcoat Dr | 0.22mi | 3/2.0 | 1,216 (0%) | 10mo | $56,000 | $46 | 81 |
| 4202 Patriot Dr | 0.21mi | 3/2.0 | 1,216 (0%) | 11mo | $65,000 | $53 | 81 |
| 4303 Patriot Dr | 0.19mi | 3/2.0 | 1,280 (+5%) | 4mo | $64,900 | $51 | 79 |
| 4539 Lafayette Dr | 0.05mi | 3/2.0 | 1,280 (+5%) | 12mo | $74,900 | $59 | 79 |
| 4117 W Arlington Dr | 0.28mi | 3/2.0 | 1,280 (+5%) | 1mo | $49,900 | $39 | 77 |
| 5018 Sumter Dr | 0.25mi | 3/2.0 | 1,280 (+5%) | 5mo | $105,000 | $82 | 76 |
| 5105 Redcoat Loop | 0.30mi | 3/2.0 | 1,350 (+11%) | 11mo | $129,800 | $96 | 58 |
| 2500 Centennial Rd Lot 240 | 0.72mi | 3/2.0 | 1,280 (+5%) | 2mo | $45,900 | $36 | 56 |
Match score weights: distance 35% · size 25% · config 20% · recency 20%. Top-matched comps best support the ARV.
Projected returns pro-forma
-3.0% appreciation · 8.0% rent growth · sell at horizon
- IRR
- 5.5%
- Equity multiple
- 1.23×
- Total profit
- $7,722
- Equity at exit
- $17,743
- IRR
- 20.3%
- Equity multiple
- 3.25×
- Total profit
- $75,066
- Equity at exit
- $10,289
Cash invested: $33,320 (down + closing). Projections, not guarantees.
Landlord ↔ Tenant lean methodology
- Overall (STATE)
- 82 Strongly Landlord-Friendly
- State North Dakota
- 82 Strongly Landlord-Friendly · R+20
- County
- — inherits STATE
- City
- — inherits STATE
ZIP-level market 58503
- Home prices YoY
- -25.6%
- Rents YoY
- 11.8%
- Active inventory
- 481
- Price-to-rent
- 5.2×
Monthly cashflow live
- Estimated rent
- $1,900 medium interval (Pro) →
- Mortgage (P&I)
- −$624
- Tax from tax record
- −$32 /mo · $382/yr
- Insurance
- −$50
- HOA
- −$534
- Vacancy / Maint / Mgmt
- −$399
- Net cashflow
- $262
Break-even live
UW: 25.0% down · 7.5% · 30yr · 1.5% tax · 5.0% vac · 8.0% maint · 8.0% mgmt
Financing live
Cash to close
- Down payment
- $29,750
- Closing costs
- $3,570
- Reserves months
- —
- Total cash needed
- —
Loan-product check · same deal, 3 products live
Conventional
25% down · 7.5% · 30yr
- Down + closing
- —
- Monthly P&I
- —
- Monthly cashflow
- —
- DSCR
- —
- Eligible?
- —
Personal DTI + credit; lowest rate.
DSCR
20% down · 8.5% · 30yr
- Down + closing
- —
- Monthly P&I
- —
- Monthly cashflow
- —
- DSCR
- —
- Eligible?
- —
No personal income docs; deal must DSCR.
Hard money
10% down · 12.0% · 12mo
- Down + closing
- —
- Monthly P&I
- —
- Monthly cashflow
- —
- DSCR
- —
- Eligible?
- —
Short-term bridge; refi at stabilization.
Rent comps 2 comps
| Address | Beds | Baths | Sqft | Rent | $/sqft | DOM | Units | Dist |
|---|---|---|---|---|---|---|---|---|
| 3504 French St Bismarck, ND | 2.0 | 1.5 | 966 | $1,795 | $1.86 | 21d | 1 | 0.84mi |
| 3103 E Calgary Ave Bismarck, ND | 1.0–3.0 | 1.0–2.0 | 1079 | $1,860 | $1.72 | 21d | 6 | 1.34mi |
HOA detail
- Monthly dues
- $534 · $6,408/yr
- Likely covers
- landscaping
Listing history 14 events
-
2026-06-18status $119,000 Pending 17 DOM
-
2026-06-18days on market $119,000 Active 17 DOM
-
2026-06-17days on market $119,000 Active 16 DOM
-
2026-06-16days on market $119,000 Active 15 DOM
-
2026-06-15days on market $119,000 Active 14 DOM
-
2026-06-14days on market $119,000 Active 12 DOM
-
2026-06-13days on market $119,000 Active 11 DOM
-
2026-06-10days on market $119,000 Active 9 DOM
-
2026-06-09days on market $119,000 Active 8 DOM
-
2026-06-08days on market $119,000 Active 7 DOM
-
2026-06-07days on market $119,000 Active 6 DOM
-
2026-06-05days on market $119,000 Active 3 DOM
-
2026-06-03days on market $119,000 Active 2 DOM
-
2026-06-02$119,000 Active 1 DOM
ⓘ Source: listings_history table (triggers on properties + properties_extension) + one-shot
backfill from property_details.listing_events for pre-trigger history.
Tax reassessment forecast ND · Resets to sale price
- Current annual tax
- $382 · $32/mo
- Projected year-2 tax
- $1,166 · $97/mo
- Expected delta
- +$784/yr (+$65/mo · 205.3%)
ⓘ Screening estimate from a state-policy table — verify with the county assessor before closing.
Climate risk First Street
- Flood 1/10 Low FEMA zone X (unshaded) · 0% chance over 30 yrs
- Wildfire 4/10 Moderate
- Heat 2/10 Low 7 d/yr ≥97°F today · 12 d/yr by 30 yrs out
- Wind 2/10 Low
- Air quality 4/10 Moderate 4 unhealthy d/yr today · 4 by 30 yrs out
Nearby sold comps map
Loading sold comps map…
Walkable amenities ~0.75 mi
Loading nearby amenities…
Taxation est. · year 1
- Rental income
- $22,805
- − Mortgage interest
- −$6,666
- − Property taxes
- −$382
- − Insurance
- −$595
- − Repairs & maintenance
- −$1,824
- − Management
- −$1,824
- − HOA
- −$6,408
- − Depreciation
- −$3,462
- Taxable income
- $1,643
- Est. tax owed @ 24.0%
- −$394
- After-tax cash flow
- $2,748/yr
For passive investors: Depreciation is non-cash, so a rental often shows a tax loss while cash-flowing — sheltering income. Rental losses are passive: they offset passive income freely, and up to $25,000/yr can offset ordinary (W-2) income if you actively participate and your MAGI is under $100k (phasing out to $0 by $150k); unused losses carry forward. On sale, claimed depreciation is recaptured at up to 25%, and gains may owe capital-gains tax (a 1031 exchange can defer both). Figures are a year-1 estimate at your 24.0% rate — not tax advice; consult a CPA.
Schools (NCES district)
- District
- Bismarck 1
- NCES district ID
- 3800014
- Math proficiency
- 41% ▼ -5.00%
- Reading proficiency
- 42% ▼ -6.00%
- Median HH income
- $60,649
- Composite
- 36.76/100
- National rank
- #4577
- State rank
- #25 of 53 in ND
Livability — Bismarck
- Score
- 79/100
- State rank
- #5
- US rank
- #2213
Category grades
Schools grade is shown separately in the Schools card above.
Census & demographics
- Census place
- Bismarck, ND
- County
- Burleigh County · 97,300 people
- City population
- 97,300
- Metro
- Bismarck, ND
- Population (ZIP)
- 37,683
- Household income
- $102,333
- Rent vs Own
- Severe rent burden
- 814.0
Population outlook (Burleigh County) Hauer SSP2
- Today (2025)
- 119,359 people
- By 2030
- 133,047 · +11.5%
- By 2040
- 161,545 · +35.3%
- By 2050
- 191,960 · +60.8%
- By 2075
- 274,569 · +130.0%
- By 2100
- 350,910 · +194.0%
Race, ethnicity, and origin ACS 2023
- Neighborhood character
- Predominantly White (89%)
- Race & ethnicity
- White 89% Two or more races 6% Hispanic / Latino 2% Asian 2% Black 1%
- Common ancestry
- Portuguese 17% Scotch-Irish 4% Scottish 2%
- Foreign-born
- 3% · Canada
- Languages at home
- 95% English-only · German/W. Germanic 2% Spanish 1% Tagalog/Filipino 1%
Political lean MEDSL · Burleigh
- 2024 margin
- Solid R (+43.2) · D 27.5% · R 70.7% · Other 1.8%
- 2008→2024 swing
- -19.7pp toward R · 2008: -23.6pp · 2024: -43.2pp
- All cycles
- 2024: R+43.2 2020: R+40.2 2016: R+46.1 2012: R+32.1 2008: R+23.6
Not yet ingested
- Civics
- —
Market trends
- HPI YoY
- ▼ -76.96%
- Current HPI
- 223.9683
- Rent YoY
- ▲ 11.79%
- Metro
- Bismarck, ND
- State GDP YoY
- ▲ 2.09%
- F500 in state
- 2
Industry mix (Fortune 500 HQ in ND)
| Industry | F500 HQs | Revenue |
|---|---|---|
| Utilities / Construction | 1 | $6B |
|
||
Price history
+240.0% since first listed9 events — show timeline
- 2026-06-01 Listed $119,000 GNMLS
- 2022-03-31 Sold (MLS) — GNMLS
- 2022-03-07 Listed $99,900 GNMLS
- 2018-04-06 Sold (MLS) — GNMLS
- 2017-10-03 Listed $66,900 GNMLS
- 2002-03-25 Sold (MLS) — GNMLS
- 2002-02-02 Listed $33,000 GNMLS
- 1998-10-30 Sold (MLS) — GNMLS
- 1998-09-14 Listed $35,000 GNMLS
Cash-flow waterfall
monthlySold comps — $/sqft
last 12 mo · ≤1 miLoading sold comps…