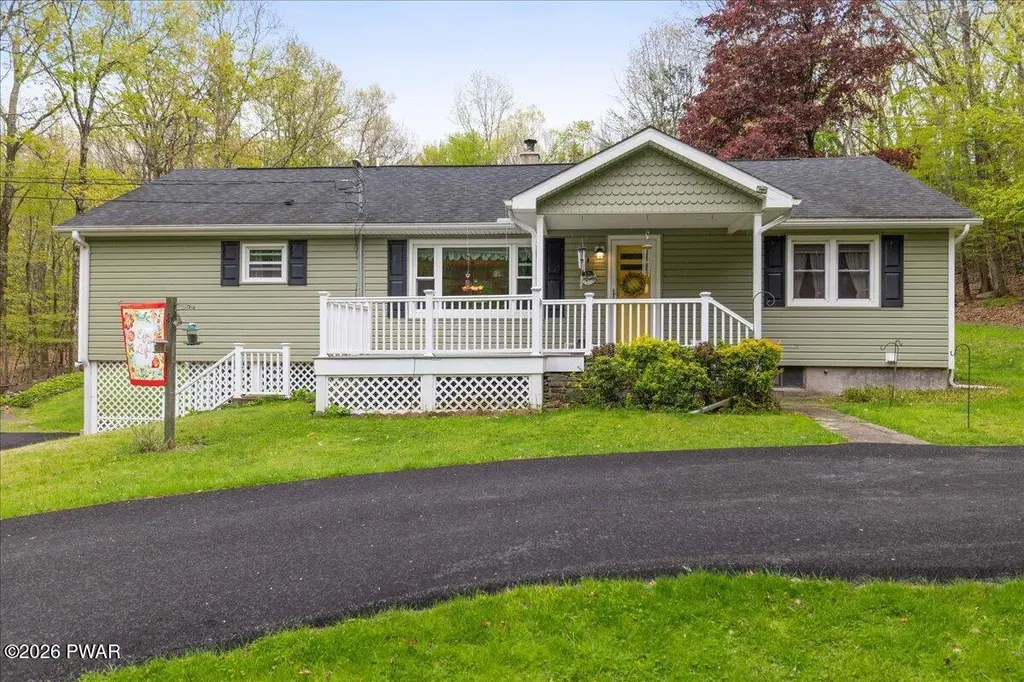
212 Lakeshore Dr · Wallenpaupack Lake Estates, PA
Flood risk 1/10 · Minimal
- FEMA flood zone
- X (unshaded)
- Chance of flooding over 30 yrs
- 0.0%
- Est. flood insurance / yr
- $473 – $860
Fire risk 3/10 · Minor
- Est. fire insurance / yr
- $511 – $949
Heat risk 2/10 · Minimal
- Hot days now (above 91°F)
- 7 days/yr
- Hot days in 30 yrs
- 15 days/yr
Wind risk 3/10 · Minor
- Chance of severe wind over 30 yrs
- 4.0%
Air-quality risk 2/10 · Minimal
- Unhealthy air days now
- 1 days/yr
- Unhealthy air days in 30 yrs
- 1 days/yr
Risk factors via First Street. Map © Google.
Why this score? — see what drove the B grade
The composite is a weighted blend of 9 inputs, each scored 0–100. Each bar is that input's sub-score; the figure is the points it added to the 100-point composite (weight × sub-score).
- Cash flow +30.0/30.0
- DSCR +10.0/10.0
- 1% rule +7.9/10.0
- Appreciation +7.0/10.0
- ARV discount +6.2/15.0
- Schools +4.2/10.0
- Livability +3.4/5.0
- Rent growth +2.5/5.0
- Condition / age +2.5/5.0
$389,000
🖨 Deal sheet 📄 Offer letter ✓ Due diligence
Listing remarks
Beautiful Ranch style home, no community or HOA, on 2.67 acres, 1/2 mile from Lake Wallenpaupack! This home has been remodeled and lovingly cared for over the years. It features 3 bedrooms, 2 bathrooms, open floor plan, huge living room, large 4 season room, great kitchen with granite, primary bedroom with primary bath and fireplace, hardwood floors, full unfinished basement, force hot air heating plus a wood stove in basement, full unfinished basement, 1 car garage plus garage door enclosed workshop/storage space, 2 sheds, paved circular driveway, front and back decking, front and back yard, back yard fish pond water feature. and whole house generator! A great property for your whole fam
Key facts
- 2.67 acres
- Remodeled
- Open floor plan
Tags
Property features AI
Exterior
- Parking: Driveway; Paved parking; Garage
- Utilities: Private well water; Septic tank sewer
- Home design: Single family residence; Two levels
- Construction: Block foundation; Asphalt roof; Built with typical residential construction
- Exterior features: Private yard; Outbuilding / shed(s); Sloped, wooded backyard with cleared, gently sloping areas
Interior
- Kitchen: Dishwasher; Range; Microwave; Refrigerator
- Flooring: Carpet; Hardwood; Ceramic tile
- Bathrooms: One full bathroom; One half bathroom
- Heating & cooling: Electric heating; Forced air; Wood stove
- Interior features: Granite counters; Open floor plan; Unfinished walk-out basement
- Laundry & utility: Washer; Dryer; Laundry on main level
Neighborhood map
What this means for you Summary
Snapshot
- This is a 3-bed/2.0-bath single-family listed at $389k.
Deal economics
- At list price, monthly cash flow is $2k ($18k/yr) — positive.
- The deal already cash-flows at list — no discount required.
- Meets the 1% rule at list price ($5k rent vs $389k).
- Cap rate 11.0% vs local median 2.4% in Wallenpaupack Lake Estates — top-decile yield for the area; either an underpriced asset or a hidden risk that comps aren't pricing in. Stress-test before assuming the spread holds.
Location & tenants
- Location reads 68/100 on livability (#896 in PA) — a middle-class / working-renter tenant base. Strengths: crime A+, cost of living A+, employment A; Watch: schools D+, amenities F, commute F.
- Wallenpaupack Area SD (rural): math 39% / reading 59% proficiency, ranked #192 of 539 in PA (top 36%) — families likely to look elsewhere, expect single-tenant / working-renter base with shorter leases.
- Market conditions: 29 active listings in the ZIP; 1 comparable units currently listed for rent nearby; 177 units permitted in Wayne County in 2024 (0 in 5+ unit buildings).
Forward outlook
- In year one you build about $18k of equity ($3k loan paydown + $16k appreciation (4.0% local appreciation)).
- Wayne County population projected at -17% by 2050 — secular population decline; favor cash flow + early exit over multi-decade hold.
- At projected returns (4.0% appreciation + 3.0% rent growth), your $109k cash investment doubles in ~3 years — after that, you're playing with house money.
- By year 3, paydown + projected appreciation supports a ~$46k cash-out refi (75% LTV) — recoverable capital for the next deal without selling this one.
Negotiation context
- Only 6 days on market — expect competitive offers; lowballing is unlikely to land.
- Current owner paid $180k; list at $389k implies a 116% gain — meaningful room to come down on a strong offer.
Risks & watch-outs
- Watch-outs: built in 1951 — expect roof / HVAC / electrical / plumbing capex.
Questions for the listing agent
- Built in 1951 — when were the roof, HVAC, electrical panel, plumbing, and water heater last replaced?
- Is there a deadline driving the sale (1031 exchange, divorce, estate, relocation)? That informs how much negotiation room exists.
- Schools are D-rated, which usually means shorter tenancies and higher turnover. Who's the typical renter profile here, and what's been the actual vacancy rate?
- What's the average days-on-market for RENTAL listings here right now (not sales)? A rising rental-DOM trend means longer vacancies and softer asking-rent achievability than the comps imply.
- What's the recent tenant-quality profile in this submarket — average credit score on applications, eviction rate, late-payment / NSF rate, and stable-employment percentage? A property-management company in the area should have these aggregated.
- How much new for-sale + rental construction is in the pipeline within 1–3 miles? Heavy new supply typically softens prices + rents 12–24 months out; constrained supply supports both.
Investment metrics
- 1% rule
- 1.29% ✓
- Cap rate
- 10.96%
- Cash-on-cash
- 16.68%
- DSCR
- 1.74
- GRM
- 6.5
CMA / ARV
- ARV (median comp)
- $377,916
- List price
- $389,000
- Delta
- 2.93%
- Verdict
- FAIR
- Comps
- 20 within 1.0 mi
Show comp detail 6 sales within ~0.75 mi
| Address | Dist | Beds/Ba | Sqft | Sold | Price | $/sf | Match |
|---|---|---|---|---|---|---|---|
| 19 Birch Dr | 0.22mi | 3/2.0 | 1,692 (0%) | 20mo | $548,000 | $324 | 73 |
| 103 Hemlock Dr | 0.23mi | 3/2.0 | 1,666 (-2%) | 19mo | $255,000 | $153 | 71 |
| 128 Terrace Dr | 0.37mi | 3/2.0 | 1,600 (-5%) | 12mo | $385,100 | $241 | 64 |
| 106 Hemlock Dr | 0.19mi | 3/1.0 | 1,447 (-14%) | 9mo | $309,000 | $214 | 55 |
| 15 Birch Dr | 0.23mi | 3/2.0 | 1,470 (-13%) | 21mo | $344,225 | $234 | 50 |
| 524 Hemlock Ln | 0.63mi | 2/2.0 (-1) | 1,601 (-5%) | 24mo | $330,000 | $206 | 37 |
Match score weights: distance 35% · size 25% · config 20% · recency 20%. Top-matched comps best support the ARV.
Projected returns pro-forma
4.05% appreciation · 3.0% rent growth · sell at horizon
- IRR
- 25.4%
- Equity multiple
- 2.52×
- Total profit
- $165,184
- Equity at exit
- $198,261
- IRR
- 25.2%
- Equity multiple
- 4.92×
- Total profit
- $426,884
- Equity at exit
- $325,098
Cash invested: $108,920 (down + closing). Projections, not guarantees.
Landlord ↔ Tenant lean methodology
- Overall (STATE)
- 62 Landlord-Friendly
- State Pennsylvania
- 62 Landlord-Friendly · EVEN
- County
- — inherits STATE
- City
- — inherits STATE
ZIP-level market 18438
- Home prices YoY
- 1.3%
- Active inventory
- 29
- Price-to-rent
- 6.5×
Monthly cashflow live
- Estimated rent
- $5,000 medium interval (Pro) →
- Mortgage (P&I)
- −$2,040
- Tax from tax record
- −$234 /mo · $2,802/yr
- Insurance
- −$162
- HOA
- −$0
- Vacancy / Maint / Mgmt
- −$1,050
- Net cashflow
- $1,514
Break-even live
UW: 25.0% down · 7.5% · 30yr · 1.5% tax · 5.0% vac · 8.0% maint · 8.0% mgmt
Financing live
Cash to close
- Down payment
- $97,250
- Closing costs
- $11,670
- Reserves months
- —
- Total cash needed
- —
Loan-product check · same deal, 3 products live
Conventional
25% down · 7.5% · 30yr
- Down + closing
- —
- Monthly P&I
- —
- Monthly cashflow
- —
- DSCR
- —
- Eligible?
- —
Personal DTI + credit; lowest rate.
DSCR
20% down · 8.5% · 30yr
- Down + closing
- —
- Monthly P&I
- —
- Monthly cashflow
- —
- DSCR
- —
- Eligible?
- —
No personal income docs; deal must DSCR.
Hard money
10% down · 12.0% · 12mo
- Down + closing
- —
- Monthly P&I
- —
- Monthly cashflow
- —
- DSCR
- —
- Eligible?
- —
Short-term bridge; refi at stabilization.
Rent comps 1 comps
| Address | Beds | Baths | Sqft | Rent | $/sqft | DOM | Units | Dist |
|---|---|---|---|---|---|---|---|---|
| 46 Summit Cir Lakeville, PA | 3.0 | 2.0 | 1152 | $5,000 | $4.34 | 13d | 1 | 1.09mi |
Listing history 3 events
-
2026-05-14$389,000 Active 978-char remark
-
2009-02-06soldstatus $180,000
-
1987-10-13soldstatus $80,000
ⓘ Source: listings_history table (triggers on properties + properties_extension) + one-shot
backfill from property_details.listing_events for pre-trigger history.
Tax reassessment forecast PA · Partial reset (capped growth)
- Current annual tax
- $2,802 · $234/mo
- Projected year-2 tax
- $4,474 · $373/mo
- Expected delta
- +$1,672/yr (+$139/mo · 59.7%)
ⓘ Screening estimate from a state-policy table — verify with the county assessor before closing.
Climate risk First Street
- Flood 1/10 Low FEMA zone X (unshaded) · 0% chance over 30 yrs
- Wildfire 3/10 Moderate
- Heat 2/10 Low 7 d/yr ≥91°F today · 15 d/yr by 30 yrs out
- Wind 3/10 Moderate 4% chance of damaging wind over 30 yrs
- Air quality 2/10 Low 1 unhealthy d/yr today · 1 by 30 yrs out
Nearby sold comps map
Loading sold comps map…
Walkable amenities ~0.75 mi
Loading nearby amenities…
Taxation est. · year 1
- Rental income
- $60,000
- − Mortgage interest
- −$21,790
- − Property taxes
- −$2,802
- − Insurance
- −$1,945
- − Repairs & maintenance
- −$4,800
- − Management
- −$4,800
- − Depreciation
- −$11,316
- Taxable income
- $12,546
- Est. tax owed @ 24.0%
- −$3,011
- After-tax cash flow
- $15,162/yr
For passive investors: Depreciation is non-cash, so a rental often shows a tax loss while cash-flowing — sheltering income. Rental losses are passive: they offset passive income freely, and up to $25,000/yr can offset ordinary (W-2) income if you actively participate and your MAGI is under $100k (phasing out to $0 by $150k); unused losses carry forward. On sale, claimed depreciation is recaptured at up to 25%, and gains may owe capital-gains tax (a 1031 exchange can defer both). Figures are a year-1 estimate at your 24.0% rate — not tax advice; consult a CPA.
Schools (NCES district)
- District
- Wallenpaupack Area SD
- NCES district ID
- 4224750
- Math proficiency
- 39% ▼ -10.00%
- Reading proficiency
- 59% ▼ -5.00%
- Median HH income
- $51,027
- Composite
- 41.97/100
- National rank
- #3345
- State rank
- #192 of 539 in PA
Livability — Wallenpaupack Lake Estates
- Score
- 68/100
- State rank
- #896
- US rank
- #9541
Category grades
Schools grade is shown separately in the Schools card above.
Census & demographics
- Population (ZIP)
- 1,474
Population outlook (Wayne County) Hauer SSP2
- Today (2025)
- 47,924 people
- By 2030
- 46,191 · -3.6%
- By 2040
- 42,815 · -10.7%
- By 2050
- 39,873 · -16.8%
- By 2075
- 34,556 · -27.9%
- By 2100
- 28,358 · -40.8%
Race, ethnicity, and origin ACS 2023
- Neighborhood character
- Predominantly White (83%)
- Race & ethnicity
- White 83% Two or more races 14% Hispanic / Latino 3%
- Common ancestry
- American 3% Polish 2% Romanian 2%
- Foreign-born
- 17% · Canada
- Languages at home
- 84% English-only · Other Indo-European 3% Russian/Polish/Slavic 3% Spanish 1%
Political lean MEDSL · Wayne
- 2024 margin
- Solid R (+37.1) · D 31.1% · R 68.2%
- 2008→2024 swing
- -24.8pp toward R · 2008: -12.3pp · 2024: -37.1pp
- All cycles
- 2024: R+37.1 2020: R+33.6 2016: R+39.7 2012: R+20.9 2008: R+12.3
Not yet ingested
- Civics
- —
Market trends
- HPI YoY
- ▲ 4.05%
- Current HPI
- 325.6643
- Rent YoY
- —
- Metro
- —
- State GDP YoY
- ▲ 1.68%
- F500 in state
- 34
Industry mix (Fortune 500 HQ in PA)
| Industry | F500 HQs | Revenue |
|---|---|---|
| Healthcare | 2 | $309B |
|
||
| Insurance | 2 | $27B |
|
||
| Telecommunications / Media | 1 | $124B |
|
||
| Industrial Distribution | 1 | $22B |
|
||
| Financial Services | 1 | $20B |
|
||
| Chemicals / Materials | 1 | $18B |
|
||
Price history
+386.2% since first listed4 events — show timeline
- 2026-05-21 Pending — PWMLS
- 2026-05-14 Listed $389,000 PWMLS
- 2009-02-06 Sold (Public Records) $180,000 Public Records
- 1987-10-13 Sold (Public Records) $80,000 Public Records
Property tax history
+2.0%/yrLatest (2026): $2,802 · +2.3% YoY. Source: county tax records.
Cash-flow waterfall
monthlySold comps — $/sqft
last 12 mo · ≤1 miLoading sold comps…