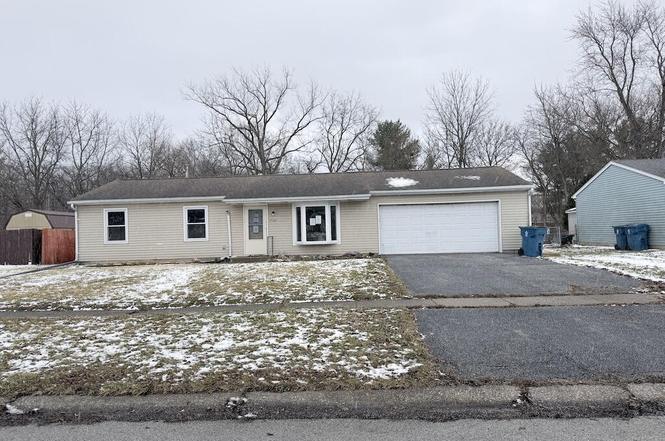
17329 Sequoia Ave · Lowell, IN
Flood risk 4/10 · Minor
- FEMA flood zone
- X (shaded)
- Chance of flooding over 30 yrs
- 0.24%
- Est. flood insurance / yr
- $507 – $1,088
Fire risk 2/10 · Minimal
- Est. fire insurance / yr
- $717 – $1,331
Heat risk 3/10 · Minor
- Hot days now (above 101°F)
- 7 days/yr
- Hot days in 30 yrs
- 16 days/yr
Wind risk 2/10 · Minimal
- Chance of severe wind over 30 yrs
- 0.0%
Air-quality risk 2/10 · Minimal
- Unhealthy air days now
- 1 days/yr
- Unhealthy air days in 30 yrs
- 2 days/yr
Risk factors via First Street. Map © Google.
Why this score? — see what drove the D+ grade
The composite is a weighted blend of 9 inputs, each scored 0–100. Each bar is that input's sub-score; the figure is the points it added to the 100-point composite (weight × sub-score).
- ARV discount +15.0/15.0
- Cash flow +14.2/30.0
- Schools +4.5/10.0
- DSCR +4.3/10.0
- Livability +3.8/5.0
- 1% rule +3.1/10.0
- Rent growth +2.5/5.0
- Condition / age +2.5/5.0
- Appreciation +0.0/10.0
$185,000
🖨 Deal sheet (PDF) 📄 Offer letter ✓ Due diligence
Listing remarks MLS
This one won't last long! 3 Bed 1 bath home with 2.5 car HEATED GARAGE, NEW GENERAC GENERATOR INCLUDED AND AN EXTRA SHOP with SINGLE REAR GARAGE door, and Not 1 BUT 2 additional STORAGE SHEDS! With a FRESH COAT OF PAINT this home is MOVE IN READY! FENCED IN YARD AND LARGE UTILITY ROOM. SIT on your back patio and listen to water flowing in the brook in the back yard. Located just minutes from downtown LOWELL and CLOSE TO THE ILLINOIS LINE! MAKE SURE TO CHECK THIS ONE OUT TODAY!
Key facts
- Laundry area
- Fenced yard
- 2 storage sheds
Tags
Property features AI
Exterior
- Parking: Attached garage; 2 garage spaces
- Utilities: Public water; Public sewer
- Home design: Single-story home; Built in 1980
- Construction: Built in 1980
- Exterior features: Neighborhood view
Interior
- Kitchen: Range
- Bedrooms: Primary bedroom; Bedroom 2; Bedroom 3; Other room; Total of 6 rooms
- Bathrooms: 1 full bathroom
- Heating & cooling: Forced air heating (natural gas); Central air conditioning
- Interior features: Eat-in kitchen; Neighborhood view
Neighborhood map
What this means for you Summary
Snapshot
- This is a 3-bed/2.0-bath single-family listed at $185k.
Deal economics
- At list price, monthly cash flow is $31 ($372/yr) — positive.
- The deal already cash-flows at list — no discount required.
- To meet the 1% rule (rent ≥ 1% of price), the offer needs to be $149k (19.4% below list).
- Recommended offer: $149k (19.4% below list) — sets the bar for 1% rule.
- Cap rate 6.5% vs local median 3.8% in Lowell — top-decile yield for the area; either an underpriced asset or a hidden risk that comps aren't pricing in. Stress-test before assuming the spread holds.
Location & tenants
- Location reads 76/100 on livability (#51 in IN, #3,455 nationally) — a middle-class / working-renter tenant base. Strengths: crime A+, cost of living A+, housing A+; Watch: health & safety C-, amenities F, commute F.
- Tri-Creek School Corporation (town): math 46% / reading 56% proficiency, ranked #39 of 301 in IN (top 13%) — acceptable for families but not a draw, mixed tenant base, ~2y average lease.
- Zoned schools: Oak Hill Elementary School (math 69% / reading 54%, grade B, #117 of 994 statewide, top 12%, 563 students, 30% FRL); Lowell Middle School (math 36% / reading 54%, grade D, #81 of 330 statewide, top 25%, 742 students, 33% FRL); Lowell Senior High School (math 31% / reading 75%, grade C-, #99 of 369 statewide, top 27%, 1,033 students, 29% FRL).
- Market conditions: 353 active listings in the ZIP; 1 comparable units currently listed for rent nearby; 1,642 units permitted in Lake County in 2024 (14 in 5+ unit buildings).
Forward outlook
- Local home prices are declining (-3.0%/yr); year-one equity from $1k of loan paydown is wiped out by about $6k of value loss. Plan a longer hold.
- Lake County population projected to shrink 7% by 2050 — rents likely to lag national; underwrite the cash flow, not the appreciation.
Negotiation context
- It's been on market 88 days — a 6% lower offer ($174k) is reasonable based on typical stale-listing flexibility.
- 3 sale attempts since 5y ago with the ask held roughly flat each time — persistent listings suggest the price (not the market) is what's stuck; bring a comps-based counter.
Questions for the listing agent
- It's been on market 88 days. Have you received any prior offers? Is the seller open to a 19% concession, seller financing, or rate buy-down credit?
- Why hasn't it sold? Are there any deal-killer items the seller is aware of (foundation, flood, title, zoning, code violations)?
- Is there a deadline driving the sale (1031 exchange, divorce, estate, relocation)? That informs how much negotiation room exists.
- The area grade is low — what's the realistic commute time and amenity access for the typical tenant pool here? Any planned neighborhood developments (good or bad) we should know about?
- What's the average days-on-market for RENTAL listings here right now (not sales)? A rising rental-DOM trend means longer vacancies and softer asking-rent achievability than the comps imply.
- What's the recent tenant-quality profile in this submarket — average credit score on applications, eviction rate, late-payment / NSF rate, and stable-employment percentage? A property-management company in the area should have these aggregated.
- How much new for-sale + rental construction is in the pipeline within 1–3 miles? Heavy new supply typically softens prices + rents 12–24 months out; constrained supply supports both.
Investment metrics
- 1% rule
- 0.81% ✗
- Cap rate
- 6.49%
- Cash-on-cash
- 0.72%
- DSCR
- 1.03
- GRM
- 10.3
CMA / ARV
- ARV (on-the-fly)
- $247,248
- Comps found
- 9
Show comp detail 9 sales within ~0.75 mi
| Address | Dist | Beds/Ba | Sqft | Sold | Price | $/sf | Match |
|---|---|---|---|---|---|---|---|
| 17329 Sequoia Ave | 0.00mi | 3/1.0 | 1,212 (0%) | 0mo | $183,500 | $151 | 96 |
| 7670 Lafayette Pl | 0.24mi | 3/2.0 | 1,243 (+3%) | 9mo | $318,000 | $256 | 77 |
| 7273 Laurel Ln | 0.17mi | 3/1.0 | 1,032 (-15%) | 9mo | $280,000 | $271 | 56 |
| 7337 S Willowbrook Dr | 0.24mi | 3/2.0 | 1,362 (+12%) | 19mo | $167,000 | $123 | 52 |
| 521 Cottage Grove St | 0.65mi | 4/1.0 (+1) | 1,262 (+4%) | 4mo | $201,000 | $159 | 50 |
| 471 Apache Ln | 0.73mi | 3/2.0 | 1,248 (+3%) | 18mo | $285,000 | $228 | 46 |
| 17448 Brookwood Dr | 0.68mi | 2/1.0 (-1) | 1,264 (+4%) | 22mo | $219,500 | $174 | 33 |
| 512 Dakota Dr | 0.68mi | 3/2.0 | 1,372 (+13%) | 19mo | $280,000 | $204 | 30 |
| 540 Seminole Dr | 0.72mi | 3/2.0 | 1,372 (+13%) | 22mo | $295,000 | $215 | 26 |
Match score weights: distance 35% · size 25% · config 20% · recency 20%. Top-matched comps best support the ARV.
Projected returns pro-forma
-3.0% appreciation · 3.0% rent growth · sell at horizon
- IRR
- -15.2%
- Equity multiple
- 0.46×
- Total profit
- $-28,064
- Equity at exit
- $27,584
- IRR
- -6.7%
- Equity multiple
- 0.57×
- Total profit
- $-22,133
- Equity at exit
- $15,995
Cash invested: $51,800 (down + closing). Projections, not guarantees.
Landlord ↔ Tenant lean methodology
- Overall (STATE)
- 90 Strongly Landlord-Friendly
- State Indiana
- 90 Strongly Landlord-Friendly · R+11
- County
- — inherits STATE
- City
- — inherits STATE
ZIP-level market 46356
- Home prices YoY
- -30.1%
- Active inventory
- 353
- Price-to-rent
- 10.3×
Monthly cashflow live
- Estimated rent
- $1,492 medium interval (Pro) →
- Mortgage (P&I)
- −$970
- Tax from tax record
- −$100 /mo · $1,206/yr
- Insurance
- −$77
- HOA
- −$0
- Lot rent
- −$0
- Vacancy / Maint / Mgmt
- −$313
- Net cashflow
- $31
Break-even live
Sensitivity live
| Price | -10% $136 | -5% $83 | +0% $31 | +5% $-21 | +10% $-74 |
|---|---|---|---|---|---|
| Rent | -10% $-87 | -5% $-28 | +0% $31 | +5% $90 | +10% $149 |
| Rate | -1.0pp $124 | -0.5pp $78 | base $31 | +0.5pp $-17 | +1.0pp $-66 |
UW: 25.0% down · 7.5% · 30yr · 1.5% tax · 5.0% vac · 8.0% maint · 8.0% mgmt
Financing live
Cash to close
- Down payment
- $46,250
- Closing costs
- $5,550
- Reserves months
- —
- Total cash needed
- —
Loan-product check · same deal, 3 products live
Conventional
25% down · 7.5% · 30yr
- Down + closing
- —
- Monthly P&I
- —
- Monthly cashflow
- —
- DSCR
- —
- Eligible?
- —
Personal DTI + credit; lowest rate.
DSCR
20% down · 8.5% · 30yr
- Down + closing
- —
- Monthly P&I
- —
- Monthly cashflow
- —
- DSCR
- —
- Eligible?
- —
No personal income docs; deal must DSCR.
Hard money
10% down · 12.0% · 12mo
- Down + closing
- —
- Monthly P&I
- —
- Monthly cashflow
- —
- DSCR
- —
- Eligible?
- —
Short-term bridge; refi at stabilization.
Rent comps 1 comps
| Address | Beds | Baths | Sqft | Rent | $/sqft | DOM | Units | Dist |
|---|---|---|---|---|---|---|---|---|
| 510 Creekside Dr Lowell, IN | 1.0–2.0 | 1.0–2.0 | 962 | $1,492 | $1.55 | 0d | 7 | 1.47mi |
Listing history 8 events
-
2026-04-20status Pending
-
2026-04-08status Active
-
2026-04-07status Pending
-
2026-03-19price $185,000
-
2026-01-21$192,900 Active
-
2021-11-09soldstatus $205,500 Closed 481-char remark
Show marketing remark (481 chars)
This one won't last long! 3 Bed 1 bath home with 2.5 car HEATED GARAGE, NEW GENERAC GENERATOR INCLUDED AND AN EXTRA SHOP with SINGLE REAR GARAGE door, and Not 1 BUT 2 additional STORAGE SHEDS! With a FRESH COAT OF PAINT this home is MOVE IN READY! FENCED IN YARD AND LARGE UTILITY ROOM. SIT on your back patio and listen to water flowing in the brook in the back yard. Located just minutes from downtown LOWELL and CLOSE TO THE ILLINOIS LINE! MAKE SURE TO CHECK THIS ONE OUT TODAY!
-
2021-09-30historical 481-char remark
Show marketing remark (481 chars)
This one won't last long! 3 Bed 1 bath home with 2.5 car HEATED GARAGE, NEW GENERAC GENERATOR INCLUDED AND AN EXTRA SHOP with SINGLE REAR GARAGE door, and Not 1 BUT 2 additional STORAGE SHEDS! With a FRESH COAT OF PAINT this home is MOVE IN READY! FENCED IN YARD AND LARGE UTILITY ROOM. SIT on your back patio and listen to water flowing in the brook in the back yard. Located just minutes from downtown LOWELL and CLOSE TO THE ILLINOIS LINE! MAKE SURE TO CHECK THIS ONE OUT TODAY!
-
2021-08-11$209,800 481-char remark
Show marketing remark (481 chars)
This one won't last long! 3 Bed 1 bath home with 2.5 car HEATED GARAGE, NEW GENERAC GENERATOR INCLUDED AND AN EXTRA SHOP with SINGLE REAR GARAGE door, and Not 1 BUT 2 additional STORAGE SHEDS! With a FRESH COAT OF PAINT this home is MOVE IN READY! FENCED IN YARD AND LARGE UTILITY ROOM. SIT on your back patio and listen to water flowing in the brook in the back yard. Located just minutes from downtown LOWELL and CLOSE TO THE ILLINOIS LINE! MAKE SURE TO CHECK THIS ONE OUT TODAY!
ⓘ Source: listings_history table (triggers on properties + properties_extension) + one-shot
backfill from property_details.listing_events for pre-trigger history.
Tax reassessment forecast IN · Partial reset (capped growth)
- Current annual tax
- $1,206 · $100/mo
- Projected year-2 tax
- $1,389 · $116/mo
- Expected delta
- +$183/yr (+$15/mo · 15.2%)
ⓘ Screening estimate from a state-policy table — verify with the county assessor before closing.
Climate risk First Street
- Flood 4/10 Moderate FEMA zone X (shaded) · 24% chance over 30 yrs
- Wildfire 2/10 Low
- Heat 3/10 Moderate 7 d/yr ≥101°F today · 16 d/yr by 30 yrs out
- Wind 2/10 Low 0% chance of damaging wind over 30 yrs
- Air quality 2/10 Low 1 unhealthy d/yr today · 2 by 30 yrs out
Nearby sold comps map
Loading sold comps map…
Walkable amenities ~0.75 mi
Loading nearby amenities…
Taxation est. · year 1
- Rental income
- $17,904
- − Mortgage interest
- −$10,363
- − Property taxes
- −$1,206
- − Insurance
- −$925
- − Repairs & maintenance
- −$1,432
- − Management
- −$1,432
- − Depreciation
- −$5,382
- Taxable loss
- −$2,836
- Est. tax savings @ 24.0%
- +$681
- After-tax cash flow
- $1,052/yr
For passive investors: Depreciation is non-cash, so a rental often shows a tax loss while cash-flowing — sheltering income. Rental losses are passive: they offset passive income freely, and up to $25,000/yr can offset ordinary (W-2) income if you actively participate and your MAGI is under $100k (phasing out to $0 by $150k); unused losses carry forward. On sale, claimed depreciation is recaptured at up to 25%, and gains may owe capital-gains tax (a 1031 exchange can defer both). Figures are a year-1 estimate at your 24.0% rate — not tax advice; consult a CPA.
Schools (NCES district)
- District
- Tri-Creek School Corporation
- NCES district ID
- 1811460
- Math proficiency
- 46% ▼ -8.00%
- Reading proficiency
- 56% ▼ -5.00%
- Median HH income
- $64,614
- Composite
- 44.97/100
- National rank
- #2704
- State rank
- #39 of 301 in IN
Livability — Lowell
- Score
- 76/100
- State rank
- #51
- US rank
- #3455
Category grades
Schools grade is shown separately in the Schools card above.
Census & demographics
- Census place
- Lowell, IN
- City population
- 19,396
- Population (ZIP)
- 19,396
Population outlook (Lake County) Hauer SSP2
- Today (2025)
- 484,026 people
- By 2030
- 478,091 · -1.2%
- By 2040
- 462,974 · -4.3%
- By 2050
- 449,894 · -7.1%
- By 2075
- 436,169 · -9.9%
- By 2100
- 426,607 · -11.9%
Race, ethnicity, and origin ACS 2023
- Neighborhood character
- Predominantly White (88%)
- Race & ethnicity
- White 88% Hispanic / Latino 9% Two or more races 6%
- Hispanic origin (detail)
- Mexican 8%
- Common ancestry
- Romanian 16% Iranian 10% Lithuanian 2%
- Foreign-born
- 4% · Canada
- Languages at home
- 95% English-only · Spanish 4% Russian/Polish/Slavic 1%
Political lean MEDSL · Lake
- 2024 margin
- Lean D (+5.6) · D 52.1% · R 46.5% · Other 1.5%
- 2008→2024 swing
- -28.6pp toward R · 2008: 34.3pp · 2024: 5.6pp
- All cycles
- 2024: D+5.6 2020: D+15.1 2016: D+20.6 2012: D+31.0 2008: D+34.3
Not yet ingested
- Civics
- —
Market trends
- HPI YoY
- ▼ -110.73%
- Current HPI
- 256.6224
- Rent YoY
- —
- Metro
- —
- State GDP YoY
- ▲ 2.90%
- F500 in state
- 18
Industry mix (Fortune 500 HQ in IN)
| Industry | F500 HQs | Revenue |
|---|---|---|
| Industrial Machinery | 2 | $37B |
|
||
| Healthcare | 1 | $177B |
|
||
| Pharmaceuticals | 1 | $45B |
|
||
| Metals / Steel | 1 | $18B |
|
||
| Agriculture | 1 | $17B |
|
||
| Packaging | 1 | $12B |
|
||
Price history
-11.8% since first listed8 events — show timeline
- 2026-04-20 Pending — NIRA MLS as Distributed by MLS Grid
- 2026-04-08 Relisted — NIRA MLS as Distributed by MLS Grid
- 2026-04-07 Pending — NIRA MLS as Distributed by MLS Grid
- 2026-03-19 Price Changed $185,000 NIRA MLS as Distributed by MLS Grid
- 2026-01-21 Listed $192,900 NIRA MLS as Distributed by MLS Grid
- 2021-11-09 Sold (MLS) $205,500 NIRA MLS as Distributed by MLS Grid
- 2021-09-30 Listing Removed — NIRA MLS as Distributed by MLS Grid
- 2021-08-11 Listed $209,800 NIRA MLS as Distributed by MLS Grid
Property tax history
+3.1%/yrLatest (2024): $1,206 · +0.5% YoY. Source: county tax records.
Cash-flow waterfall
monthlySold comps — $/sqft
last 12 mo · ≤1 miLoading sold comps…