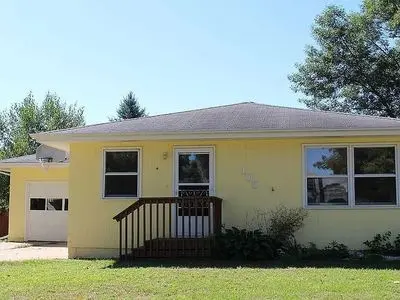
105 W 42nd St St · Sioux Falls, SD
Flood risk 1/10 · Minimal
- FEMA flood zone
- X (shaded)
- Chance of flooding over 30 yrs
- 0.0%
- Est. flood insurance / yr
- $473 – $860
Fire risk 2/10 · Minimal
- Est. fire insurance / yr
- $1,342 – $2,492
Heat risk 3/10 · Minor
- Hot days now (above 99°F)
- 7 days/yr
- Hot days in 30 yrs
- 14 days/yr
Wind risk 2/10 · Minimal
- Chance of severe wind over 30 yrs
- —
Air-quality risk 2/10 · Minimal
- Unhealthy air days now
- 1 days/yr
- Unhealthy air days in 30 yrs
- 1 days/yr
Risk factors via First Street. Map © Google.
Why this score? — see what drove the B grade
The composite is a weighted blend of 9 inputs, each scored 0–100. Each bar is that input's sub-score; the figure is the points it added to the 100-point composite (weight × sub-score).
- Cash flow +30.0/30.0
- 1% rule +10.0/10.0
- DSCR +10.0/10.0
- ARV discount +7.5/15.0
- Livability +4.2/5.0
- Rent growth +3.8/5.0
- Schools +3.7/10.0
- Condition / age +2.5/5.0
- Appreciation +0.0/10.0
$100,000
🖨 Deal sheet 📄 Offer letter ✓ Due diligence
Listing remarks MLS
Great family home in a convenient, central location. Three bedrooms on the main level, updated kitchen, nice living space on main level with lots of light. Large lower level family room space, storage and non-legal bedroom on the lower level. Nice big backyard.
Key facts
- 7,392 sq ft lot
- Garage
- Built 1964
Property features AI
Finance
- Financial info: Annual tax information available
Exterior
- Parking: Attached 1-car garage (16' x 21')
- Utilities: Public water; Public sewer; Natural gas service
- Home design: Single-family ranch-style home; Owned land
- Construction: Hard board siding; Composition roof; Other foundation
- Exterior features: City lot; Irregular lot shape
Interior
- Kitchen: Electric range
- Bedrooms: Main-level master bedroom (approx. 11' x 13'); Main-level second bedroom (approx. 11' x 10'); Main-level third bedroom (approx. 8' x 10')
- Flooring: Carpet
- Bathrooms: One full bathroom on the main level
- Heating & cooling: Natural gas heating; Central air conditioning
- Interior features: Full basement; No fireplace; Water softener: none
- Laundry & utility: Water heater: natural gas
Neighborhood map
What this means for you Summary
Snapshot
- This is a 4-bed/2.0-bath single-family listed at $100k.
Deal economics
- At list price, monthly cash flow is $531 ($6k/yr) — positive.
- The deal already cash-flows at list — no discount required.
- Meets the 1% rule at list price ($2k rent vs $100k).
- Cap rate 12.7% vs local median 2.6% in Sioux Falls — top-decile yield for the area; either an underpriced asset or a hidden risk that comps aren't pricing in. Stress-test before assuming the spread holds.
Location & tenants
- Location reads 85/100 on livability (#3 in SD, #610 nationally) — a professional / high-income tenant draw. Strengths: amenities A+, commute A+, cost of living A+; Watch: crime F.
- Sioux Falls School District 49-5 (urban): math 39% / reading 48% proficiency, ranked #45 of 59 in SD (top 76%) — families likely to look elsewhere, expect single-tenant / working-renter base with shorter leases.
- Zoned schools: Robert Frost Elementary - 18 (math 39% / reading 43%, grade F, #163 of 253 statewide, top 64%, 442 students, 34% FRL); Patrick Henry Middle School - 07 (math 42% / reading 53%, grade C-, #69 of 143 statewide, top 48%, 940 students, 24% FRL).
- Market conditions: Rents rising fast (+5.2%/yr); 171 active listings in the ZIP; 9 comparable units currently listed for rent nearby; rentals lingering (median 44d on market — plan ~5-8 weeks vacancy on turnover, expect pricing pressure); 56% of comp listings sitting > 30 days — soft ceiling on asking rent; solid renter incomes; 2,425 units permitted in Minnehaha County in 2024 (1,367 in 5+ unit buildings).
Forward outlook
- Local home prices are declining (-3.0%/yr); year-one equity from $691 of loan paydown is wiped out by about $3k of value loss. Plan a longer hold.
- Minnehaha County population projected at +46% by 2050 — long-run rental-demand tailwind backs the buy-and-hold thesis.
- At projected returns (-3.0% appreciation + 5.2% rent growth), your $28k cash investment doubles in ~5 years — after that, you're playing with house money.
Negotiation context
- Only 13 days on market — expect competitive offers; lowballing is unlikely to land.
- 2 sale attempts since 10y ago with the ask held roughly flat each time — persistent listings suggest the price (not the market) is what's stuck; bring a comps-based counter.
Risks & watch-outs
- Watch-outs: property tax is 2.9% of price.
Questions for the listing agent
- Built in 1964 — when were the roof, HVAC, electrical panel, plumbing, and water heater last replaced?
- Property tax is high relative to price — has the assessment been appealed recently, and will the sale trigger a re-assessment?
- Is there a deadline driving the sale (1031 exchange, divorce, estate, relocation)? That informs how much negotiation room exists.
- Schools are B-rated — typically a magnet for longer-tenancy family renters. What's the average tenant stay here, and is there a school-zone premium baked into asking?
- Crime grade is F in this area — have there been break-ins, vandalism, or insurance claims at this property in the last 3 years? What carrier currently insures it and at what premium?
- What's the average days-on-market for RENTAL listings here right now (not sales)? A rising rental-DOM trend means longer vacancies and softer asking-rent achievability than the comps imply.
- What's the recent tenant-quality profile in this submarket — average credit score on applications, eviction rate, late-payment / NSF rate, and stable-employment percentage? A property-management company in the area should have these aggregated.
- How much new for-sale + rental construction is in the pipeline within 1–3 miles? Heavy new supply typically softens prices + rents 12–24 months out; constrained supply supports both.
Investment metrics
- 1% rule
- 1.70% ✓
- Cap rate
- 12.66%
- Cash-on-cash
- 22.75%
- DSCR
- 2.01
- GRM
- 4.9
CMA / ARV
- ARV (on-the-fly)
- $293,436
- Comps found
- 12
Show comp detail 12 sales within ~0.75 mi
| Address | Dist | Beds/Ba | Sqft | Sold | Price | $/sf | Match |
|---|---|---|---|---|---|---|---|
| 3105 S Carter Pl Pl | 0.41mi | 4/2.0 | 1,751 (+2%) | 8mo | $299,900 | $171 | 70 |
| 204 E 41st St | 0.15mi | 4/2.0 | 1,884 (+10%) | 14mo | $275,000 | $146 | 65 |
| 104 E 40th St | 0.18mi | 4/2.0 | 1,946 (+13%) | 9mo | $305,000 | $157 | 61 |
| 3108 S 7th Ave Ave | 0.60mi | 3/2.0 (-1) | 1,750 (+2%) | 7mo | $275,000 | $157 | 58 |
| 2900 Prairie Ave Ave Ave | 0.61mi | 4/2.0 | 1,816 (+6%) | 5mo | $227,500 | $125 | 58 |
| 3308 S Poplar Dr | 0.24mi | 3/1.5 (-1) | 1,526 (-11%) | 11mo | $244,500 | $160 | 54 |
| 3400 S Center Ave | 0.11mi | 3/1.0 (-1) | 1,497 (-13%) | 13mo | $267,000 | $178 | 54 |
| 2708 S Prairie Ave | 0.71mi | 4/2.0 | 1,798 (+5%) | 11mo | $312,000 | $174 | 50 |
| 304 E Sunnybrook Dr Dr | 0.66mi | 3/2.0 (-1) | 1,820 (+6%) | 6mo | $368,050 | $202 | 49 |
| 3105 S 7th Ave | 0.58mi | 3/1.5 (-1) | 1,816 (+6%) | 13mo | $335,000 | $184 | 46 |
| 916 W 37th St St | 0.65mi | 3/2.0 (-1) | 1,566 (-9%) | 7mo | $304,888 | $195 | 44 |
| 1001 E 38th St | 0.70mi | 4/2.5 | 1,932 (+13%) | 12mo | $314,900 | $163 | 34 |
Match score weights: distance 35% · size 25% · config 20% · recency 20%. Top-matched comps best support the ARV.
Projected returns pro-forma
-3.0% appreciation · 5.25% rent growth · sell at horizon
- IRR
- 18.5%
- Equity multiple
- 1.77×
- Total profit
- $21,632
- Equity at exit
- $14,910
- IRR
- 28.6%
- Equity multiple
- 3.84×
- Total profit
- $79,648
- Equity at exit
- $8,646
Cash invested: $28,000 (down + closing). Projections, not guarantees.
Landlord ↔ Tenant lean methodology
- Overall (STATE)
- 83 Strongly Landlord-Friendly
- State South Dakota
- 83 Strongly Landlord-Friendly · R+16
- County
- — inherits STATE
- City
- — inherits STATE
ZIP-level market 57105
- Rents YoY
- 5.2%
- Active inventory
- 171
- Price-to-rent
- 4.9×
Monthly cashflow live
- Estimated rent
- $1,697 high interval (Pro) →
- Mortgage (P&I)
- −$524
- Tax from tax record
- −$243 /mo · $2,920/yr
- Insurance
- −$42
- HOA
- −$0
- Vacancy / Maint / Mgmt
- −$356
- Net cashflow
- $531
Break-even live
UW: 25.0% down · 7.5% · 30yr · 1.5% tax · 5.0% vac · 8.0% maint · 8.0% mgmt
Financing live
Cash to close
- Down payment
- $25,000
- Closing costs
- $3,000
- Reserves months
- —
- Total cash needed
- —
Loan-product check · same deal, 3 products live
Conventional
25% down · 7.5% · 30yr
- Down + closing
- —
- Monthly P&I
- —
- Monthly cashflow
- —
- DSCR
- —
- Eligible?
- —
Personal DTI + credit; lowest rate.
DSCR
20% down · 8.5% · 30yr
- Down + closing
- —
- Monthly P&I
- —
- Monthly cashflow
- —
- DSCR
- —
- Eligible?
- —
No personal income docs; deal must DSCR.
Hard money
10% down · 12.0% · 12mo
- Down + closing
- —
- Monthly P&I
- —
- Monthly cashflow
- —
- DSCR
- —
- Eligible?
- —
Short-term bridge; refi at stabilization.
Rent comps 9 comps
| Address | Beds | Baths | Sqft | Rent | $/sqft | DOM | Units | Dist |
|---|---|---|---|---|---|---|---|---|
| 104 W 37th St Unit 104 Sioux Falls, SD | 3.0 | 2.0 | 1415 | $1,586 | $1.12 | 43d | 1 | 0.32mi |
| 104 W 37th St Unit 104 Sioux Falls, SD | 3.0 | 2.0 | 1415 | $1,586 | $1.12 | 21d | 1 | 0.32mi |
| 2310 S Euclid Ave Sioux Falls, SD | 3.0 | 1.0 | 1102 | $1,250 | $1.13 | 43d | 1 | 1.00mi |
| 1811 S Spring Ave Sioux Falls, SD | 3.0 | 1.0 | 1600 | $1,595 | $1.00 | 43d | 1 | 1.07mi |
| 3804 S Hawthorne Ave Unit 3 Sioux Falls, SD | 3.0 | 1.5 | 1200 | $1,165 | $0.97 | 43d | 1 | 1.08mi |
| 1907 S Prairie Ave Sioux Falls, SD | 4.0 | 1.5 | 1823 | $1,875 | $1.03 | 21d | 1 | 1.13mi |
| 1906 S Menlo Ave Sioux Falls, SD | 4.0 | 2.0 | 1300 | $1,640 | $1.26 | 43d | 1 | 1.16mi |
| 5500 S Mac Arthur Ln Sioux Falls, SD | 2.0–3.0 | 1.0–1.5 | 1043 | $1,097 | $1.05 | 13d | 4 | 1.27mi |
| 712 W 22nd St Sioux Falls, SD | 5.0 | 2.0 | 1738 | $2,000 | $1.15 | 13d | 1 | 1.38mi |
Listing history 17 events
-
2026-06-17status $100,000 Pending 13 DOM
-
2026-06-16days on market $100,000 Active 13 DOM
-
2026-06-15days on market $100,000 Active 12 DOM
-
2026-06-14days on market $100,000 Active 10 DOM
-
2026-06-13days on market $100,000 Active 9 DOM
-
2026-06-10days on market $100,000 Active 7 DOM
-
2026-06-09days on market $100,000 Active 6 DOM
-
2026-06-08days on market $100,000 Active 5 DOM
-
2026-06-07days on market $100,000 Active 4 DOM
-
2026-06-03pricedays on market $100,000 Active 1 DOM
-
2026-06-02days on market $247,500 Active 21 DOM
-
2026-06-01days on market $247,500 Active 20 DOM
-
2026-05-31days on market $247,500 Active 19 DOM
-
2026-05-30days on market $247,500 Active 18 DOM
-
2026-05-12$247,500 Active 544-char remark
-
2016-12-19soldstatus $127,500
-
2016-09-17$129,900 261-char remark
Show marketing remark (261 chars)
Great family home in a convenient, central location. Three bedrooms on the main level, updated kitchen, nice living space on main level with lots of light. Large lower level family room space, storage and non-legal bedroom on the lower level. Nice big backyard.
ⓘ Source: listings_history table (triggers on properties + properties_extension) + one-shot
backfill from property_details.listing_events for pre-trigger history.
Tax reassessment forecast SD · Resets to sale price
- Current annual tax
- $2,920 · $243/mo
- Projected year-2 tax
- $2,920 · $243/mo
- Expected delta
- $0/yr ($0/mo · 0.0%)
ⓘ Screening estimate from a state-policy table — verify with the county assessor before closing.
Climate risk First Street
- Flood 1/10 Low FEMA zone X (shaded) · 0% chance over 30 yrs
- Wildfire 2/10 Low
- Heat 3/10 Moderate 7 d/yr ≥99°F today · 14 d/yr by 30 yrs out
- Wind 2/10 Low
- Air quality 2/10 Low 1 unhealthy d/yr today · 1 by 30 yrs out
Nearby sold comps map
Loading sold comps map…
Walkable amenities ~0.75 mi
Loading nearby amenities…
Taxation est. · year 1
- Rental income
- $20,359
- − Mortgage interest
- −$5,602
- − Property taxes
- −$2,920
- − Insurance
- −$500
- − Repairs & maintenance
- −$1,629
- − Management
- −$1,629
- − Depreciation
- −$2,909
- Taxable income
- $5,171
- Est. tax owed @ 24.0%
- −$1,241
- After-tax cash flow
- $5,129/yr
For passive investors: Depreciation is non-cash, so a rental often shows a tax loss while cash-flowing — sheltering income. Rental losses are passive: they offset passive income freely, and up to $25,000/yr can offset ordinary (W-2) income if you actively participate and your MAGI is under $100k (phasing out to $0 by $150k); unused losses carry forward. On sale, claimed depreciation is recaptured at up to 25%, and gains may owe capital-gains tax (a 1031 exchange can defer both). Figures are a year-1 estimate at your 24.0% rate — not tax advice; consult a CPA.
Schools (NCES district)
- District
- Sioux Falls School District 49-5
- NCES district ID
- 4666270
- Math proficiency
- 39% ▼ -4.00%
- Reading proficiency
- 48% ▼ -2.00%
- Median HH income
- $51,093
- Composite
- 37.47/100
- National rank
- #4407
- State rank
- #45 of 59 in SD
Livability — Sioux Falls
- Score
- 85/100
- State rank
- #3
- US rank
- #610
Category grades
Schools grade is shown separately in the Schools card above.
Census & demographics
- Census place
- Sioux Falls, SD
- County
- Minnehaha County · 191,523 people
- City population
- 207,623
- Metro
- Sioux Falls, SD
- Population (ZIP)
- 23,287
- Household income
- $77,292
- Rent vs Own
- Severe rent burden
- 631.0
Population outlook (Minnehaha County) Hauer SSP2
- Today (2025)
- 222,323 people
- By 2030
- 241,430 · +8.6%
- By 2040
- 281,643 · +26.7%
- By 2050
- 325,574 · +46.4%
- By 2075
- 469,313 · +111.1%
- By 2100
- 664,763 · +199.0%
Race, ethnicity, and origin ACS 2023
- Neighborhood character
- Predominantly White (86%)
- Race & ethnicity
- White 86% Two or more races 5% Black 4% Hispanic / Latino 3% Asian 2% Native American 2%
- Common ancestry
- Portuguese 16% Iranian 4% Lithuanian 3%
- Foreign-born
- 3% · Canada
- Languages at home
- 95% English-only · Spanish 2% Other Indo-European 1%
Political lean MEDSL · Minnehaha
- 2024 margin
- R (+12.7) · D 42.5% · R 55.2% · Other 2.4%
- 2008→2024 swing
- -13.4pp toward R · 2008: 0.7pp · 2024: -12.7pp
- All cycles
- 2024: R+12.7 2020: R+9.5 2016: R+14.6 2012: R+7.4 2008: D+0.7
Not yet ingested
- Civics
- —
Market trends
- HPI YoY
- ▼ -236.85%
- Current HPI
- 235.1948
- Rent YoY
- ▲ 5.25%
- Metro
- Sioux Falls, SD
- State GDP YoY
- ▲ 0.70%
- F500 in state
- 2
Industry mix (Fortune 500 HQ in SD)
| Industry | F500 HQs | Revenue |
|---|---|---|
| Utilities | 1 | $1B |
|
||
Price history
-23.0% since first listed4 events — show timeline
- 2026-06-16 Pending — REALTOR® Association of the Sioux Empire
- 2026-06-03 Listed $100,000 REALTOR® Association of the Sioux Empire
- 2016-12-19 Sold (Public Records) $127,500 Public Records
- 2016-09-17 Listed $129,900 REALTOR® Association of the Sioux Empire
Property tax history
+5.1%/yrLatest (2024): $2,920 · -8.0% YoY. Source: county tax records.
Cash-flow waterfall
monthlySold comps — $/sqft
last 12 mo · ≤1 miLoading sold comps…