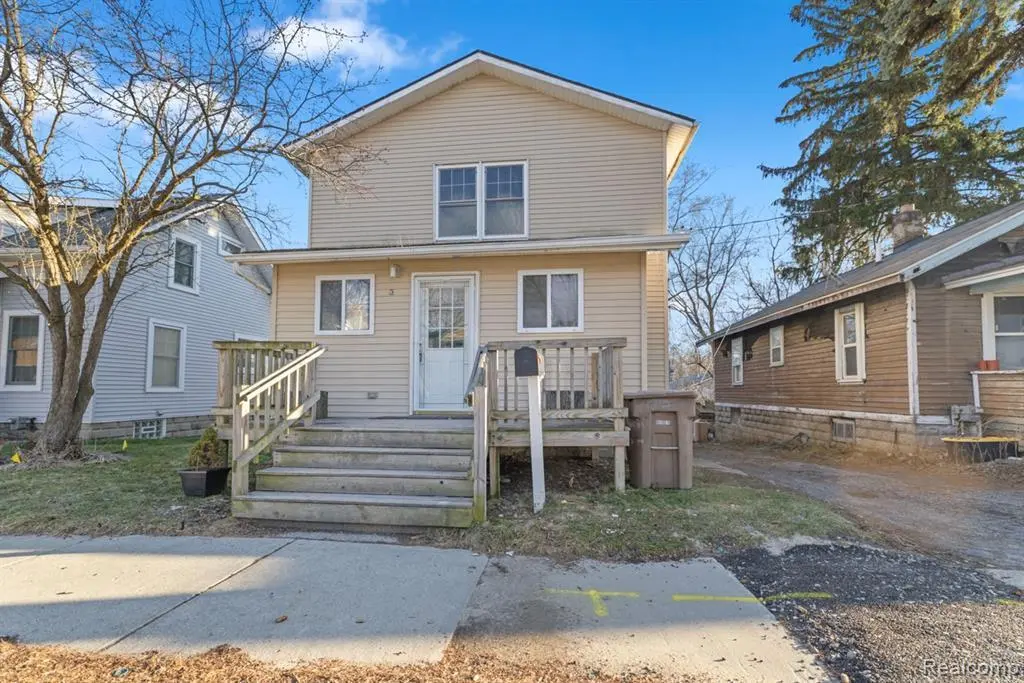
93 Poplar Ave · Pontiac, MI
Flood risk 1/10 · Minimal
- FEMA flood zone
- X (unshaded)
- Chance of flooding over 30 yrs
- 0.0%
- Est. flood insurance / yr
- $473 – $860
Fire risk 1/10 · Minimal
- Est. fire insurance / yr
- $784 – $1,456
Heat risk 2/10 · Minimal
- Hot days now (above 96°F)
- 7 days/yr
- Hot days in 30 yrs
- 15 days/yr
Wind risk 2/10 · Minimal
- Chance of severe wind over 30 yrs
- —
Air-quality risk 3/10 · Minor
- Unhealthy air days now
- 2 days/yr
- Unhealthy air days in 30 yrs
- 4 days/yr
Risk factors via First Street. Map © Google.
Why this score? — see what drove the B grade
The composite is a weighted blend of 9 inputs, each scored 0–100. Each bar is that input's sub-score; the figure is the points it added to the 100-point composite (weight × sub-score).
- Cash flow +30.0/30.0
- ARV discount +11.8/15.0
- DSCR +10.0/10.0
- 1% rule +9.8/10.0
- Livability +3.2/5.0
- Rent growth +2.5/5.0
- Condition / age +2.5/5.0
- Schools +1.0/10.0
- Appreciation +0.0/10.0
$125,000
🖨 Deal sheet 📄 Offer letter ✓ Due diligence
Listing remarks MLS
Welcome to this charming bungalow-style home in the heart of Pontiac! This well-maintained property features 3 comfortable bedrooms and 1.5 bathrooms, offering the perfect blend of functionality and cozy living. The home includes a full basement with a convenient walk-out door, providing additional space for storage, a workshop, or future finishing potential. Whether you're a first-time buyer, downsizing, or looking for a solid investment opportunity, this home delivers great value in a convenient location close to schools, shopping, and local amenities. Don't miss your chance to make this lovely home yours!
Key facts
- Walk out door
- Full basement
- Bungalow style
Tags
Neighborhood map
What this means for you Summary
Snapshot
- This is a 3-bed/1.5-bath single-family listed at $125k.
Deal economics
- At list price, monthly cash flow is $668 ($8k/yr) — positive.
- The deal already cash-flows at list — no discount required.
- Meets the 1% rule at list price ($2k rent vs $125k).
- Cap rate 12.7% vs local median 6.7% in Pontiac — top-decile yield for the area; either an underpriced asset or a hidden risk that comps aren't pricing in. Stress-test before assuming the spread holds.
Location & tenants
- Location reads 64/100 on livability (#499 in MI) — a middle-class / working-renter tenant base. Strengths: commute A+, cost of living A+, housing A+; Watch: health & safety D, schools F, crime F.
- Pontiac City School District (urban): math 8% / reading 17% proficiency, ranked #514 of 540 in MI (top 95%) — low school quality limits family demand, transient renter base, plan for 1-2y turnover; 81% free/reduced lunch — lower-income household profile, screen leases tightly.
- Market conditions: 87 active listings in the ZIP; 5 comparable units currently listed for rent nearby; rentals lingering (median 44d on market — plan ~5-8 weeks vacancy on turnover, expect pricing pressure); 60% of comp listings sitting > 30 days — soft ceiling on asking rent; 2,614 units permitted in Oakland County in 2024 (721 in 5+ unit buildings).
Forward outlook
- Local home prices are declining (-3.0%/yr); year-one equity from $864 of loan paydown is wiped out by about $4k of value loss. Plan a longer hold.
- Oakland County population projected at +10% by 2050 — modest demand growth; plan on rents tracking national, not racing it.
- At projected returns (-3.0% appreciation + 3.0% rent growth), your $35k cash investment doubles in ~6 years — after that, you're playing with house money.
Negotiation context
- Only 3 days on market — expect competitive offers; lowballing is unlikely to land.
- 2 sale attempts with the ask held roughly flat each time — persistent listings suggest the price (not the market) is what's stuck; bring a comps-based counter.
Risks & watch-outs
- Watch-outs: built in 1920 — expect roof / HVAC / electrical / plumbing capex.
Questions for the listing agent
- Built in 1920 — when were the roof, HVAC, electrical panel, plumbing, and water heater last replaced?
- Is there a deadline driving the sale (1031 exchange, divorce, estate, relocation)? That informs how much negotiation room exists.
- Schools are F-rated, which usually means shorter tenancies and higher turnover. Who's the typical renter profile here, and what's been the actual vacancy rate?
- Crime grade is F in this area — have there been break-ins, vandalism, or insurance claims at this property in the last 3 years? What carrier currently insures it and at what premium?
- What's the average days-on-market for RENTAL listings here right now (not sales)? A rising rental-DOM trend means longer vacancies and softer asking-rent achievability than the comps imply.
- What's the recent tenant-quality profile in this submarket — average credit score on applications, eviction rate, late-payment / NSF rate, and stable-employment percentage? A property-management company in the area should have these aggregated.
- How much new for-sale + rental construction is in the pipeline within 1–3 miles? Heavy new supply typically softens prices + rents 12–24 months out; constrained supply supports both.
Investment metrics
- 1% rule
- 1.48% ✓
- Cap rate
- 12.71%
- Cash-on-cash
- 22.90%
- DSCR
- 2.02
- GRM
- 5.6
CMA / ARV
- ARV (on-the-fly)
- $138,320
- Comps found
- 12
Show comp detail 12 sales within ~0.75 mi
| Address | Dist | Beds/Ba | Sqft | Sold | Price | $/sf | Match |
|---|---|---|---|---|---|---|---|
| 233 Baldwin Ave | 0.13mi | 3/2.0 | 1,817 (-0%) | 3mo | $50,000 | $28 | 89 |
| 68 Kimball St | 0.15mi | 3/2.0 | 1,564 (-14%) | 3mo | $141,000 | $90 | 65 |
| 29 Putnam Ave | 0.26mi | 4/1.0 (+1) | 1,913 (+5%) | 10mo | $84,900 | $44 | 64 |
| 163 Norton St | 0.63mi | 3/2.0 | 1,908 (+5%) | 2mo | $118,600 | $62 | 59 |
| 50 Lewis St | 0.29mi | 3/1.0 | 1,614 (-11%) | 10mo | $62,500 | $39 | 58 |
| 686 Lounsbury Ave | 0.70mi | 4/1.5 (+1) | 1,930 (+6%) | 1mo | $147,000 | $76 | 51 |
| 197 Beach St | 0.57mi | 4/2.0 (+1) | 1,851 (+2%) | 18mo | $140,000 | $76 | 49 |
| 86 Marquette St | 0.59mi | 3/2.0 | 1,985 (+9%) | 11mo | $175,000 | $88 | 46 |
| 47 Summit St | 0.37mi | 4/2.0 (+1) | 1,600 (-12%) | 14mo | $180,000 | $113 | 44 |
| 54 Nelson St | 0.46mi | 4/1.5 (+1) | 1,558 (-14%) | 12mo | $149,900 | $96 | 40 |
| 53 Oakhill St | 0.62mi | 3/2.0 | 1,641 (-10%) | 19mo | $161,000 | $98 | 37 |
| 100 Moreland Ave | 0.63mi | 3/1.0 | 1,644 (-10%) | 21mo | $70,000 | $43 | 35 |
Match score weights: distance 35% · size 25% · config 20% · recency 20%. Top-matched comps best support the ARV.
Projected returns pro-forma
-3.0% appreciation · 3.0% rent growth · sell at horizon
- IRR
- 15.8%
- Equity multiple
- 1.64×
- Total profit
- $22,277
- Equity at exit
- $18,638
- IRR
- 24.5%
- Equity multiple
- 3.12×
- Total profit
- $74,129
- Equity at exit
- $10,808
Cash invested: $35,000 (down + closing). Projections, not guarantees.
Landlord ↔ Tenant lean methodology
- Overall (STATE)
- 62 Landlord-Friendly
- State Michigan
- 62 Landlord-Friendly · EVEN
- County
- — inherits STATE
- City
- — inherits STATE
ZIP-level market 48342
- Home prices YoY
- -33.8%
- Active inventory
- 87
- Price-to-rent
- 5.6×
Monthly cashflow live
- Estimated rent
- $1,853 high interval (Pro) →
- Mortgage (P&I)
- −$656
- Tax from tax record
- −$89 /mo · $1,063/yr
- Insurance
- −$52
- HOA
- −$0
- Vacancy / Maint / Mgmt
- −$389
- Net cashflow
- $668
Break-even live
UW: 25.0% down · 7.5% · 30yr · 1.5% tax · 5.0% vac · 8.0% maint · 8.0% mgmt
Financing live
Cash to close
- Down payment
- $31,250
- Closing costs
- $3,750
- Reserves months
- —
- Total cash needed
- —
Loan-product check · same deal, 3 products live
Conventional
25% down · 7.5% · 30yr
- Down + closing
- —
- Monthly P&I
- —
- Monthly cashflow
- —
- DSCR
- —
- Eligible?
- —
Personal DTI + credit; lowest rate.
DSCR
20% down · 8.5% · 30yr
- Down + closing
- —
- Monthly P&I
- —
- Monthly cashflow
- —
- DSCR
- —
- Eligible?
- —
No personal income docs; deal must DSCR.
Hard money
10% down · 12.0% · 12mo
- Down + closing
- —
- Monthly P&I
- —
- Monthly cashflow
- —
- DSCR
- —
- Eligible?
- —
Short-term bridge; refi at stabilization.
Rent comps 5 comps
| Address | Beds | Baths | Sqft | Rent | $/sqft | DOM | Units | Dist |
|---|---|---|---|---|---|---|---|---|
| 90 Marquette St Pontiac, MI | 3.0 | 1.0 | 1886 | $1,800 | $0.95 | 43d | 1 | 0.57mi |
| 264 Nelson St Pontiac, MI | 3.0 | 1.0 | 1478 | $1,590 | $1.08 | 43d | 1 | 0.79mi |
| 21 N Saginaw St Pontiac, MI | 2.0 | 2.5 | 2500 | $2,500 | $1.00 | 1d | 1 | 0.92mi |
| 223 Tucker St Pontiac, MI | 2.0 | 2.5 | 1295 | $1,700 | $1.31 | 17d | 1 | 1.28mi |
| 107 N Sanford St Pontiac, MI | 4.0 | 1.5 | 1467 | $1,750 | $1.19 | 43d | 1 | 1.30mi |
Listing history 4 events
-
2026-03-23status Pending 615-char remark
Show marketing remark (615 chars)
Welcome to this charming bungalow-style home in the heart of Pontiac! This well-maintained property features 3 comfortable bedrooms and 1.5 bathrooms, offering the perfect blend of functionality and cozy living. The home includes a full basement with a convenient walk-out door, providing additional space for storage, a workshop, or future finishing potential. Whether you're a first-time buyer, downsizing, or looking for a solid investment opportunity, this home delivers great value in a convenient location close to schools, shopping, and local amenities. Don't miss your chance to make this lovely home yours!
-
2026-03-23status Pending
Show marketing remark (615 chars)
Welcome to this charming bungalow-style home in the heart of Pontiac! This well-maintained property features 3 comfortable bedrooms and 1.5 bathrooms, offering the perfect blend of functionality and cozy living. The home includes a full basement with a convenient walk-out door, providing additional space for storage, a workshop, or future finishing potential. Whether you're a first-time buyer, downsizing, or looking for a solid investment opportunity, this home delivers great value in a convenient location close to schools, shopping, and local amenities. Don't miss your chance to make this lovely home yours!
-
2026-03-20$125,000 Active 615-char remark
Show marketing remark (615 chars)
Welcome to this charming bungalow-style home in the heart of Pontiac! This well-maintained property features 3 comfortable bedrooms and 1.5 bathrooms, offering the perfect blend of functionality and cozy living. The home includes a full basement with a convenient walk-out door, providing additional space for storage, a workshop, or future finishing potential. Whether you're a first-time buyer, downsizing, or looking for a solid investment opportunity, this home delivers great value in a convenient location close to schools, shopping, and local amenities. Don't miss your chance to make this lovely home yours!
-
2026-03-20$125,000 Active
Show marketing remark (615 chars)
Welcome to this charming bungalow-style home in the heart of Pontiac! This well-maintained property features 3 comfortable bedrooms and 1.5 bathrooms, offering the perfect blend of functionality and cozy living. The home includes a full basement with a convenient walk-out door, providing additional space for storage, a workshop, or future finishing potential. Whether you're a first-time buyer, downsizing, or looking for a solid investment opportunity, this home delivers great value in a convenient location close to schools, shopping, and local amenities. Don't miss your chance to make this lovely home yours!
ⓘ Source: listings_history table (triggers on properties + properties_extension) + one-shot
backfill from property_details.listing_events for pre-trigger history.
Tax reassessment forecast MI · Partial reset (capped growth)
- Current annual tax
- $1,063 · $89/mo
- Projected year-2 tax
- $1,494 · $125/mo
- Expected delta
- +$431/yr (+$36/mo · 40.5%)
ⓘ Screening estimate from a state-policy table — verify with the county assessor before closing.
Climate risk First Street
- Flood 1/10 Low FEMA zone X (unshaded) · 0% chance over 30 yrs
- Wildfire 1/10 Low
- Heat 2/10 Low 7 d/yr ≥96°F today · 15 d/yr by 30 yrs out
- Wind 2/10 Low
- Air quality 3/10 Moderate 2 unhealthy d/yr today · 4 by 30 yrs out
Nearby sold comps map
Loading sold comps map…
Walkable amenities ~0.75 mi
Loading nearby amenities…
Taxation est. · year 1
- Rental income
- $22,241
- − Mortgage interest
- −$7,002
- − Property taxes
- −$1,063
- − Insurance
- −$625
- − Repairs & maintenance
- −$1,779
- − Management
- −$1,779
- − Depreciation
- −$3,636
- Taxable income
- $6,356
- Est. tax owed @ 24.0%
- −$1,525
- After-tax cash flow
- $6,491/yr
For passive investors: Depreciation is non-cash, so a rental often shows a tax loss while cash-flowing — sheltering income. Rental losses are passive: they offset passive income freely, and up to $25,000/yr can offset ordinary (W-2) income if you actively participate and your MAGI is under $100k (phasing out to $0 by $150k); unused losses carry forward. On sale, claimed depreciation is recaptured at up to 25%, and gains may owe capital-gains tax (a 1031 exchange can defer both). Figures are a year-1 estimate at your 24.0% rate — not tax advice; consult a CPA.
Schools (NCES district)
- District
- Pontiac City School District
- NCES district ID
- 2628740
- Math proficiency
- 8% ▼ -5.00%
- Reading proficiency
- 17% ▼ -3.00%
- Median HH income
- $33,888
- Composite
- 10.12/100
- National rank
- #9802
- State rank
- #514 of 540 in MI
Livability — Pontiac
- Score
- 64/100
- State rank
- #499
- US rank
- #14703
Category grades
Schools grade is shown separately in the Schools card above.
Census & demographics
- Census place
- Pontiac, MI
- City population
- 44,593
- Population (ZIP)
- 17,227
Population outlook (Oakland County) Hauer SSP2
- Today (2025)
- 1,335,747 people
- By 2030
- 1,375,100 · +2.9%
- By 2040
- 1,435,385 · +7.5%
- By 2050
- 1,469,250 · +10.0%
- By 2075
- 1,531,946 · +14.7%
- By 2100
- 1,450,485 · +8.6%
Race, ethnicity, and origin ACS 2023
- Neighborhood character
- Diverse neighborhood (Simpson 0.62)
- Race & ethnicity
- Black 57% Hispanic / Latino 19% White 13% Two or more races 13% Asian 4%
- Hispanic origin (detail)
- Mexican 11% Puerto Rican 2%
- Common ancestry
- Romanian 1% Lithuanian 1% Italian 1%
- Foreign-born
- 10% · Canada, Vietnam
- Languages at home
- 79% English-only · Spanish 15% Other Asian/Pacific 4% Other Indo-European 1%
Political lean MEDSL · Oakland
- 2024 margin
- D (+10.6) · D 54.4% · R 43.8% · Other 1.9%
- 2008→2024 swing
- -3.9pp toward R · 2008: 14.5pp · 2024: 10.6pp
- All cycles
- 2024: D+10.6 2020: D+14.1 2016: D+8.1 2012: D+8.1 2008: D+14.5
Not yet ingested
- Civics
- —
Market trends
- HPI YoY
- ▼ -109.18%
- Current HPI
- 214.3258
- Rent YoY
- —
- Metro
- —
- State GDP YoY
- ▲ 1.37%
- F500 in state
- 28
Industry mix (Fortune 500 HQ in MI)
| Industry | F500 HQs | Revenue |
|---|---|---|
| Automotive Parts | 3 | $48B |
|
||
| Automotive | 2 | $372B |
|
||
| Chemicals | 1 | $45B |
|
||
| Automotive Retail | 1 | $29B |
|
||
| Healthcare / Medical Devices | 1 | $23B |
|
||
| Automotive Technology | 1 | $20B |
|
||
Price history
+0.0% since first listed4 events — show timeline
- 2026-03-23 Pending — MiRealSource-MiMLS
- 2026-03-23 Pending — REALCOMP
- 2026-03-20 Listed $125,000 REALCOMP
- 2026-03-20 Listed $125,000 MiRealSource-MiMLS
Property tax history
+8.0%/yrLatest (2025): $1,063 · +2.7% YoY. Source: county tax records.
Cash-flow waterfall
monthlySold comps — $/sqft
last 12 mo · ≤1 miLoading sold comps…