 🏷️ Likely Rental
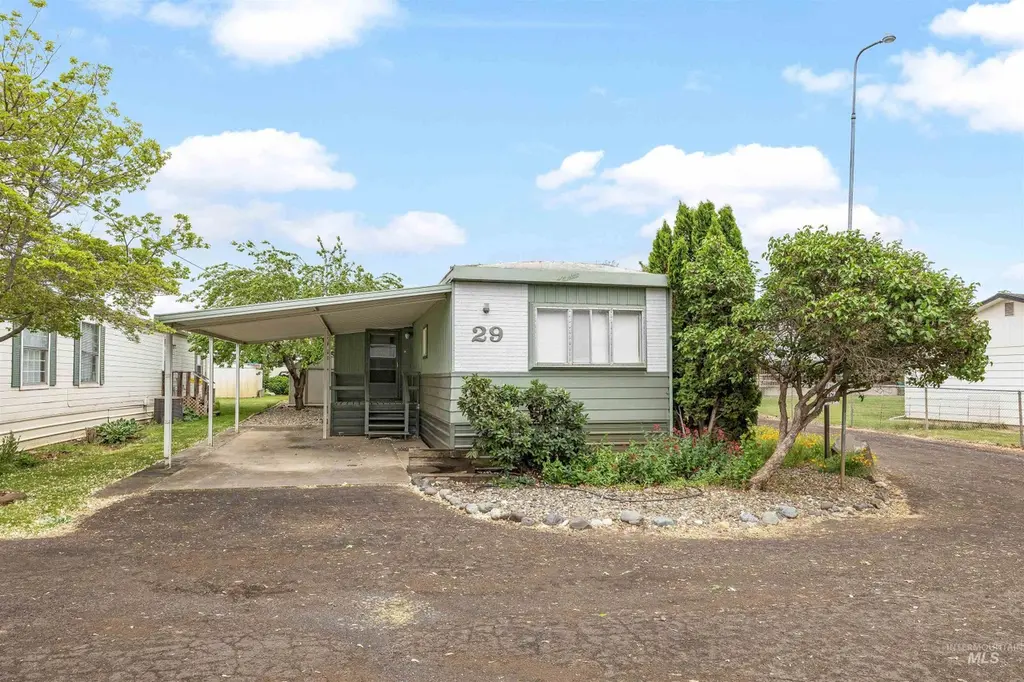
516 Park Ave #29 · Lewiston, ID
Flood risk 1/10 · Minimal
- FEMA flood zone
- X
- Chance of flooding over 30 yrs
- 0.0%
- Est. flood insurance / yr
- $507 – $1,088
Fire risk 4/10 · Minor
- Est. fire insurance / yr
- $584 – $1,086
Heat risk 4/10 · Minor
- Hot days now (above 98°F)
- 6 days/yr
- Hot days in 30 yrs
- 12 days/yr
Wind risk 1/10 · Minimal
- Chance of severe wind over 30 yrs
- —
Air-quality risk 8/10 · Major
- Unhealthy air days now
- 12 days/yr
- Unhealthy air days in 30 yrs
- 18 days/yr
Risk factors via First Street. Map © Google.
Why this score? — see what drove the B grade
The composite is a weighted blend of 9 inputs, each scored 0–100. Each bar is that input's sub-score; the figure is the points it added to the 100-point composite (weight × sub-score).
- Cash flow +30.0/30.0
- DSCR +10.0/10.0
- 1% rule +8.7/10.0
- ARV discount +7.5/15.0
- Appreciation +5.0/10.0
- Schools +4.2/10.0
- Livability +3.8/5.0
- Rent growth +2.5/5.0
- Condition / age +2.5/5.0
$74,500
🖨 Deal sheet 📄 Offer letter ✓ Due diligence
Listing remarks
Cute and clean 2 bed, 2 bath manufactured home located in a well-kept 55+ park. The bright living room has a tip-out that gives the home extra space and an open feel, and the new windows throughout let in tons of natural light. Outside you’ll find a covered carport and a large storage shed with plenty of room for storage or hobbies. New 40 gallon hot water heater! Lot rent is $430/month and includes water, sewer, and garbage. Easy, low-maintenance living in a quiet and friendly community.
Key facts
- Covered carport
- Bright living room
- Large storage shed
Tags
Property features AI
Exterior
- Parking: Covered carport (1 space)
- Utilities: City water service; Sewer connected
- Home design: Mobile/manufactured home on rented lot; Built in 1975
- Construction: Frame construction
- Exterior features: Corner lot
Interior
- Kitchen: Dishwasher; Microwave; Oven/Range (freestanding); Refrigerator; Electric water heater
- Bedrooms: 2 bedrooms on the main level
- Flooring: Carpet; Vinyl
- Bathrooms: 2 bathrooms
- Heating & cooling: Electric heating; Central air conditioning
- Interior features: Main-level living room; Main-level kitchen
- Laundry & utility: Washer; Dryer
Neighborhood map
What this means for you Summary
Snapshot
- This is a 2-bed/2.0-bath single-family listed at $74k.
Deal economics
- At list price, monthly cash flow is $290 ($3k/yr) — positive.
- The deal already cash-flows at list — no discount required.
- Meets the 1% rule at list price ($1k rent vs $74k).
- Recommended offer: $72k (3.0% below list) — sets the bar for market timing.
- Cap rate 11.0% vs local median 1.9% in Lewiston — top-decile yield for the area; either an underpriced asset or a hidden risk that comps aren't pricing in. Stress-test before assuming the spread holds.
Location & tenants
- Location reads 75/100 on livability (#30 in ID, #4,281 nationally) — a middle-class / working-renter tenant base. Strengths: housing A+, health & safety A+, cost of living A; Watch: amenities F, commute F.
- Lewiston Independent District (urban): math 44% / reading 54% proficiency, ranked #37 of 92 in ID (top 40%) — families likely to look elsewhere, expect single-tenant / working-renter base with shorter leases.
- Zoned schools: Orchards Elementary School (math 52% / reading 57%, grade C, #106 of 357 statewide, top 33%, 276 students, 40% FRL); Lewiston High School (math 37% / reading 63%, grade D+, #39 of 169 statewide, top 23%, 1,373 students, 17% FRL) — zoned schools at 29% FRL track the district average.
- Market conditions: 3 active listings in the ZIP; 1 comparable units currently listed for rent nearby; 125 units permitted in Nez Perce County in 2024 (0 in 5+ unit buildings).
Forward outlook
- In year one you build about $3k of equity ($515 loan paydown + $2k appreciation (3.0% local appreciation)).
- Nez Perce County population projected at +12% by 2050 — modest demand growth; plan on rents tracking national, not racing it.
- At projected returns (3.0% appreciation + 3.0% rent growth), your $21k cash investment doubles in ~4 years — after that, you're playing with house money.
Negotiation context
- It's been on market 36 days — a 3% lower offer ($72k) is reasonable based on typical stale-listing flexibility.
Questions for the listing agent
- It's been on market 36 days. Have you received any prior offers? Is the seller open to a 3% concession, seller financing, or rate buy-down credit?
- Built in 1975 — when were the roof, HVAC, electrical panel, plumbing, and water heater last replaced?
- Is there a deadline driving the sale (1031 exchange, divorce, estate, relocation)? That informs how much negotiation room exists.
- What's the average days-on-market for RENTAL listings here right now (not sales)? A rising rental-DOM trend means longer vacancies and softer asking-rent achievability than the comps imply.
- What's the recent tenant-quality profile in this submarket — average credit score on applications, eviction rate, late-payment / NSF rate, and stable-employment percentage? A property-management company in the area should have these aggregated.
- How much new for-sale + rental construction is in the pipeline within 1–3 miles? Heavy new supply typically softens prices + rents 12–24 months out; constrained supply supports both.
Investment metrics
- 1% rule
- 1.37% ✓
- Cap rate
- 10.96%
- Cash-on-cash
- 16.67%
- DSCR
- 1.74
- GRM
- 6.1
CMA / ARV
- ARV (on-the-fly)
- $318,680
- Comps found
- 12
Show comp detail 12 sales within ~0.75 mi
| Address | Dist | Beds/Ba | Sqft | Sold | Price | $/sf | Match |
|---|---|---|---|---|---|---|---|
| 433 Park Ave | 0.14mi | 3/1.0 (+1) | 960 (-7%) | 2mo | $298,000 | $310 | 72 |
| 617 Warner | 0.28mi | 2/1.0 | 1,018 (-1%) | 12mo | $297,000 | $292 | 72 |
| 427 Linden Ave | 0.28mi | 2/1.0 | 968 (-6%) | 9mo | $299,900 | $310 | 66 |
| 607 Preston Ave | 0.25mi | 2/1.0 | 960 (-7%) | 11mo | $299,500 | $312 | 64 |
| 3232 6th Street D | 0.28mi | 2/1.5 | 920 (-10%) | 13mo | $300,000 | $326 | 56 |
| 630 Preston #d | 0.36mi | 2/1.0 | 912 (-11%) | 12mo | $275,900 | $303 | 50 |
| 523 Burrell Ave | 0.59mi | 2/1.0 | 936 (-9%) | 6mo | $339,000 | $362 | 49 |
| 811 Preston Ave | 0.74mi | 2/1.0 | 972 (-5%) | 13mo | $298,000 | $307 | 42 |
| 3233 8th St | 0.67mi | 3/1.0 (+1) | 1,084 (+5%) | 11mo | $349,000 | $322 | 41 |
| 3127 7th St C | 0.57mi | 2/1.0 | 884 (-14%) | 6mo | $269,000 | $304 | 41 |
| 811 Park Dr | 0.73mi | 3/1.0 (+1) | 1,128 (+10%) | 4mo | $309,000 | $274 | 38 |
| 1537 24th Ave | 0.72mi | 2/2.0 | 1,158 (+13%) | 14mo | $359,000 | $310 | 34 |
Match score weights: distance 35% · size 25% · config 20% · recency 20%. Top-matched comps best support the ARV.
Projected returns pro-forma
3.0% appreciation · 3.0% rent growth · sell at horizon
- IRR
- 23.2%
- Equity multiple
- 2.32×
- Total profit
- $27,445
- Equity at exit
- $33,498
- IRR
- 24.1%
- Equity multiple
- 4.45×
- Total profit
- $71,871
- Equity at exit
- $51,625
Cash invested: $20,860 (down + closing). Projections, not guarantees.
Landlord ↔ Tenant lean methodology
- Overall (STATE)
- 91 Strongly Landlord-Friendly
- State Idaho
- 91 Strongly Landlord-Friendly · R+18
- County
- — inherits STATE
- City
- — inherits STATE
ZIP-level market 83501-0000
- Active inventory
- 3
- Price-to-rent
- 6.1×
Monthly cashflow live
- Estimated rent
- $1,018 medium interval (Pro) →
- Mortgage (P&I)
- −$391
- Tax est. 1.5%
- −$93 /mo · $1,118/yr
- Insurance
- −$31
- HOA
- −$0
- Vacancy / Maint / Mgmt
- −$214
- Net cashflow
- $290
Break-even live
UW: 25.0% down · 7.5% · 30yr · 1.5% tax · 5.0% vac · 8.0% maint · 8.0% mgmt
Financing live
Cash to close
- Down payment
- $18,625
- Closing costs
- $2,235
- Reserves months
- —
- Total cash needed
- —
Loan-product check · same deal, 3 products live
Conventional
25% down · 7.5% · 30yr
- Down + closing
- —
- Monthly P&I
- —
- Monthly cashflow
- —
- DSCR
- —
- Eligible?
- —
Personal DTI + credit; lowest rate.
DSCR
20% down · 8.5% · 30yr
- Down + closing
- —
- Monthly P&I
- —
- Monthly cashflow
- —
- DSCR
- —
- Eligible?
- —
No personal income docs; deal must DSCR.
Hard money
10% down · 12.0% · 12mo
- Down + closing
- —
- Monthly P&I
- —
- Monthly cashflow
- —
- DSCR
- —
- Eligible?
- —
Short-term bridge; refi at stabilization.
Rent comps 1 comps
| Address | Beds | Baths | Sqft | Rent | $/sqft | DOM | Units | Dist |
|---|---|---|---|---|---|---|---|---|
| 2937 Magnolia St Lewiston, ID | 2.0 | 1.0 | 893 | $1,018 | $1.14 | 43d | 1 | 1.07mi |
Listing history 17 events
-
2026-06-19days on market $74,500 Active 36 DOM
-
2026-06-18days on market $74,500 Active 35 DOM
-
2026-06-17days on market $74,500 Active 34 DOM
-
2026-06-16days on market $74,500 Active 33 DOM
-
2026-06-15days on market $74,500 Active 32 DOM
-
2026-06-14remarks 493-char remark
-
2026-06-14pricedays on market $74,500 Active 30 DOM
-
2026-06-12days on market $79,500 Active 29 DOM
-
2026-06-09days on market $79,500 Active 26 DOM
-
2026-06-08days on market $79,500 Active 25 DOM
-
2026-06-07days on market $79,500 Active 24 DOM
-
2026-06-03days on market $79,500 Active 20 DOM
-
2026-06-02days on market $79,500 Active 19 DOM
-
2026-06-01days on market $79,500 Active 18 DOM
-
2026-05-31days on market $79,500 Active 17 DOM
-
2026-05-30days on market $79,500 Active 16 DOM
-
2026-05-14$79,500 Active
ⓘ Source: listings_history table (triggers on properties + properties_extension) + one-shot
backfill from property_details.listing_events for pre-trigger history.
Climate risk First Street
- Flood 1/10 Low FEMA zone X · 0% chance over 30 yrs
- Wildfire 4/10 Moderate
- Heat 4/10 Moderate 6 d/yr ≥98°F today · 12 d/yr by 30 yrs out
- Wind 1/10 Low
- Air quality 8/10 Severe 12 unhealthy d/yr today · 18 by 30 yrs out
Nearby sold comps map
Loading sold comps map…
Walkable amenities ~0.75 mi
Loading nearby amenities…
Taxation est. · year 1
- Rental income
- $12,222
- − Mortgage interest
- −$4,173
- − Property taxes
- −$1,118
- − Insurance
- −$372
- − Repairs & maintenance
- −$978
- − Management
- −$978
- − Depreciation
- −$2,167
- Taxable income
- $2,436
- Est. tax owed @ 24.0%
- −$585
- After-tax cash flow
- $2,892/yr
For passive investors: Depreciation is non-cash, so a rental often shows a tax loss while cash-flowing — sheltering income. Rental losses are passive: they offset passive income freely, and up to $25,000/yr can offset ordinary (W-2) income if you actively participate and your MAGI is under $100k (phasing out to $0 by $150k); unused losses carry forward. On sale, claimed depreciation is recaptured at up to 25%, and gains may owe capital-gains tax (a 1031 exchange can defer both). Figures are a year-1 estimate at your 24.0% rate — not tax advice; consult a CPA.
Schools (NCES district)
- District
- Lewiston Independent District
- NCES district ID
- 1601860
- Math proficiency
- 44% ▬ 0.00%
- Reading proficiency
- 54% ▬ 0.00%
- Median HH income
- $47,224
- Composite
- 41.65/100
- National rank
- #3423
- State rank
- #37 of 92 in ID
Livability — Lewiston
- Score
- 75/100
- State rank
- #30
- US rank
- #4281
Category grades
Schools grade is shown separately in the Schools card above.
Census & demographics
- Census place
- Lewiston, ID
Population outlook (Nez Perce County) Hauer SSP2
- Today (2025)
- 42,583 people
- By 2030
- 43,754 · +2.7%
- By 2040
- 45,907 · +7.8%
- By 2050
- 47,819 · +12.3%
- By 2075
- 53,100 · +24.7%
- By 2100
- 55,971 · +31.4%
Not yet ingested
- Political lean
- —
- Race & ethnicity
- —
- Common origin
- —
- Civics
- —
Market trends
- HPI YoY
- —
- Current HPI
- —
- Rent YoY
- —
- Metro
- —
- State GDP YoY
- ▲ 4.51%
- F500 in state
- 6
Industry mix (Fortune 500 HQ in ID)
| Industry | F500 HQs | Revenue |
|---|---|---|
| Retail | 1 | $79B |
|
||
| Technology | 1 | $25B |
|
||
| Food / Agriculture | 1 | $6B |
|
||
Price history
1 event — show timeline
- 2026-05-14 Listed $79,500 IMLS
Property tax history
+6.4%/yrLatest (2019): $135 · +10.8% YoY. Source: county tax records.
Cash-flow waterfall
monthlySold comps — $/sqft
last 12 mo · ≤1 miLoading sold comps…