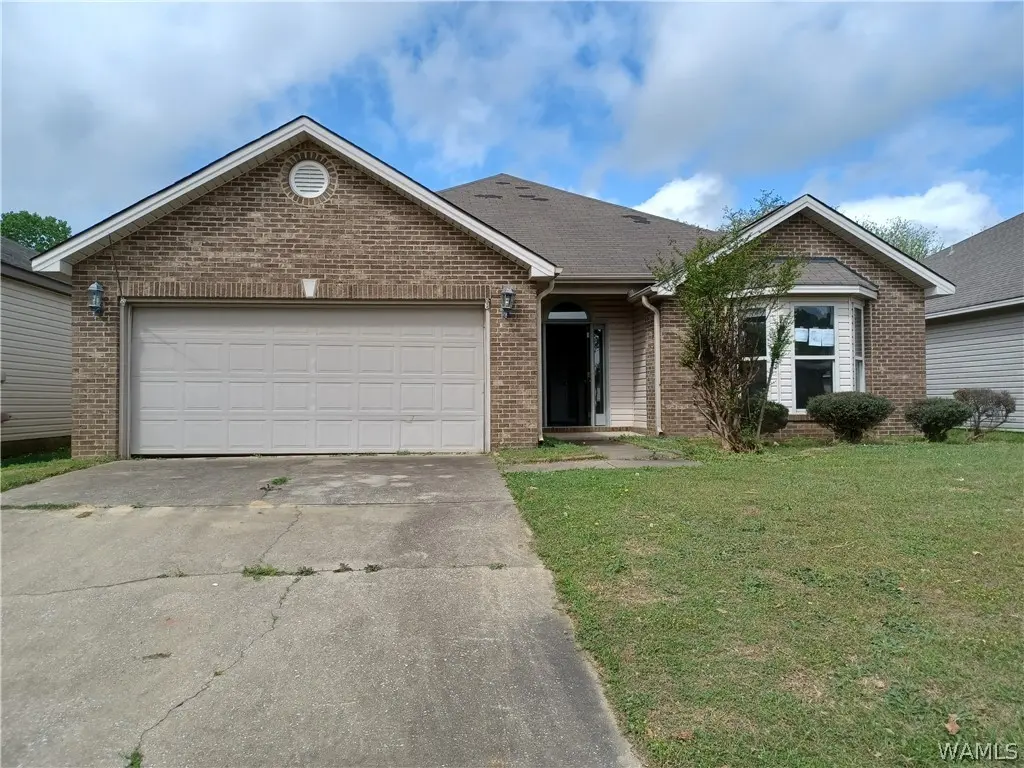
9930 Lenox Cir · Tuscaloosa, AL
Flood risk 1/10 · Minimal
- FEMA flood zone
- X (unshaded)
- Chance of flooding over 30 yrs
- 0.0%
- Est. flood insurance / yr
- $507 – $1,088
Fire risk 4/10 · Minor
- Est. fire insurance / yr
- $916 – $1,700
Heat risk 8/10 · Major
- Hot days now (above 108°F)
- 7 days/yr
- Hot days in 30 yrs
- 22 days/yr
Wind risk 6/10 · Moderate
- Chance of severe wind over 30 yrs
- 59.0%
Air-quality risk 1/10 · Minimal
- Unhealthy air days now
- 0 days/yr
- Unhealthy air days in 30 yrs
- 0 days/yr
Risk factors via First Street. Map © Google.
Why this score? — see what drove the D+ grade
The composite is a weighted blend of 9 inputs, each scored 0–100. Each bar is that input's sub-score; the figure is the points it added to the 100-point composite (weight × sub-score).
- ARV discount +14.8/15.0
- Cash flow +14.5/30.0
- DSCR +4.4/10.0
- Rent growth +3.9/5.0
- Livability +3.9/5.0
- Schools +2.9/10.0
- 1% rule +2.8/10.0
- Condition / age +2.5/5.0
- Appreciation +0.0/10.0
$223,000
🖨 Deal sheet 📄 Offer letter ✓ Due diligence
Listing remarks MLS
Charming home located in a well-established neighborhood in Tuscaloosa. This property offers a functional layout with comfortable living spaces and plenty of natural light throughout. The kitchen provides ample cabinet and counter space, making it ideal for everyday living and entertaining. The primary suite offers privacy and convenience, while additional bedrooms provide flexibility for family, guests, or a home office. Outside, enjoy a spacious yard with room to relax or create your own outdoor retreat. Conveniently located near shopping, dining, and major roadways, this home offers both comfort and accessibility.
Key facts
- 6,534 sq ft lot
- 2 garage spots
- Built 2007
Neighborhood map
What this means for you Summary
Snapshot
- This is a 3-bed/2.0-bath single-family listed at $223k.
Deal economics
- At list price, monthly cash flow is $47 ($565/yr) — positive.
- The deal already cash-flows at list — no discount required.
- To meet the 1% rule (rent ≥ 1% of price), the offer needs to be $174k (21.8% below list).
- Recommended offer: $174k (21.8% below list) — sets the bar for 1% rule.
- Cap rate 6.5% vs local median 3.4% in Tuscaloosa — top-decile yield for the area; either an underpriced asset or a hidden risk that comps aren't pricing in. Stress-test before assuming the spread holds.
Location & tenants
- Location reads 77/100 on livability (#9 in AL, #2,909 nationally) — a middle-class / working-renter tenant base. Strengths: amenities A+, health & safety A+, cost of living A; Watch: crime F, employment D-.
- Tuscaloosa County (suburban): math 21% / reading 45% proficiency, ranked #47 of 129 in AL (top 36%) — families likely to look elsewhere, expect single-tenant / working-renter base with shorter leases.
- Market conditions: Rents rising fast (+5.4%/yr); 457 active listings in the ZIP; 10 comparable units currently listed for rent nearby; rentals lingering (median 44d on market — plan ~5-8 weeks vacancy on turnover, expect pricing pressure); 80% of comp listings sitting > 30 days — soft ceiling on asking rent; 622 units permitted in Tuscaloosa County in 2024 (69 in 5+ unit buildings).
- This rent runs 34% of the median local income ($62k/yr) — at the standard rent-burdened threshold; future hikes will face affordability resistance.
Forward outlook
- Local home prices are declining (-3.0%/yr); year-one equity from $2k of loan paydown is wiped out by about $7k of value loss. Plan a longer hold.
- Tuscaloosa County population projected at +26% by 2050 — long-run rental-demand tailwind backs the buy-and-hold thesis.
Negotiation context
- It's been on market 40 days — a 3% lower offer ($216k) is reasonable based on typical stale-listing flexibility.
- 6 sale attempts since 13y ago with the ask held roughly flat each time — persistent listings suggest the price (not the market) is what's stuck; bring a comps-based counter.
- Current owner paid $166k; 34% above their basis — modest negotiation headroom, anchor on the comps not their cost.
Risks & watch-outs
- Climate carrying-cost: major wind risk, 59% chance of damaging wind over 30y; extreme-heat days projected 7→22/yr by 2055 (HVAC capex compounding) — expect insurance premiums to compound above CPI over the hold.
Questions for the listing agent
- It's been on market 40 days. Have you received any prior offers? Is the seller open to a 22% concession, seller financing, or rate buy-down credit?
- What does the HOA fee cover, when was the last increase, and are there any pending special assessments or reserve-fund shortfalls?
- Is there a deadline driving the sale (1031 exchange, divorce, estate, relocation)? That informs how much negotiation room exists.
- Crime grade is F in this area — have there been break-ins, vandalism, or insurance claims at this property in the last 3 years? What carrier currently insures it and at what premium?
- The area grade is low — what's the realistic commute time and amenity access for the typical tenant pool here? Any planned neighborhood developments (good or bad) we should know about?
- What's the average days-on-market for RENTAL listings here right now (not sales)? A rising rental-DOM trend means longer vacancies and softer asking-rent achievability than the comps imply.
- What's the recent tenant-quality profile in this submarket — average credit score on applications, eviction rate, late-payment / NSF rate, and stable-employment percentage? A property-management company in the area should have these aggregated.
- How much new for-sale + rental construction is in the pipeline within 1–3 miles? Heavy new supply typically softens prices + rents 12–24 months out; constrained supply supports both.
Investment metrics
- 1% rule
- 0.78% ✗
- Cap rate
- 6.55%
- Cash-on-cash
- 0.90%
- DSCR
- 1.04
- GRM
- 10.7
CMA / ARV
- ARV (median comp)
- $266,133
- List price
- $223,000
- Delta
- -16.21%
- Verdict
- UNDERPRICED
- Comps
- 20 within 1.0 mi
Show comp detail 12 sales within ~0.75 mi
| Address | Dist | Beds/Ba | Sqft | Sold | Price | $/sf | Match |
|---|---|---|---|---|---|---|---|
| 10408 Patton Ln | 0.37mi | 4/2.0 (+1) | 1,852 (+3%) | 1mo | $264,610 | $143 | 72 |
| 1910 Collier Way | 0.55mi | 3/2.0 | 1,874 (+4%) | 1mo | $295,000 | $157 | 66 |
| 2101 Lenox Dr | 0.17mi | 3/2.0 | 1,540 (-14%) | 3mo | $220,000 | $143 | 66 |
| 2325 Alexander Dr | 0.28mi | 3/2.0 | 1,593 (-11%) | 3mo | $247,000 | $155 | 65 |
| 10493 Covey Rise Cir | 0.48mi | 3/2.0 | 1,999 (+11%) | 2mo | $310,000 | $155 | 58 |
| 1252 Maxwell Cir | 0.46mi | 3/2.0 | 1,557 (-13%) | 3mo | $239,900 | $154 | 54 |
| 2288 Stone Ave | 0.43mi | 4/2.0 (+1) | 1,613 (-10%) | 5mo | $272,000 | $169 | 54 |
| 2050 Waterford Ln | 0.73mi | 3/2.0 | 1,667 (-7%) | 3mo | $263,000 | $158 | 52 |
| 2239 Stone Ave | 0.56mi | 4/2.0 (+1) | 1,613 (-10%) | 5mo | $269,900 | $167 | 48 |
| 2709 Englewood Dr | 0.58mi | 3/2.5 | 2,040 (+14%) | 2mo | $324,900 | $159 | 47 |
| 10409 Patton Ln | 0.51mi | 4/2.0 (+1) | 1,559 (-13%) | 4mo | $266,800 | $171 | 46 |
| 10401 Alex Ct | 0.61mi | 4/2.0 (+1) | 1,559 (-13%) | 1mo | $270,756 | $174 | 43 |
Match score weights: distance 35% · size 25% · config 20% · recency 20%. Top-matched comps best support the ARV.
Projected returns pro-forma
-3.0% appreciation · 5.42% rent growth · sell at horizon
- IRR
- -12.6%
- Equity multiple
- 0.54×
- Total profit
- $-28,892
- Equity at exit
- $33,250
- IRR
- -0.6%
- Equity multiple
- 0.95×
- Total profit
- $-2,964
- Equity at exit
- $19,281
Cash invested: $62,440 (down + closing). Projections, not guarantees.
Landlord ↔ Tenant lean methodology
- Overall (STATE)
- 90 Strongly Landlord-Friendly
- State Alabama
- 90 Strongly Landlord-Friendly · R+15
- County
- — inherits STATE
- City
- — inherits STATE
ZIP-level market 35405
- Home prices YoY
- -26.9%
- Rents YoY
- 5.4%
- Active inventory
- 457
- Price-to-rent
- 10.7×
Monthly cashflow live
- Estimated rent
- $1,744 high interval (Pro) →
- Mortgage (P&I)
- −$1,169
- Tax from tax record
- −$53 /mo · $639/yr
- Insurance
- −$93
- HOA
- −$15
- Vacancy / Maint / Mgmt
- −$366
- Net cashflow
- $47
Break-even live
UW: 25.0% down · 7.5% · 30yr · 1.5% tax · 5.0% vac · 8.0% maint · 8.0% mgmt
Financing live
Cash to close
- Down payment
- $55,750
- Closing costs
- $6,690
- Reserves months
- —
- Total cash needed
- —
Loan-product check · same deal, 3 products live
Conventional
25% down · 7.5% · 30yr
- Down + closing
- —
- Monthly P&I
- —
- Monthly cashflow
- —
- DSCR
- —
- Eligible?
- —
Personal DTI + credit; lowest rate.
DSCR
20% down · 8.5% · 30yr
- Down + closing
- —
- Monthly P&I
- —
- Monthly cashflow
- —
- DSCR
- —
- Eligible?
- —
No personal income docs; deal must DSCR.
Hard money
10% down · 12.0% · 12mo
- Down + closing
- —
- Monthly P&I
- —
- Monthly cashflow
- —
- DSCR
- —
- Eligible?
- —
Short-term bridge; refi at stabilization.
Rent comps 10 comps
| Address | Beds | Baths | Sqft | Rent | $/sqft | DOM | Units | Dist |
|---|---|---|---|---|---|---|---|---|
| 1451 Maxwell Cir Tuscaloosa, AL | 4.0 | 2.0 | 1498 | $1,745 | $1.16 | 21d | 1 | 0.38mi |
| 9717 Full Moon Cir Tuscaloosa, AL | 3.0 | 2.0 | 1278 | $1,550 | $1.21 | 13d | 1 | 0.39mi |
| 9295 Havenridge Loop Tuscaloosa, AL | 4.0 | 2.0 | 1583 | $1,745 | $1.10 | 44d | 1 | 0.92mi |
| 9594 Havenridge Loop Tuscaloosa, AL | 3.0 | 2.0 | 1679 | $1,795 | $1.07 | 44d | 1 | 1.06mi |
| 9588 Havenridge Loop Tuscaloosa, AL | 4.0 | 2.0 | 1961 | $1,885 | $0.96 | 44d | 1 | 1.07mi |
| 9582 Havenridge Loop Tuscaloosa, AL | 4.0 | 2.0 | 1961 | $1,885 | $0.96 | 44d | 1 | 1.07mi |
| 9576 Havenridge Loop Tuscaloosa, AL | 3.0 | 2.0 | 1493 | $1,795 | $1.20 | 44d | 1 | 1.08mi |
| 9230 Parkway Gardens Loop Tuscaloosa, AL | 4.0 | 2.0 | 1774 | $1,995 | $1.12 | 44d | 1 | 1.15mi |
| 9212 Parkway Gardens Loop Tuscaloosa, AL | 4.0 | 2.0 | 1774 | $1,796 | $1.01 | 44d | 1 | 1.17mi |
| 9332 Parkway Gardens Loop Tuscaloosa, AL | 4.0 | 2.0 | 1497 | $1,706 | $1.14 | 44d | 1 | 1.27mi |
HOA detail
- Monthly dues
- $15 · $180/yr
Listing history 12 events
-
2026-04-10$223,000 Active 624-char remark
Show marketing remark (624 chars)
Charming home located in a well-established neighborhood in Tuscaloosa. This property offers a functional layout with comfortable living spaces and plenty of natural light throughout. The kitchen provides ample cabinet and counter space, making it ideal for everyday living and entertaining. The primary suite offers privacy and convenience, while additional bedrooms provide flexibility for family, guests, or a home office. Outside, enjoy a spacious yard with room to relax or create your own outdoor retreat. Conveniently located near shopping, dining, and major roadways, this home offers both comfort and accessibility.
-
2024-12-19status Active
-
2024-11-07status Pending
-
2024-07-24status Active
-
2024-06-17status Pending
-
2024-02-20$239,900 Active
-
2016-12-13soldstatus $165,900
-
2016-12-13soldstatus $165,900
-
2016-09-14$169,900
-
2013-11-21soldstatus $160,000
-
2013-06-26$167,000
-
2007-10-04soldstatus $152,900
ⓘ Source: listings_history table (triggers on properties + properties_extension) + one-shot
backfill from property_details.listing_events for pre-trigger history.
Tax reassessment forecast AL · Resets to sale price
- Current annual tax
- $639 · $53/mo
- Projected year-2 tax
- $914 · $76/mo
- Expected delta
- +$275/yr (+$23/mo · 43.0%)
ⓘ Screening estimate from a state-policy table — verify with the county assessor before closing.
Climate risk First Street
- Flood 1/10 Low FEMA zone X (unshaded) · 0% chance over 30 yrs
- Wildfire 4/10 Moderate
- Heat 8/10 Severe 7 d/yr ≥108°F today · 22 d/yr by 30 yrs out
- Wind 6/10 Major 59% chance of damaging wind over 30 yrs
- Air quality 1/10 Low 0 unhealthy d/yr today · 0 by 30 yrs out
Nearby sold comps map
Loading sold comps map…
Walkable amenities ~0.75 mi
Loading nearby amenities…
Taxation est. · year 1
- Rental income
- $20,927
- − Mortgage interest
- −$12,491
- − Property taxes
- −$639
- − Insurance
- −$1,115
- − Repairs & maintenance
- −$1,674
- − Management
- −$1,674
- − HOA
- −$180
- − Depreciation
- −$6,487
- Taxable loss
- −$3,334
- Est. tax savings @ 24.0%
- +$800
- After-tax cash flow
- $1,365/yr
For passive investors: Depreciation is non-cash, so a rental often shows a tax loss while cash-flowing — sheltering income. Rental losses are passive: they offset passive income freely, and up to $25,000/yr can offset ordinary (W-2) income if you actively participate and your MAGI is under $100k (phasing out to $0 by $150k); unused losses carry forward. On sale, claimed depreciation is recaptured at up to 25%, and gains may owe capital-gains tax (a 1031 exchange can defer both). Figures are a year-1 estimate at your 24.0% rate — not tax advice; consult a CPA.
Schools (NCES district)
- District
- Tuscaloosa County
- NCES district ID
- 0103390
- Math proficiency
- 21% ▼ -24.00%
- Reading proficiency
- 45% ▲ 2.00%
- Median HH income
- $53,000
- Composite
- 28.88/100
- National rank
- #6641
- State rank
- #47 of 129 in AL
Livability — Tuscaloosa
- Score
- 77/100
- State rank
- #9
- US rank
- #2909
Category grades
Schools grade is shown separately in the Schools card above.
Census & demographics
- County
- Tuscaloosa County · 206,491 people
- City population
- 134,228
- Metro
- Tuscaloosa, AL
- Population (ZIP)
- 49,420
- Household income
- $62,301
- Rent vs Own
- Severe rent burden
- 1963.0
Population outlook (Tuscaloosa County) Hauer SSP2
- Today (2025)
- 228,293 people
- By 2030
- 240,551 · +5.4%
- By 2040
- 263,856 · +15.6%
- By 2050
- 286,491 · +25.5%
- By 2075
- 335,783 · +47.1%
- By 2100
- 370,520 · +62.3%
Race, ethnicity, and origin ACS 2023
- Neighborhood character
- Diverse neighborhood (Simpson 0.56)
- Race & ethnicity
- Black 56% White 35% Hispanic / Latino 5% Two or more races 3% Asian 2%
- Hispanic origin (detail)
- Mexican 2%
- Common ancestry
- Italian 1% Lithuanian 1% Slovak 1%
- Foreign-born
- 5% · Canada, China
- Languages at home
- 94% English-only · Spanish 4% Other Indo-European 1% Chinese 1%
Political lean MEDSL · Tuscaloosa
- 2024 margin
- Strong R (+20.4) · D 39.4% · R 59.8%
- 2008→2024 swing
- -4.4pp toward R · 2008: -16.0pp · 2024: -20.4pp
- All cycles
- 2024: R+20.4 2020: R+14.8 2016: R+19.5 2012: R+17.4 2008: R+16.0
Not yet ingested
- Civics
- —
Market trends
- HPI YoY
- ▼ -71.25%
- Current HPI
- 193.1929
- Rent YoY
- ▲ 5.42%
- Metro
- Tuscaloosa, AL
- State GDP YoY
- ▲ 2.94%
- F500 in state
- 4
Industry mix (Fortune 500 HQ in AL)
| Industry | F500 HQs | Revenue |
|---|---|---|
| Financial Services | 1 | $8B |
|
||
| Healthcare | 1 | $5B |
|
||
Price history
+45.8% since first listed12 events — show timeline
- 2026-04-10 Listed $223,000 WAMLS
- 2024-12-19 Relisted — WAMLS
- 2024-11-07 Pending — WAMLS
- 2024-07-24 Relisted — WAMLS
- 2024-06-17 Pending — WAMLS
- 2024-02-20 Listed $239,900 WAMLS
- 2016-12-13 Sold (Public Records) $165,900 Public Records
- 2016-12-13 Sold (MLS) $165,900 WAMLS
- 2016-09-14 Listed $169,900 WAMLS
- 2013-11-21 Sold (MLS) $160,000 WAMLS
- 2013-06-26 Listed $167,000 WAMLS
- 2007-10-04 Sold (Public Records) $152,900 Public Records
Property tax history
+4.2%/yrLatest (2025): $639 · +6.4% YoY. Source: county tax records.
Cash-flow waterfall
monthlySold comps — $/sqft
last 12 mo · ≤1 miLoading sold comps…