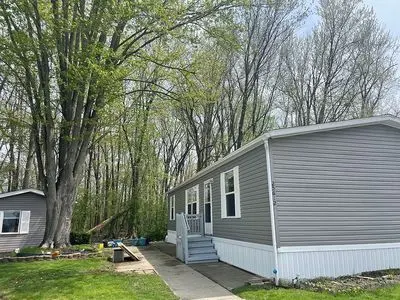
25612 Adams St · Novi, MI
Flood risk 1/10 · Minimal
- FEMA flood zone
- X
- Chance of flooding over 30 yrs
- 0.0%
- Est. flood insurance / yr
- $508 – $851
Fire risk 1/10 · Minimal
- Est. fire insurance / yr
- $784 – $1,456
Heat risk 3/10 · Minor
- Hot days now (above threshold)
- 7 days/yr
- Hot days in 30 yrs
- 15 days/yr
Wind risk No data
- Chance of severe wind over 30 yrs
- —
Air-quality risk 3/10 · Minor
- Unhealthy air days now
- 2 days/yr
- Unhealthy air days in 30 yrs
- 4 days/yr
Risk factors via First Street. Map © Google.
Why this score? — see what drove the B grade
The composite is a weighted blend of 9 inputs, each scored 0–100. Each bar is that input's sub-score; the figure is the points it added to the 100-point composite (weight × sub-score).
- Cash flow +30.0/30.0
- 1% rule +10.0/10.0
- DSCR +10.0/10.0
- ARV discount +7.5/15.0
- Schools +6.5/10.0
- Livability +4.3/5.0
- Condition / age +3.8/5.0
- Rent growth +2.9/5.0
- Appreciation +0.0/10.0
$54,600
🖨 Deal sheet (PDF) 📄 Offer letter ✓ Due diligence
Listing remarks
Welcome to this well-maintained 2017 double-wide manufactured home offering 3 bedrooms, 2 full bathrooms, and 1,248 sqft of comfortable living space in a desirable Novi community. This home features a bright, open-concept layout with abundant natural light, creating a warm and inviting space for everyday living and entertaining. The functional floor plan includes spacious bedrooms with walk-in closets, along with a large primary suite featuring a private bathroom and additional storage. Enjoy added privacy with a wooded backyard and no rear neighbors, a rare and highly desirable feature. The property also offers parking for up to 3 vehicles and a spacious 136 sqft storage shed, perfect for
Key facts
- Wooded backyard
- No rear neighbors
- Open-concept layout
Tags
Neighborhood map
What this means for you Summary
Snapshot
- This is a 3-bed/2.0-bath other listed at $55k. Condition is rated good.
Deal economics
- At list price, monthly cash flow is $1k ($14k/yr) — positive.
- The deal already cash-flows at list — no discount required.
- Meets the 1% rule at list price ($2k rent vs $55k).
- Recommended offer: $53k (3.0% below list) — sets the bar for market timing.
- Cap rate 32.8% vs local median 2.8% in Novi — top-decile yield for the area; either an underpriced asset or a hidden risk that comps aren't pricing in. Stress-test before assuming the spread holds.
Location & tenants
- Location reads 86/100 on livability (#20 in MI, #377 nationally) — a professional / high-income tenant draw. Strengths: crime A+, employment A+, housing A+; Watch: commute F.
- Novi Community School District (urban): math 73% / reading 72% proficiency, ranked #7 of 540 in MI (top 1%) — strong family-tenant draw, lease renewals of 3-5y typical; only 7% free/reduced lunch — higher-income household profile.
- Zoned schools: Village Oaks Elementary School (math 72% / reading 62%, grade B+, #105 of 1,397 statewide, top 9%, 538 students, 19% FRL); Novi High School (math 75% / reading 83%, grade A-, #8 of 713 statewide, top 1%, 2,101 students, 11% FRL).
- Market conditions: Rents rising (+1.7%/yr); 143 active listings in the ZIP; 10 comparable units currently listed for rent nearby; rentals at typical pace (median 14d on market — plan ~3-4 weeks tenant-placement turnaround); high-income renter base; 2,614 units permitted in Oakland County in 2024 (721 in 5+ unit buildings).
Forward outlook
- Local home prices are declining (-3.0%/yr); year-one equity from $377 of loan paydown is wiped out by about $2k of value loss. Plan a longer hold.
- Oakland County population projected at +10% by 2050 — modest demand growth; plan on rents tracking national, not racing it.
- At projected returns (-3.0% appreciation + 1.7% rent growth), your $15k cash investment doubles in ~2 years — after that, you're playing with house money.
Negotiation context
- It's been on market 35 days — a 3% lower offer ($53k) is reasonable based on typical stale-listing flexibility.
Questions for the listing agent
- It's been on market 35 days. Have you received any prior offers? Is the seller open to a 3% concession, seller financing, or rate buy-down credit?
- Is there a deadline driving the sale (1031 exchange, divorce, estate, relocation)? That informs how much negotiation room exists.
- Schools are A-rated — typically a magnet for longer-tenancy family renters. What's the average tenant stay here, and is there a school-zone premium baked into asking?
- What's the average days-on-market for RENTAL listings here right now (not sales)? A rising rental-DOM trend means longer vacancies and softer asking-rent achievability than the comps imply.
- What's the recent tenant-quality profile in this submarket — average credit score on applications, eviction rate, late-payment / NSF rate, and stable-employment percentage? A property-management company in the area should have these aggregated.
- How much new for-sale + rental construction is in the pipeline within 1–3 miles? Heavy new supply typically softens prices + rents 12–24 months out; constrained supply supports both.
Investment metrics
- 1% rule
- 3.67% ✓
- Cap rate
- 32.81%
- Cash-on-cash
- 94.70%
- DSCR
- 5.21
- GRM
- 2.3
CMA / ARV
No comps found within radius.
Projected returns pro-forma
-3.0% appreciation · 1.68% rent growth · sell at horizon
- IRR
- 94.1%
- Equity multiple
- 5.28×
- Total profit
- $65,394
- Equity at exit
- $8,141
- IRR
- 96.6%
- Equity multiple
- 10.52×
- Total profit
- $145,509
- Equity at exit
- $4,721
Cash invested: $15,288 (down + closing). Projections, not guarantees.
Landlord ↔ Tenant lean methodology
- Overall (STATE)
- 62 Landlord-Friendly
- State Michigan
- 62 Landlord-Friendly · EVEN
- County
- — inherits STATE
- City
- — inherits STATE
ZIP-level market 48375
- Rents YoY
- 1.7%
- Active inventory
- 143
- Price-to-rent
- 2.3×
Monthly cashflow live
- Estimated rent
- $2,005 high interval (Pro) →
- Mortgage (P&I)
- −$286
- Tax est. 1.5%
- −$68 /mo · $819/yr
- Insurance
- −$23
- HOA
- −$0
- Vacancy / Maint / Mgmt
- −$421
- Net cashflow
- $1,206
Break-even live
Sensitivity live
| Price | -10% $1,244 | -5% $1,225 | +0% $1,206 | +5% $1,188 | +10% $1,169 |
|---|---|---|---|---|---|
| Rent | -10% $1,048 | -5% $1,127 | +0% $1,206 | +5% $1,286 | +10% $1,365 |
| Rate | -1.0pp $1,234 | -0.5pp $1,220 | base $1,206 | +0.5pp $1,192 | +1.0pp $1,178 |
UW: 25.0% down · 7.5% · 30yr · 1.5% tax · 5.0% vac · 8.0% maint · 8.0% mgmt
Financing live
Cash to close
- Down payment
- $13,650
- Closing costs
- $1,638
- Reserves months
- —
- Total cash needed
- —
Loan-product check · same deal, 3 products live
Conventional
25% down · 7.5% · 30yr
- Down + closing
- —
- Monthly P&I
- —
- Monthly cashflow
- —
- DSCR
- —
- Eligible?
- —
Personal DTI + credit; lowest rate.
DSCR
20% down · 8.5% · 30yr
- Down + closing
- —
- Monthly P&I
- —
- Monthly cashflow
- —
- DSCR
- —
- Eligible?
- —
No personal income docs; deal must DSCR.
Hard money
10% down · 12.0% · 12mo
- Down + closing
- —
- Monthly P&I
- —
- Monthly cashflow
- —
- DSCR
- —
- Eligible?
- —
Short-term bridge; refi at stabilization.
Rent comps 10 comps
| Address | Beds | Baths | Sqft | Rent | $/sqft | DOM | Units | Dist |
|---|---|---|---|---|---|---|---|---|
| 24651 Olde Orchard St Novi, MI | 2.0 | 2.5 | 1096 | $1,795 | $1.64 | 6d | 1 | 0.64mi |
| 24701 Bashian Dr #8 Novi, MI | 2.0 | 2.5 | 1250 | $1,800 | $1.44 | 45d | 1 | 0.65mi |
| 25528 Portico Ln Unit 161 Novi, MI | 2.0 | 2.0 | 1240 | $1,800 | $1.45 | 45d | 1 | 0.98mi |
| 23737 Stonehenge Blvd Novi, MI | 2.0 | 1.0 | 936 | $1,900 | $2.03 | 19d | 1 | 1.06mi |
| 26375 Halsted Rd Farmington Hills, MI | 2.0–3.0 | 2.5 | 1528 | $2,339 | $1.53 | 0d | 8 | 1.08mi |
| 37863 Wendy Lee St Farmington Hills, MI | 3.0 | 2.0 | 1235 | $2,450 | $1.98 | 25d | 1 | 1.12mi |
| 23672 N Rockledge Novi, MI | 2.0 | 1.0 | 970 | $1,695 | $1.75 | 14d | 1 | 1.14mi |
| 42101 Fountain Park Dr N Novi, MI | 1.0–2.0 | 1.0–2.0 | 985 | $1,824 | $1.85 | 0d | 21 | 1.26mi |
| 24360 Independence Dr Farmington Hills, MI | 1.0–3.0 | 1.0–2.0 | 967 | $2,395 | $2.48 | 0d | 119 | 1.38mi |
| 25300 Constitution Novi, MI | 1.0–2.0 | 1.0–2.5 | 1241 | $2,344 | $1.89 | 0d | 14 | 1.45mi |
Listing history 13 events
-
2026-06-16days on market $54,600 Active 35 DOM
-
2026-06-15days on market $54,600 Active 34 DOM
-
2026-06-13days on market $54,600 Active 32 DOM
-
2026-06-13days on market $54,600 Active 31 DOM
-
2026-06-09days on market $54,600 Active 28 DOM
-
2026-06-08days on market $54,600 Active 27 DOM
-
2026-06-07days on market $54,600 Active 26 DOM
-
2026-06-04days on market $54,600 Active 23 DOM
-
2026-06-03days on market $54,600 Active 22 DOM
-
2026-06-02days on market $54,600 Active 21 DOM
-
2026-06-01days on market $54,600 Active 20 DOM
-
2026-05-31days on market $54,600 Active 19 DOM
-
2026-05-12$54,600 Active 1381-char remark
ⓘ Source: listings_history table (triggers on properties + properties_extension) + one-shot
backfill from property_details.listing_events for pre-trigger history.
Climate risk First Street
- Flood 1/10 Low FEMA zone X · 0% chance over 30 yrs
- Wildfire 1/10 Low
- Heat 3/10 Moderate
- Air quality 3/10 Moderate 2 unhealthy d/yr today · 4 by 30 yrs out
Nearby sold comps map
Loading sold comps map…
Walkable amenities ~0.75 mi
Loading nearby amenities…
Taxation est. · year 1
- Rental income
- $24,057
- − Mortgage interest
- −$3,058
- − Property taxes
- −$819
- − Insurance
- −$273
- − Repairs & maintenance
- −$1,925
- − Management
- −$1,925
- − Depreciation
- −$1,588
- Taxable income
- $14,469
- Est. tax owed @ 24.0%
- −$3,473
- After-tax cash flow
- $11,005/yr
For passive investors: Depreciation is non-cash, so a rental often shows a tax loss while cash-flowing — sheltering income. Rental losses are passive: they offset passive income freely, and up to $25,000/yr can offset ordinary (W-2) income if you actively participate and your MAGI is under $100k (phasing out to $0 by $150k); unused losses carry forward. On sale, claimed depreciation is recaptured at up to 25%, and gains may owe capital-gains tax (a 1031 exchange can defer both). Figures are a year-1 estimate at your 24.0% rate — not tax advice; consult a CPA.
Condition & rehab AI · 1 photo
This 2017 double-wide manufactured home is in good condition with a good exterior and interior. It offers a good layout and is located in a desirable Novi community. Some landscaping and curb appeal improvements would further enhance its value.
Value-add opportunities
- Both Landscaping and curb appeal improvements — Enhances the home's curb appeal and can attract more buyers or renters.
- Both Painting exterior and interior — Fresh paint can make the home look more inviting and can increase its value.
- Both Landscaping and curb appeal improvements — Enhances the home's curb appeal and can attract more buyers or renters.
Renovation cost estimate screening
Value-add ROI direction
- Both Landscaping and curb appeal improvements — Enhances the home's curb appeal and can attract more buyers or renters. ↑
- Both Painting exterior and interior — Fresh paint can make the home look more inviting and can increase its value. ↑
- Both Landscaping and curb appeal improvements — Enhances the home's curb appeal and can attract more buyers or renters. ↑
ⓘ Cost ranges are severity-bucket heuristics (US national rule-of-thumb). Get contractor quotes + a written scope before underwriting a rehab budget.
Schools (NCES district)
- District
- Novi Community School District
- NCES district ID
- 2626130
- Math proficiency
- 73% ▼ -3.00%
- Reading proficiency
- 72% ▼ -1.00%
- Median HH income
- $90,023
- Composite
- 65.28/100
- National rank
- #489
- State rank
- #7 of 540 in MI
Livability — Novi
- Score
- 86/100
- State rank
- #20
- US rank
- #377
Category grades
Schools grade is shown separately in the Schools card above.
Census & demographics
- Census place
- Novi, MI
- County
- Oakland County · 1,009,092 people
- City population
- 43,845
- Metro
- Detroit-Warren-Dearborn, MI
- Population (ZIP)
- 24,029
- Household income
- $112,545
- Rent vs Own
- Severe rent burden
- 517.0
Population outlook (Oakland County) Hauer SSP2
- Today (2025)
- 1,335,747 people
- By 2030
- 1,375,100 · +2.9%
- By 2040
- 1,435,385 · +7.5%
- By 2050
- 1,469,250 · +10.0%
- By 2075
- 1,531,946 · +14.7%
- By 2100
- 1,450,485 · +8.6%
Race, ethnicity, and origin ACS 2023
- Neighborhood character
- Diverse neighborhood (Simpson 0.60)
- Race & ethnicity
- White 56% Asian 27% Two or more races 7% Black 6% Hispanic / Latino 5%
- Hispanic origin (detail)
- Mexican 4%
- Common ancestry
- Romanian 10% Lithuanian 3% Slovak 2%
- Foreign-born
- 29% · China, Canada, South Korea
- Languages at home
- 67% English-only · Other Asian/Pacific 12% Other Indo-European 8% Spanish 4%
Political lean MEDSL · Oakland
- 2024 margin
- D (+10.6) · D 54.4% · R 43.8% · Other 1.9%
- 2008→2024 swing
- -3.9pp toward R · 2008: 14.5pp · 2024: 10.6pp
- All cycles
- 2024: D+10.6 2020: D+14.1 2016: D+8.1 2012: D+8.1 2008: D+14.5
Not yet ingested
- Civics
- —
Market trends
- HPI YoY
- ▼ -337.82%
- Current HPI
- 166.0153
- Rent YoY
- ▲ 1.68%
- Metro
- Detroit-Warren-Dearborn, MI
- State GDP YoY
- ▲ 1.37%
- F500 in state
- 28
Industry mix (Fortune 500 HQ in MI)
| Industry | F500 HQs | Revenue |
|---|---|---|
| Automotive Parts | 3 | $48B |
|
||
| Automotive | 2 | $372B |
|
||
| Chemicals | 1 | $45B |
|
||
| Automotive Retail | 1 | $29B |
|
||
| Healthcare / Medical Devices | 1 | $23B |
|
||
| Automotive Technology | 1 | $20B |
|
||
Cash-flow waterfall
monthlySold comps — $/sqft
last 12 mo · ≤1 miLoading sold comps…