1816 S 8th St · Burlington, IA
Flood risk 1/10 · Minimal
- FEMA flood zone
- X (unshaded)
- Chance of flooding over 30 yrs
- 0.0%
- Est. flood insurance / yr
- $507 – $1,088
Fire risk 1/10 · Minimal
- Est. fire insurance / yr
- $902 – $1,676
Heat risk 3/10 · Minor
- Hot days now (above 106°F)
- 7 days/yr
- Hot days in 30 yrs
- 16 days/yr
Wind risk 2/10 · Minimal
- Chance of severe wind over 30 yrs
- —
Air-quality risk 2/10 · Minimal
- Unhealthy air days now
- 0 days/yr
- Unhealthy air days in 30 yrs
- 1 days/yr
Risk factors via First Street. Map © Google.
Why this score? — see what drove the B grade
The composite is a weighted blend of 9 inputs, each scored 0–100. Each bar is that input's sub-score; the figure is the points it added to the 100-point composite (weight × sub-score).
- Cash flow +30.0/30.0
- 1% rule +10.0/10.0
- DSCR +10.0/10.0
- ARV discount +7.5/15.0
- Schools +4.0/10.0
- Livability +3.7/5.0
- Rent growth +2.5/5.0
- Condition / age +2.5/5.0
- Appreciation +0.0/10.0
$59,900
🖨 Deal sheet (PDF) 📄 Offer letter ✓ Due diligence
Listing remarks MLS
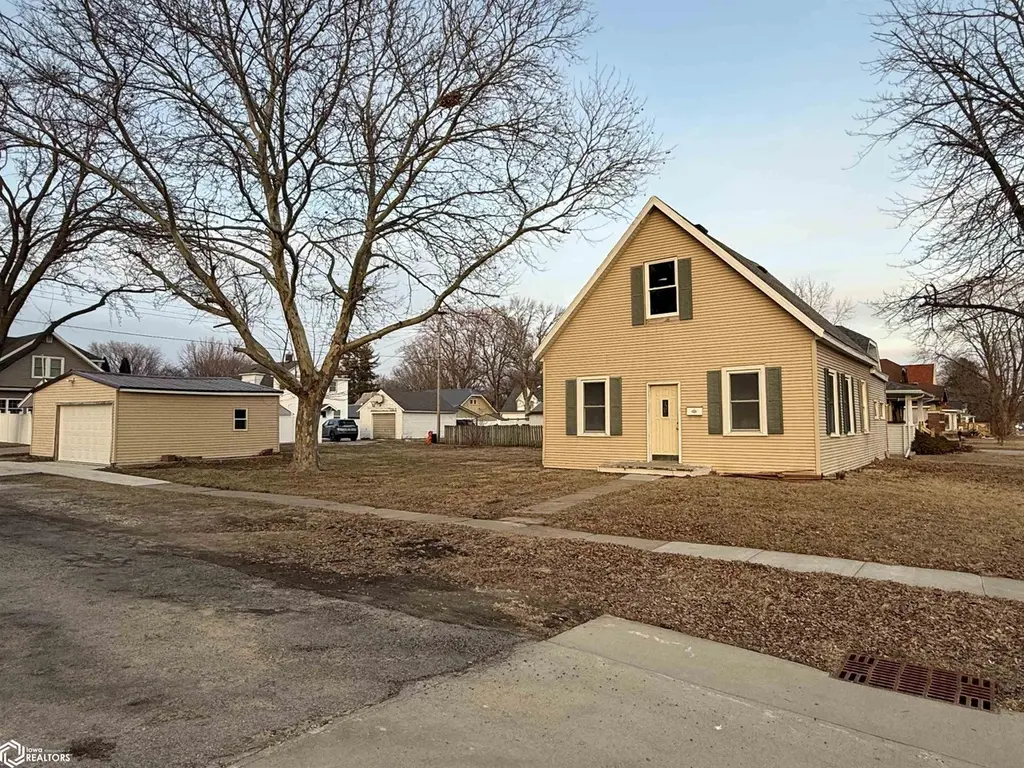
Built in 1900, this property at 1816 S. 8th St. has been fully gutted and is ready for renovation. The flexible floor plan offers potential for 2-3 bedrooms with options for customization. Situated on a corner lot, the home includes a detached garage with new metal roofing and siding. The home has a new shingle roof. Recently installed sidewalks add to the property’s curb appeal. A new electrical panel was added within the past two years. Sold as-is, this is a great opportunity for investors or buyers looking to renovate and create their ideal space.
Key facts
- 9,148 sq ft lot
- Garage
- Built 1900
Neighborhood map
What this means for you Summary
Snapshot
- This is a 3-bed/1.0-bath single-family listed at $60k.
Deal economics
- At list price, monthly cash flow is $501 ($6k/yr) — positive.
- The deal already cash-flows at list — no discount required.
- Meets the 1% rule at list price ($1k rent vs $60k).
- Recommended offer: $53k (12.0% below list) — sets the bar for market timing.
- Cap rate 16.3% vs local median 6.0% in Burlington — top-decile yield for the area; either an underpriced asset or a hidden risk that comps aren't pricing in. Stress-test before assuming the spread holds.
Location & tenants
- Location reads 73/100 on livability (#287 in IA) — a middle-class / working-renter tenant base. Strengths: cost of living A+, housing A+, health & safety A+; Watch: crime D+, employment D, amenities F.
- Burlington Community School District (town): math 42% / reading 54% proficiency, ranked #286 of 289 in IA (top 99%) — families likely to look elsewhere, expect single-tenant / working-renter base with shorter leases.
- Zoned schools: Black Hawk Elementary School (math 52% / reading 52%, grade C-, #494 of 616 statewide, top 83%, 316 students, 72% FRL); Edward Stone Middle School (math 34% / reading 48%, grade F, #236 of 246 statewide, top 96%, 489 students, 63% FRL); Burlington Community High School (math 45% / reading 64%, grade C-, #290 of 336 statewide, top 87%, 1,092 students, 58% FRL).
- Market conditions: 188 active listings in the ZIP; 2 comparable units currently listed for rent nearby; 53 units permitted in Des Moines County in 2024 (40 in 5+ unit buildings).
Forward outlook
- Local home prices are declining (-3.0%/yr); year-one equity from $414 of loan paydown is wiped out by about $2k of value loss. Plan a longer hold.
- Des Moines County population projected to shrink 6% by 2050 — rents likely to lag national; underwrite the cash flow, not the appreciation.
- At projected returns (-3.0% appreciation + 3.0% rent growth), your $17k cash investment doubles in ~4 years — after that, you're playing with house money.
Negotiation context
- It's been on market 131 days — a 12% lower offer ($53k) is reasonable based on typical stale-listing flexibility.
- Current owner paid $33k; list at $60k implies a 82% gain — meaningful room to come down on a strong offer.
Risks & watch-outs
- Watch-outs: built in 1900 — expect roof / HVAC / electrical / plumbing capex.
Questions for the listing agent
- It's been on market 131 days. Have you received any prior offers? Is the seller open to a 12% concession, seller financing, or rate buy-down credit?
- Built in 1900 — when were the roof, HVAC, electrical panel, plumbing, and water heater last replaced?
- Why hasn't it sold? Are there any deal-killer items the seller is aware of (foundation, flood, title, zoning, code violations)?
- Is there a deadline driving the sale (1031 exchange, divorce, estate, relocation)? That informs how much negotiation room exists.
- Crime grade is D in this area — have there been break-ins, vandalism, or insurance claims at this property in the last 3 years? What carrier currently insures it and at what premium?
- What's the average days-on-market for RENTAL listings here right now (not sales)? A rising rental-DOM trend means longer vacancies and softer asking-rent achievability than the comps imply.
- What's the recent tenant-quality profile in this submarket — average credit score on applications, eviction rate, late-payment / NSF rate, and stable-employment percentage? A property-management company in the area should have these aggregated.
- How much new for-sale + rental construction is in the pipeline within 1–3 miles? Heavy new supply typically softens prices + rents 12–24 months out; constrained supply supports both.
Investment metrics
- 1% rule
- 1.91% ✓
- Cap rate
- 16.34%
- Cash-on-cash
- 35.87%
- DSCR
- 2.60
- GRM
- 4.4
CMA / ARV
- ARV (median comp)
- $122,465
- List price
- $59,900
- Delta
- -51.09%
- Verdict
- UNDERPRICED
- Comps
- 20 within 1.0 mi
Show comp detail 12 sales within ~0.75 mi
| Address | Dist | Beds/Ba | Sqft | Sold | Price | $/sf | Match |
|---|---|---|---|---|---|---|---|
| 1909 Madison Ave | 0.10mi | 3/2.0 | 1,528 (+3%) | 4mo | $159,000 | $104 | 84 |
| 1913 S 15th St | 0.44mi | 3/1.5 | 1,461 (-2%) | 4mo | $120,000 | $82 | 71 |
| 718 Louisa St. St | 0.36mi | 3/1.0 | 1,635 (+10%) | 4mo | $100,000 | $61 | 63 |
| 910 S 14th St | 0.66mi | 3/1.0 | 1,552 (+4%) | 2mo | $64,000 | $41 | 61 |
| 1616 S 13th St | 0.34mi | 4/1.0 (+1) | 1,630 (+10%) | 5mo | $36,000 | $22 | 60 |
| 1200 Perkins Ave | 0.72mi | 3/2.0 | 1,478 (-1%) | 2mo | $104,000 | $70 | 59 |
| 2419 Madison Avenue Ave | 0.57mi | 3/1.5 | 1,649 (+11%) | 2mo | $269,000 | $163 | 52 |
| 1302 S 14 St | 0.50mi | 4/1.0 (+1) | 1,659 (+11%) | 0mo | $15,000 | $9 | 52 |
| 424 Wightman St | 0.49mi | 2/1.0 (-1) | 1,290 (-13%) | 5mo | $123,000 | $95 | 46 |
| 1821 Summer St | 0.54mi | 2/1.0 (-1) | 1,292 (-13%) | 3mo | $52,500 | $41 | 45 |
| 1625 Louisa St | 0.66mi | 3/1.0 | 1,266 (-15%) | 2mo | $112,900 | $89 | 43 |
| 1800 Barret St St | 0.60mi | 2/2.5 (-1) | 1,284 (-14%) | 0mo | $218,000 | $170 | 38 |
Match score weights: distance 35% · size 25% · config 20% · recency 20%. Top-matched comps best support the ARV.
Projected returns pro-forma
-3.0% appreciation · 3.0% rent growth · sell at horizon
- IRR
- 31.6%
- Equity multiple
- 2.33×
- Total profit
- $22,239
- Equity at exit
- $8,931
- IRR
- 38.7%
- Equity multiple
- 4.61×
- Total profit
- $60,529
- Equity at exit
- $5,179
Cash invested: $16,772 (down + closing). Projections, not guarantees.
Landlord ↔ Tenant lean methodology
- Overall (STATE)
- 83 Strongly Landlord-Friendly
- State Iowa
- 83 Strongly Landlord-Friendly · R+6
- County
- — inherits STATE
- City
- — inherits STATE
ZIP-level market 52601
- Active inventory
- 188
- Price-to-rent
- 4.4×
Monthly cashflow live
- Estimated rent
- $1,145 medium interval (Pro) →
- Mortgage (P&I)
- −$314
- Tax from tax record
- −$64 /mo · $770/yr
- Insurance
- −$25
- HOA
- −$0
- Vacancy / Maint / Mgmt
- −$240
- Net cashflow
- $501
Break-even live
Sensitivity live
| Price | -10% $535 | -5% $518 | +0% $501 | +5% $484 | +10% $467 |
|---|---|---|---|---|---|
| Rent | -10% $411 | -5% $456 | +0% $501 | +5% $547 | +10% $592 |
| Rate | -1.0pp $532 | -0.5pp $517 | base $501 | +0.5pp $486 | +1.0pp $470 |
UW: 25.0% down · 7.5% · 30yr · 1.5% tax · 5.0% vac · 8.0% maint · 8.0% mgmt
Financing live
Cash to close
- Down payment
- $14,975
- Closing costs
- $1,797
- Reserves months
- —
- Total cash needed
- —
Loan-product check · same deal, 3 products live
Conventional
25% down · 7.5% · 30yr
- Down + closing
- —
- Monthly P&I
- —
- Monthly cashflow
- —
- DSCR
- —
- Eligible?
- —
Personal DTI + credit; lowest rate.
DSCR
20% down · 8.5% · 30yr
- Down + closing
- —
- Monthly P&I
- —
- Monthly cashflow
- —
- DSCR
- —
- Eligible?
- —
No personal income docs; deal must DSCR.
Hard money
10% down · 12.0% · 12mo
- Down + closing
- —
- Monthly P&I
- —
- Monthly cashflow
- —
- DSCR
- —
- Eligible?
- —
Short-term bridge; refi at stabilization.
Rent comps 2 comps
| Address | Beds | Baths | Sqft | Rent | $/sqft | DOM | Units | Dist |
|---|---|---|---|---|---|---|---|---|
| 116 N 4th St Unit 214 Burlington, IA | 2.0 | 1.0 | 1205 | $1,295 | $1.07 | 45d | 1 | 1.37mi |
| 1601 Division St Burlington, IA | 3.0 | 1.0 | 1440 | $1,100 | $0.76 | 45d | 1 | 1.46mi |
Listing history 21 events
-
2026-06-21days on market $59,900 Active 131 DOM
-
2026-06-19days on market $59,900 Active 129 DOM
-
2026-06-18days on market $59,900 Active 128 DOM
-
2026-06-17days on market $59,900 Active 127 DOM
-
2026-06-16days on market $59,900 Active 126 DOM
-
2026-06-15days on market $59,900 Active 125 DOM
-
2026-06-14days on market $59,900 Active 123 DOM
-
2026-06-12days on market $59,900 Active 122 DOM
-
2026-06-09days on market $59,900 Active 119 DOM
-
2026-06-08days on market $59,900 Active 118 DOM
-
2026-06-07days on market $59,900 Active 117 DOM
-
2026-06-07days on market $59,900 Active 116 DOM
-
2026-06-03days on market $59,900 Active 113 DOM
-
2026-06-02days on market $59,900 Active 112 DOM
-
2026-06-01days on market $59,900 Active 111 DOM
-
2026-05-31days on market $59,900 Active 110 DOM
-
2026-05-30days on market $59,900 Active 109 DOM
-
2026-04-24price $59,900 562-char remark
Show marketing remark (562 chars)
Built in 1900, this property at 1816 S. 8th St. has been fully gutted and is ready for renovation. The flexible floor plan offers potential for 2-3 bedrooms with options for customization. Situated on a corner lot, the home includes a detached garage with new metal roofing and siding. The home has a new shingle roof. Recently installed sidewalks add to the property’s curb appeal. A new electrical panel was added within the past two years. Sold as-is, this is a great opportunity for investors or buyers looking to renovate and create their ideal space.
-
2026-02-10$62,500 Active 562-char remark
Show marketing remark (562 chars)
Built in 1900, this property at 1816 S. 8th St. has been fully gutted and is ready for renovation. The flexible floor plan offers potential for 2-3 bedrooms with options for customization. Situated on a corner lot, the home includes a detached garage with new metal roofing and siding. The home has a new shingle roof. Recently installed sidewalks add to the property’s curb appeal. A new electrical panel was added within the past two years. Sold as-is, this is a great opportunity for investors or buyers looking to renovate and create their ideal space.
-
2023-09-20soldstatus $33,000
-
2023-06-20soldstatus $20,500
ⓘ Source: listings_history table (triggers on properties + properties_extension) + one-shot
backfill from property_details.listing_events for pre-trigger history.
Tax reassessment forecast IA · Partial reset (capped growth)
- Current annual tax
- $770 · $64/mo
- Projected year-2 tax
- $855 · $71/mo
- Expected delta
- +$85/yr (+$7/mo · 11.1%)
ⓘ Screening estimate from a state-policy table — verify with the county assessor before closing.
Climate risk First Street
- Flood 1/10 Low FEMA zone X (unshaded) · 0% chance over 30 yrs
- Wildfire 1/10 Low
- Heat 3/10 Moderate 7 d/yr ≥106°F today · 16 d/yr by 30 yrs out
- Wind 2/10 Low
- Air quality 2/10 Low 0 unhealthy d/yr today · 1 by 30 yrs out
Nearby sold comps map
Loading sold comps map…
Walkable amenities ~0.75 mi
Loading nearby amenities…
Taxation est. · year 1
- Rental income
- $13,741
- − Mortgage interest
- −$3,355
- − Property taxes
- −$770
- − Insurance
- −$300
- − Repairs & maintenance
- −$1,099
- − Management
- −$1,099
- − Depreciation
- −$1,743
- Taxable income
- $5,375
- Est. tax owed @ 24.0%
- −$1,290
- After-tax cash flow
- $4,727/yr
For passive investors: Depreciation is non-cash, so a rental often shows a tax loss while cash-flowing — sheltering income. Rental losses are passive: they offset passive income freely, and up to $25,000/yr can offset ordinary (W-2) income if you actively participate and your MAGI is under $100k (phasing out to $0 by $150k); unused losses carry forward. On sale, claimed depreciation is recaptured at up to 25%, and gains may owe capital-gains tax (a 1031 exchange can defer both). Figures are a year-1 estimate at your 24.0% rate — not tax advice; consult a CPA.
Schools (NCES district)
- District
- Burlington Community School District
- NCES district ID
- 1905790
- Math proficiency
- 42% ▼ -4.00%
- Reading proficiency
- 54% ▼ -1.00%
- Median HH income
- $41,833
- Composite
- 40.3/100
- National rank
- #3753
- State rank
- #286 of 289 in IA
Livability — Burlington
- Score
- 73/100
- State rank
- #287
- US rank
- #5540
Category grades
Schools grade is shown separately in the Schools card above.
Census & demographics
- Census place
- Burlington, IA
- County
- Des Moines County · 27,341 people
- City population
- 27,341
- Metro
- Burlington, IA-IL
- Population (ZIP)
- 27,341
- Household income
- $60,983
- Rent vs Own
- Severe rent burden
- 963.0
Population outlook (Des Moines County) Hauer SSP2
- Today (2025)
- 39,735 people
- By 2030
- 39,257 · -1.2%
- By 2040
- 38,090 · -4.1%
- By 2050
- 37,156 · -6.5%
- By 2075
- 36,905 · -7.1%
- By 2100
- 37,222 · -6.3%
Race, ethnicity, and origin ACS 2023
- Neighborhood character
- Predominantly White (83%)
- Race & ethnicity
- White 83% Two or more races 8% Black 5% Hispanic / Latino 4% Asian 1%
- Common ancestry
- Iranian 2% Lithuanian 2% Slovak 2%
- Foreign-born
- 3% · Canada
- Languages at home
- 95% English-only · Spanish 3% Other Asian/Pacific 1%
Political lean MEDSL · Des Moines
- 2024 margin
- R (+15.1) · D 41.8% · R 56.8% · Other 1.4%
- 2008→2024 swing
- -38.1pp toward R · 2008: 23.0pp · 2024: -15.1pp
- All cycles
- 2024: R+15.1 2020: R+8.5 2016: R+7.0 2012: D+18.5 2008: D+23.0
Not yet ingested
- Civics
- —
Market trends
- HPI YoY
- ▼ -83.48%
- Current HPI
- 149.7662
- Rent YoY
- —
- Metro
- Burlington, IA-IL
- State GDP YoY
- ▲ 2.48%
- F500 in state
- 4
Industry mix (Fortune 500 HQ in IA)
| Industry | F500 HQs | Revenue |
|---|---|---|
| Financial Services | 1 | $16B |
|
||
| Retail / Convenience | 1 | $15B |
|
||
Price history
+192.2% since first listed4 events — show timeline
- 2026-04-24 Price Changed $59,900 IAR
- 2026-02-10 Listed $62,500 IAR
- 2023-09-20 Sold (Public Records) $33,000 Public Records
- 2023-06-20 Sold (Public Records) $20,500 Public Records
Property tax history
-1.5%/yrLatest (2025): $770 · -25.5% YoY. Source: county tax records.
Cash-flow waterfall
monthlySold comps — $/sqft
last 12 mo · ≤1 miLoading sold comps…