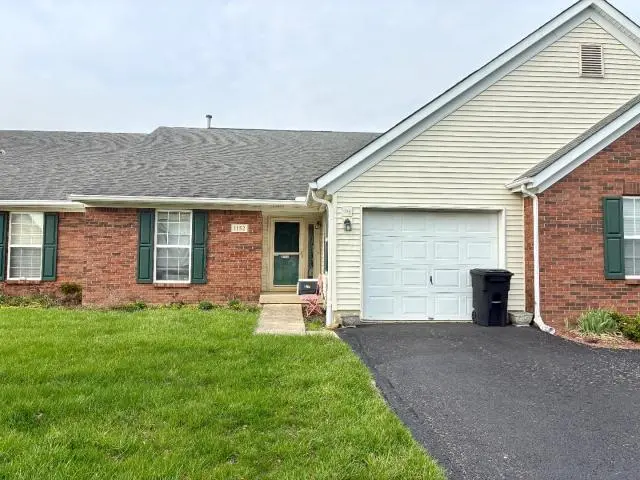
1152 Arbor Oaks Ln · Columbus, OH
Flood risk 1/10 · Minimal
- FEMA flood zone
- X (unshaded)
- Chance of flooding over 30 yrs
- 0.0%
- Est. flood insurance / yr
- $473 – $860
Fire risk 1/10 · Minimal
- Est. fire insurance / yr
- $713 – $1,323
Heat risk 4/10 · Minor
- Hot days now (above 100°F)
- 7 days/yr
- Hot days in 30 yrs
- 18 days/yr
Wind risk 2/10 · Minimal
- Chance of severe wind over 30 yrs
- 1.0%
Air-quality risk 2/10 · Minimal
- Unhealthy air days now
- 1 days/yr
- Unhealthy air days in 30 yrs
- 2 days/yr
Risk factors via First Street. Map © Google.
Why this score? — see what drove the D grade
The composite is a weighted blend of 9 inputs, each scored 0–100. Each bar is that input's sub-score; the figure is the points it added to the 100-point composite (weight × sub-score).
- Cash flow +15.0/30.0
- ARV discount +7.5/15.0
- 1% rule +5.0/10.0
- DSCR +5.0/10.0
- Livability +4.0/5.0
- Rent growth +3.6/5.0
- Condition / age +2.5/5.0
- Schools +1.7/10.0
- Appreciation +0.0/10.0
$1
🖨 Deal sheet (PDF) 📄 Offer letter ✓ Due diligence
Listing remarks MLS
Conveniently located accessible condo with vaulted great room with gas log fireplace, wide doorways and halls. 2nd floor loft/ bonus room with full bath. Full ready to finish poured wall lower level.
Key facts
- $315 HOA
- Garage
- Built 1998
Neighborhood map
What this means for you Summary
Snapshot
- This is a 2-bed/2.5-bath condo listed at $1.
Deal economics
- At list price, monthly cash flow is $1k ($15k/yr) — positive.
- The deal already cash-flows at list — no discount required.
- Meets the 1% rule at list price ($2k rent vs $1).
- Cap rate 1532587.7% vs local median 3.8% in Columbus — top-decile yield for the area; either an underpriced asset or a hidden risk that comps aren't pricing in. Stress-test before assuming the spread holds.
Location & tenants
- Location reads 81/100 on livability (#97 in OH, #1,491 nationally) — a professional / high-income tenant draw. Strengths: commute A+, cost of living A+, housing A+; Watch: employment C-, crime F.
- Columbus City School District (urban): math 15% / reading 26% proficiency, ranked #626 of 656 in OH (top 95%) — low school quality limits family demand, transient renter base, plan for 1-2y turnover; 72% free/reduced lunch — lower-income household profile, screen leases tightly.
- Zoned schools: Indianola Informal K-8 School (math 43% / reading 58%, grade D+, #896 of 1,584 statewide, top 57%, 684 students, 0% FRL); Arts Impact Middle School (Aims) (math 17% / reading 25%, grade F, #608 of 654 statewide, top 93%, 532 students, 0% FRL); Briggs High School (math 2% / reading 22%, grade F, #726 of 781 statewide, top 94%, 980 students, 0% FRL) — zoned schools average 0% FRL vs 72% district-wide (72 pts lower); this property's tenant base skews higher-income than the district average.
- Market conditions: Rents rising fast (+4.3%/yr); 111 active listings in the ZIP; 30 comparable units currently listed for rent nearby; rentals at typical pace (median 14d on market — plan ~3-4 weeks tenant-placement turnaround); solid renter incomes; 8,139 units permitted in Franklin County in 2024 (5,940 in 5+ unit buildings).
Forward outlook
- Local home prices are declining (-3.0%/yr); year-one equity from $0 of loan paydown is wiped out by about $0 of value loss. Plan a longer hold.
- Franklin County population projected at +34% by 2050 — long-run rental-demand tailwind backs the buy-and-hold thesis.
- At projected returns (-3.0% appreciation + 4.3% rent growth), your $0 cash investment doubles in ~1 year — after that, you're playing with house money.
Negotiation context
- Only 0 days on market — expect competitive offers; lowballing is unlikely to land.
- 2 sale attempts since 16y ago with the ask held roughly flat each time — persistent listings suggest the price (not the market) is what's stuck; bring a comps-based counter.
Questions for the listing agent
- What does the HOA fee cover, when was the last increase, and are there any pending special assessments or reserve-fund shortfalls?
- Any open or pending special assessments — roof, HVAC, plumbing, elevator, façade? What's the per-unit balance and payoff schedule, and is the seller paying it off at close or rolling it to the buyer?
- Is there a deadline driving the sale (1031 exchange, divorce, estate, relocation)? That informs how much negotiation room exists.
- Crime grade is F in this area — have there been break-ins, vandalism, or insurance claims at this property in the last 3 years? What carrier currently insures it and at what premium?
- The area grade is low — what's the realistic commute time and amenity access for the typical tenant pool here? Any planned neighborhood developments (good or bad) we should know about?
- What's the average days-on-market for RENTAL listings here right now (not sales)? A rising rental-DOM trend means longer vacancies and softer asking-rent achievability than the comps imply.
- What's the recent tenant-quality profile in this submarket — average credit score on applications, eviction rate, late-payment / NSF rate, and stable-employment percentage? A property-management company in the area should have these aggregated.
- How much new apartment / multifamily construction is in the pipeline within 1–3 miles? Heavy new supply (>2% of stock underway) typically softens rents 12–24 months out; light construction supports rent growth.
Investment metrics
- 1% rule
- 201539.00% ✓
- Cap rate
- 1532587.72%
- Cash-on-cash
- 5473505.10%
- DSCR
- 243541.18
- GRM
- 0.0
CMA / ARV
No comps found within radius.
Projected returns pro-forma
-3.0% appreciation · 4.33% rent growth · sell at horizon
- IRR
- —
- Equity multiple
- 301068.33×
- Total profit
- $84,299
- Equity at exit
- $0
- IRR
- —
- Equity multiple
- 680639.53×
- Total profit
- $190,579
- Equity at exit
- $0
Cash invested: $0 (down + closing). Projections, not guarantees.
Landlord ↔ Tenant lean methodology
- Overall (STATE)
- 73 Landlord-Friendly
- State Ohio
- 73 Landlord-Friendly · R+6
- County
- — inherits STATE
- City
- — inherits STATE
ZIP-level market 43119
- Rents YoY
- 4.3%
- Active inventory
- 111
Monthly cashflow live
- Estimated rent
- $2,015 high interval (Pro) →
- Mortgage (P&I)
- −$0
- Tax est. 1.5%
- −$0 /mo · $0/yr
- Insurance
- −$0
- HOA
- −$315
- Vacancy / Maint / Mgmt
- −$423
- Net cashflow
- $1,277
Break-even live
Sensitivity live
| Price | -10% $1,277 | -5% $1,277 | +0% $1,277 | +5% $1,277 | +10% $1,277 |
|---|---|---|---|---|---|
| Rent | -10% $1,118 | -5% $1,198 | +0% $1,277 | +5% $1,357 | +10% $1,436 |
| Rate | -1.0pp $1,277 | -0.5pp $1,277 | base $1,277 | +0.5pp $1,277 | +1.0pp $1,277 |
UW: 25.0% down · 7.5% · 30yr · 1.5% tax · 5.0% vac · 8.0% maint · 8.0% mgmt
Financing live
Cash to close
- Down payment
- $0
- Closing costs
- $0
- Reserves months
- —
- Total cash needed
- —
Loan-product check · same deal, 3 products live
Conventional
25% down · 7.5% · 30yr
- Down + closing
- —
- Monthly P&I
- —
- Monthly cashflow
- —
- DSCR
- —
- Eligible?
- —
Personal DTI + credit; lowest rate.
DSCR
20% down · 8.5% · 30yr
- Down + closing
- —
- Monthly P&I
- —
- Monthly cashflow
- —
- DSCR
- —
- Eligible?
- —
No personal income docs; deal must DSCR.
Hard money
10% down · 12.0% · 12mo
- Down + closing
- —
- Monthly P&I
- —
- Monthly cashflow
- —
- DSCR
- —
- Eligible?
- —
Short-term bridge; refi at stabilization.
Rent comps 30 comps
| Address | Beds | Baths | Sqft | Rent | $/sqft | DOM | Units | Dist |
|---|---|---|---|---|---|---|---|---|
| 1284 Falene Pl Galloway, OH | 3.0 | 2.0 | 1510 | $2,355 | $1.56 | 3d | 1 | 0.08mi |
| 1097 Leclerc Pl Galloway, OH | 3.0 | 2.0 | 1850 | $2,520 | $1.36 | 6d | 1 | 0.26mi |
| 2791 Chopper Ln Columbus, OH | 1.0–2.0 | 1.0–2.5 | 1004 | $2,884 | $2.87 | 3d | 25 | 0.37mi |
| 794 Wallinger Dr Galloway, OH | 3.0 | 2.5 | 1428 | $2,125 | $1.49 | 25d | 1 | 0.42mi |
| 931 Muirwood Village Dr Columbus, OH | 1.0–2.0 | 1.0 | 800 | $1,399 | $1.75 | 4d | 11 | 0.48mi |
| 5761 Ricardo Dr Galloway, OH | 3.0 | 2.0 | 1102 | $2,010 | $1.82 | 45d | 1 | 0.60mi |
| 5816 Oreily Dr Galloway, OH | 3.0 | 2.5 | 1248 | $2,300 | $1.84 | 14d | 1 | 0.62mi |
| 5580 Leigh Run Ct Columbus, OH | 2.0 | 1.0 | 950 | $1,244 | $1.31 | 3d | 3 | 0.64mi |
| 6245 Jolliff St Galloway, OH | 3.0 | 2.5 | 1806 | $2,455 | $1.36 | 17d | 1 | 0.65mi |
| 950 Brushfield Dr Galloway, OH | 1.0–2.0 | 1.0–2.0 | 819 | $1,231 | $1.50 | 3d | 10 | 0.67mi |
| 815 Galloway Rd Galloway, OH | 1.0–3.0 | 1.0–2.0 | 953 | $1,512 | $1.59 | 3d | 1 | 0.68mi |
| 6160 Hall Rd Galloway, OH | 1.0–3.0 | 1.0–2.0 | 953 | $1,512 | $1.59 | 3d | 1 | 0.72mi |
| 5335 Cherry Bud Ct Columbus, OH | 3.0 | 2.0 | 1456 | $2,298 | $1.58 | 45d | 1 | 0.73mi |
| 5500 Floral Cir S Columbus, OH | 1.0–3.0 | 1.0–2.0 | 762 | $1,152 | $1.51 | 5d | 22 | 0.83mi |
| 560 Corral Gate Ct Galloway, OH | 3.0 | 2.0 | 1658 | $2,286 | $1.38 | 23d | 1 | 0.84mi |
| 6203 Streaming Ave Galloway, OH | 3.0 | 2.0 | 1159 | $1,745 | $1.51 | 14d | 1 | 0.89mi |
| 5445 Eaglecrest Dr Galloway, OH | 1.0–2.0 | 1.0–2.0 | 800 | $1,290 | $1.61 | 16d | 7 | 0.92mi |
| 500 Dove Tree Dr Galloway, OH | 1.0–2.0 | 1.0–1.5 | 804 | $1,419 | $1.76 | 3d | 1 | 0.93mi |
| 6370 Bellinger Dr Galloway, OH | 3.0 | 2.5 | 1676 | $2,400 | $1.43 | 45d | 1 | 0.93mi |
| 1595 Georgesville Rd Columbus, OH | 1.0–3.0 | 1.0–2.0 | 953 | $1,575 | $1.65 | 3d | 1 | 0.96mi |
| 550 Brandenbush Ln Columbus, OH | 2.0 | 1.0 | 878 | $1,060 | $1.21 | 5d | 7 | 0.96mi |
| 6425 Bellmouth Rd Galloway, OH | 3.0 | 2.5 | 1418 | $2,130 | $1.50 | 45d | 1 | 1.11mi |
| 6421 Bellmouth Rd Prairie Township, OH | 3.0 | 2.5 | 1418 | $2,150 | $1.52 | 45d | 1 | 1.11mi |
| 6411 Bellmouth Rd Prairie Township, OH | 3.0 | 2.5 | 1418 | $2,100 | $1.48 | 25d | 1 | 1.12mi |
| 859 Eliots Oak Rd Columbus, OH | 3.0 | 1.0 | 1232 | $1,950 | $1.58 | 16d | 1 | 1.12mi |
| 5809-5811 Pepperwood Ct Unit 5809 Galloway, OH | 2.0 | 1.0 | 910 | $1,349 | $1.48 | 21d | 1 | 1.16mi |
| 4800 Hall Rd Columbus, OH | 1.0–3.0 | 1.0–2.0 | 880 | $1,074 | $1.22 | 4d | 24 | 1.22mi |
| 349 Cloverhill Dr Galloway, OH | 3.0 | 2.0 | 1472 | $2,510 | $1.71 | 4d | 1 | 1.24mi |
| 5095 Maple Valley Dr Columbus, OH | 3.0 | 2.5 | 1709 | $2,300 | $1.35 | 23d | 1 | 1.40mi |
| 5591 Rustling Way LN Galloway, OH | 1.0–3.0 | 1.0–2.5 | 962 | $1,427 | $1.48 | 3d | 8 | 1.43mi |
HOA detail condo
- Monthly dues
- $315 · $3,780/yr
- Likely covers
- gas
- Assessments
- None detected in remarks — confirm with the listing agent.
Listing history 6 events
-
2026-04-30status Pending
-
2026-04-22$1
-
2026-04-22historical
-
2011-08-16soldstatus $79,000
-
2011-07-15soldstatus $79,000 199-char remark
Show marketing remark (199 chars)
Conveniently located accessible condo with vaulted great room with gas log fireplace, wide doorways and halls. 2nd floor loft/ bonus room with full bath. Full ready to finish poured wall lower level.
-
2010-02-11$75,000 199-char remark
Show marketing remark (199 chars)
Conveniently located accessible condo with vaulted great room with gas log fireplace, wide doorways and halls. 2nd floor loft/ bonus room with full bath. Full ready to finish poured wall lower level.
ⓘ Source: listings_history table (triggers on properties + properties_extension) + one-shot
backfill from property_details.listing_events for pre-trigger history.
Climate risk First Street
- Flood 1/10 Low FEMA zone X (unshaded) · 0% chance over 30 yrs
- Wildfire 1/10 Low
- Heat 4/10 Moderate 7 d/yr ≥100°F today · 18 d/yr by 30 yrs out
- Wind 2/10 Low 100% chance of damaging wind over 30 yrs
- Air quality 2/10 Low 1 unhealthy d/yr today · 2 by 30 yrs out
Nearby sold comps map
Loading sold comps map…
Walkable amenities ~0.75 mi
Loading nearby amenities…
Taxation est. · year 1
- Rental income
- $24,185
- − Mortgage interest
- −$0
- − Property taxes
- −$0
- − Insurance
- −$0
- − Repairs & maintenance
- −$1,935
- − Management
- −$1,935
- − HOA
- −$3,780
- − Depreciation
- −$0
- Taxable income
- $16,535
- Est. tax owed @ 24.0%
- −$3,968
- After-tax cash flow
- $11,357/yr
For passive investors: Depreciation is non-cash, so a rental often shows a tax loss while cash-flowing — sheltering income. Rental losses are passive: they offset passive income freely, and up to $25,000/yr can offset ordinary (W-2) income if you actively participate and your MAGI is under $100k (phasing out to $0 by $150k); unused losses carry forward. On sale, claimed depreciation is recaptured at up to 25%, and gains may owe capital-gains tax (a 1031 exchange can defer both). Figures are a year-1 estimate at your 24.0% rate — not tax advice; consult a CPA.
Schools (NCES district)
- District
- Columbus City School District
- NCES district ID
- 3904380
- Math proficiency
- 15% ▼ -17.00%
- Reading proficiency
- 26% ▼ -12.00%
- Median HH income
- $38,483
- Composite
- 17.19/100
- National rank
- #9105
- State rank
- #626 of 656 in OH
Livability — Columbus
- Score
- 81/100
- State rank
- #97
- US rank
- #1491
Category grades
Schools grade is shown separately in the Schools card above.
Census & demographics
- Census place
- Columbus, OH
- County
- Franklin County · 1,351,780 people
- City population
- 612,189
- Metro
- Columbus, OH
- Population (ZIP)
- 29,660
- Household income
- $91,224
- Rent vs Own
- Severe rent burden
- 583.0
Population outlook (Franklin County) Hauer SSP2
- Today (2025)
- 1,456,139 people
- By 2030
- 1,556,890 · +6.9%
- By 2040
- 1,757,349 · +20.7%
- By 2050
- 1,950,539 · +34.0%
- By 2075
- 2,376,171 · +63.2%
- By 2100
- 2,636,796 · +81.1%
Race, ethnicity, and origin ACS 2023
- Neighborhood character
- Predominantly White (71%)
- Race & ethnicity
- White 71% Hispanic / Latino 11% Black 9% Two or more races 8% Asian 5%
- Hispanic origin (detail)
- Mexican 7%
- Common ancestry
- Romanian 4% Subsaharan African 2% Slovak 2%
- Foreign-born
- 12% · Canada, Vietnam, China
- Languages at home
- 85% English-only · Spanish 7% Russian/Polish/Slavic 2% Other Asian/Pacific 1%
Political lean MEDSL · Franklin
- 2024 margin
- Strong D (+28.4) · D 63.7% · R 35.3% · Other 1.0%
- 2008→2024 swing
- +7.7pp toward D · 2008: 20.7pp · 2024: 28.4pp
- All cycles
- 2024: D+28.4 2020: D+31.4 2016: D+25.9 2012: D+21.7 2008: D+20.7
Not yet ingested
- Civics
- —
Market trends
- HPI YoY
- ▼ -171.31%
- Current HPI
- 256.3516
- Rent YoY
- ▲ 4.33%
- Metro
- Columbus, OH
- State GDP YoY
- ▲ 1.98%
- F500 in state
- 48
Industry mix (Fortune 500 HQ in OH)
| Industry | F500 HQs | Revenue |
|---|---|---|
| Insurance | 3 | $145B |
|
||
| Industrial Machinery | 3 | $49B |
|
||
| Financial Services | 3 | $24B |
|
||
| Consumer Goods | 2 | $93B |
|
||
| Aerospace / Defense | 2 | $47B |
|
||
| Utilities | 2 | $33B |
|
||
Price history
+5.3% since first listed6 events — show timeline
- 2026-04-30 Pending — CBRMLS
- 2026-04-22 Listing Removed — CBRMLS
- 2026-04-22 Listed $1 CBRMLS
- 2011-08-16 Sold (Public Records) $79,000 Public Records
- 2011-07-15 Sold (MLS) $79,000 CBRMLS
- 2010-02-11 Listed $75,000 CBRMLS
Property tax history
-3.6%/yrLatest (2024): $3,086 · +1.3% YoY. Source: county tax records.
Cash-flow waterfall
monthlySold comps — $/sqft
last 12 mo · ≤1 miLoading sold comps…