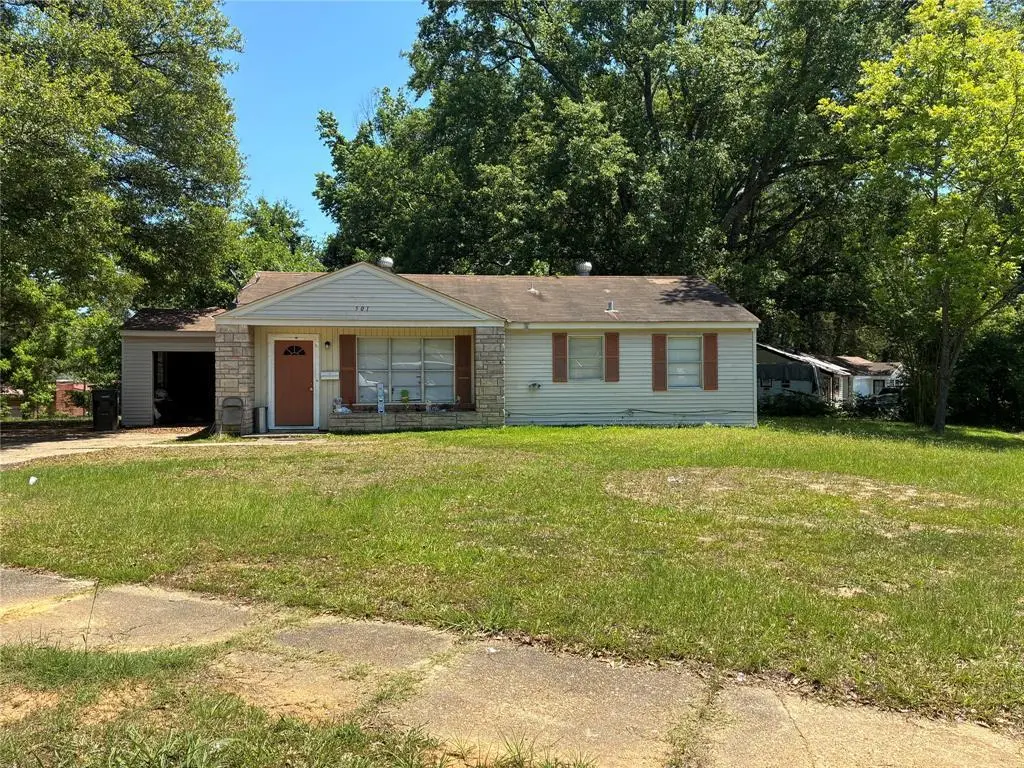
501 Center Park Dr · Springhill, LA
Flood risk 1/10 · Minimal
- FEMA flood zone
- X (unshaded)
- Chance of flooding over 30 yrs
- 0.0%
- Est. flood insurance / yr
- $507 – $1,088
Fire risk 4/10 · Minor
- Est. fire insurance / yr
- $1,269 – $2,357
Heat risk 7/10 · Major
- Hot days now (above 111°F)
- 7 days/yr
- Hot days in 30 yrs
- 22 days/yr
Wind risk 6/10 · Moderate
- Chance of severe wind over 30 yrs
- 51.0%
Air-quality risk 1/10 · Minimal
- Unhealthy air days now
- 0 days/yr
- Unhealthy air days in 30 yrs
- 0 days/yr
Risk factors via First Street. Map © Google.
Why this score? — see what drove the A- grade
The composite is a weighted blend of 9 inputs, each scored 0–100. Each bar is that input's sub-score; the figure is the points it added to the 100-point composite (weight × sub-score).
- Cash flow +30.0/30.0
- ARV discount +15.0/15.0
- 1% rule +10.0/10.0
- DSCR +10.0/10.0
- Appreciation +6.8/10.0
- Livability +3.2/5.0
- Rent growth +2.5/5.0
- Condition / age +2.5/5.0
- Schools +1.8/10.0
$60,000
🖨 Deal sheet 📄 Offer letter ✓ Due diligence
Listing remarks
Great rental property that is currently occupied. Tenants wish to stay. The owner is very motivated. Tenants currently pay $850 a month. This is an AS IS sell.
Key facts
- 5,227 sq ft lot
- Parking
- Built 1959
Property features AI
Finance
- Other: Property listed as Residential Income - Multi Family; One building with one unit; Parcel number: 125841; County: Webster; Country: United States
- Financial info: Gross annual income reported: $10,200; Gross annual expenses reported: $0; Occupancy rate listed as 850; No second mortgage
- HOA & community: No association
Exterior
- Parking: Attached carport (1 parking space)
- Utilities: City water; City sewer; Co-op electric; Other utility services
- Home design: Residential income, multi-family property; Single story; Built in 1959
- Construction: Siding and stone veneer exterior; Shingle roof; Slab foundation
- Exterior features: Lot approximately 0.12 acres; Subdivision: EAST SIDE SUBDV #2; Directions: follow GPS
Interior
- Kitchen: Refrigerator
- Bedrooms: 3 bedrooms
- Flooring: Other flooring
- Bathrooms: 2 full bathrooms
- Heating & cooling: Heating: Other; Cooling: Other
- Interior features: Cable TV available; One-level layout
Neighborhood map
What this means for you Summary
Snapshot
- This is a 3-bed/2.0-bath single-family listed at $60k.
Deal economics
- At list price, monthly cash flow is $520 ($6k/yr) — positive.
- The deal already cash-flows at list — no discount required.
- Meets the 1% rule at list price ($1k rent vs $60k).
- Recommended offer: $59k (1.5% below list) — sets the bar for market timing.
- Cap rate 16.7% vs local median 7.0% in Springhill — top-decile yield for the area; either an underpriced asset or a hidden risk that comps aren't pricing in. Stress-test before assuming the spread holds.
Location & tenants
- Location reads 65/100 on livability (#139 in LA) — a middle-class / working-renter tenant base. Strengths: cost of living A+, crime A-, health & safety A-; Watch: amenities F, commute F, employment F.
- Webster Parish (town): math 17% / reading 26% proficiency, ranked #67 of 98 in LA (top 68%) — low school quality limits family demand, transient renter base, plan for 1-2y turnover; 61% free/reduced lunch — lower-income household profile, screen leases tightly.
- Market conditions: 44 active listings in the ZIP; 36 units permitted in Webster Parish in 2024 (0 in 5+ unit buildings).
Forward outlook
- In year one you build about $3k of equity ($415 loan paydown + $2k appreciation (3.6% local appreciation)).
- Webster County population projected at -21% by 2050 — secular population decline; favor cash flow + early exit over multi-decade hold.
- At projected returns (3.6% appreciation + 3.0% rent growth), your $17k cash investment doubles in ~2 years — after that, you're playing with house money.
Negotiation context
- It's been on market 30 days — a 2% lower offer ($59k) is reasonable based on typical stale-listing flexibility.
- Current owner paid $36k; list at $60k implies a 67% gain — meaningful room to come down on a strong offer.
Risks & watch-outs
- Watch-outs: built in 1959 — expect roof / HVAC / electrical / plumbing capex.
- Climate carrying-cost: major wind risk, 51% chance of damaging wind over 30y; extreme-heat days projected 7→22/yr by 2055 (HVAC capex compounding) — expect insurance premiums to compound above CPI over the hold.
Questions for the listing agent
- Built in 1959 — when were the roof, HVAC, electrical panel, plumbing, and water heater last replaced?
- Is there a deadline driving the sale (1031 exchange, divorce, estate, relocation)? That informs how much negotiation room exists.
- What's the average days-on-market for RENTAL listings here right now (not sales)? A rising rental-DOM trend means longer vacancies and softer asking-rent achievability than the comps imply.
- What's the recent tenant-quality profile in this submarket — average credit score on applications, eviction rate, late-payment / NSF rate, and stable-employment percentage? A property-management company in the area should have these aggregated.
- How much new for-sale + rental construction is in the pipeline within 1–3 miles? Heavy new supply typically softens prices + rents 12–24 months out; constrained supply supports both.
Investment metrics
- 1% rule
- 1.91% ✓
- Cap rate
- 16.70%
- Cash-on-cash
- 37.16%
- DSCR
- 2.65
- GRM
- 4.4
CMA / ARV
- ARV (on-the-fly)
- $107,565
- Comps found
- 12
Show comp detail 12 sales within ~0.75 mi
| Address | Dist | Beds/Ba | Sqft | Sold | Price | $/sf | Match |
|---|---|---|---|---|---|---|---|
| 700 Reynolds St | 0.24mi | 2/2.0 (-1) | 1,520 (+0%) | 7mo | $149,500 | $98 | 78 |
| 702 S Park Dr | 0.30mi | 3/2.0 | 1,536 (+1%) | 13mo | $109,500 | $71 | 73 |
| 405 SE 8th St | 0.25mi | 3/2.0 | 1,682 (+11%) | 4mo | $89,900 | $53 | 67 |
| 201 SE 3rd St | 0.17mi | 2/2.0 (-1) | 1,332 (-12%) | 11mo | $39,900 | $30 | 58 |
| 205 8th St NE | 0.39mi | 3/1.5 | 1,360 (-10%) | 6mo | $117,500 | $86 | 58 |
| 201 NW 4th St | 0.67mi | 3/1.0 | 1,539 (+2%) | 6mo | $99,900 | $65 | 57 |
| 113 Sherman Dr | 0.52mi | 3/1.5 | 1,620 (+7%) | 9mo | $125,000 | $77 | 55 |
| 1020 Machen Dr | 0.71mi | 3/2.0 | 1,603 (+6%) | 12mo | $165,000 | $103 | 47 |
| 201 North St | 0.60mi | 3/2.0 | 1,297 (-14%) | 9mo | $53,000 | $41 | 41 |
| 802 Walnut | 0.63mi | 3/2.0 | 1,700 (+12%) | 14mo | $125,000 | $74 | 39 |
| 201 2nd St NW | 0.57mi | 3/2.0 | 1,685 (+11%) | 21mo | $87,500 | $52 | 38 |
| 114 7th St | 0.64mi | 3/2.0 | 1,319 (-13%) | 21mo | $55,000 | $42 | 31 |
Match score weights: distance 35% · size 25% · config 20% · recency 20%. Top-matched comps best support the ARV.
Projected returns pro-forma
3.57% appreciation · 3.0% rent growth · sell at horizon
- IRR
- 43.6%
- Equity multiple
- 3.51×
- Total profit
- $42,178
- Equity at exit
- $28,914
- IRR
- 42.9%
- Equity multiple
- 7.04×
- Total profit
- $101,529
- Equity at exit
- $46,126
Cash invested: $16,800 (down + closing). Projections, not guarantees.
Landlord ↔ Tenant lean methodology
- Overall (STATE)
- 90 Strongly Landlord-Friendly
- State Louisiana
- 90 Strongly Landlord-Friendly · R+12
- County
- — inherits STATE
- City
- — inherits STATE
ZIP-level market 71075
- Home prices YoY
- 4.1%
- Active inventory
- 44
- Price-to-rent
- 4.4×
Monthly cashflow live
- Estimated rent
- $1,148 medium interval (Pro) →
- Mortgage (P&I)
- −$315
- Tax from tax record
- −$47 /mo · $563/yr
- Insurance
- −$25
- HOA
- −$0
- Vacancy / Maint / Mgmt
- −$241
- Net cashflow
- $520
Break-even live
UW: 25.0% down · 7.5% · 30yr · 1.5% tax · 5.0% vac · 8.0% maint · 8.0% mgmt
Financing live
Cash to close
- Down payment
- $15,000
- Closing costs
- $1,800
- Reserves months
- —
- Total cash needed
- —
Loan-product check · same deal, 3 products live
Conventional
25% down · 7.5% · 30yr
- Down + closing
- —
- Monthly P&I
- —
- Monthly cashflow
- —
- DSCR
- —
- Eligible?
- —
Personal DTI + credit; lowest rate.
DSCR
20% down · 8.5% · 30yr
- Down + closing
- —
- Monthly P&I
- —
- Monthly cashflow
- —
- DSCR
- —
- Eligible?
- —
No personal income docs; deal must DSCR.
Hard money
10% down · 12.0% · 12mo
- Down + closing
- —
- Monthly P&I
- —
- Monthly cashflow
- —
- DSCR
- —
- Eligible?
- —
Short-term bridge; refi at stabilization.
Listing history 16 events
-
2026-06-18days on market $60,000 Active 30 DOM
-
2026-06-17days on market $60,000 Active 29 DOM
-
2026-06-16days on market $60,000 Active 28 DOM
-
2026-06-15days on market $60,000 Active 27 DOM
-
2026-06-14days on market $60,000 Active 25 DOM
-
2026-06-13days on market $60,000 Active 24 DOM
-
2026-06-10days on market $60,000 Active 22 DOM
-
2026-06-09days on market $60,000 Active 21 DOM
-
2026-06-08days on market $60,000 Active 20 DOM
-
2026-06-07days on market $60,000 Active 19 DOM
-
2026-06-02days on market $60,000 Active 14 DOM
-
2026-06-01days on market $60,000 Active 13 DOM
-
2026-05-31days on market $60,000 Active 12 DOM
-
2026-05-30days on market $60,000 Active 11 DOM
-
2026-05-19$60,000 Active
-
2005-05-10soldstatus $36,000
ⓘ Source: listings_history table (triggers on properties + properties_extension) + one-shot
backfill from property_details.listing_events for pre-trigger history.
Tax reassessment forecast LA · Resets to sale price
- Current annual tax
- $563 · $47/mo
- Projected year-2 tax
- $563 · $47/mo
- Expected delta
- $0/yr ($0/mo · 0.0%)
ⓘ Screening estimate from a state-policy table — verify with the county assessor before closing.
Climate risk First Street
- Flood 1/10 Low FEMA zone X (unshaded) · 0% chance over 30 yrs
- Wildfire 4/10 Moderate
- Heat 7/10 Severe 7 d/yr ≥111°F today · 22 d/yr by 30 yrs out
- Wind 6/10 Major 51% chance of damaging wind over 30 yrs
- Air quality 1/10 Low 0 unhealthy d/yr today · 0 by 30 yrs out
Nearby sold comps map
Loading sold comps map…
Walkable amenities ~0.75 mi
Loading nearby amenities…
Taxation est. · year 1
- Rental income
- $13,774
- − Mortgage interest
- −$3,361
- − Property taxes
- −$563
- − Insurance
- −$300
- − Repairs & maintenance
- −$1,102
- − Management
- −$1,102
- − Depreciation
- −$1,745
- Taxable income
- $5,600
- Est. tax owed @ 24.0%
- −$1,344
- After-tax cash flow
- $4,898/yr
For passive investors: Depreciation is non-cash, so a rental often shows a tax loss while cash-flowing — sheltering income. Rental losses are passive: they offset passive income freely, and up to $25,000/yr can offset ordinary (W-2) income if you actively participate and your MAGI is under $100k (phasing out to $0 by $150k); unused losses carry forward. On sale, claimed depreciation is recaptured at up to 25%, and gains may owe capital-gains tax (a 1031 exchange can defer both). Figures are a year-1 estimate at your 24.0% rate — not tax advice; consult a CPA.
Schools (NCES district)
- District
- Webster Parish
- NCES district ID
- 2201890
- Math proficiency
- 17% ▼ -39.00%
- Reading proficiency
- 26% ▼ -38.00%
- Median HH income
- $33,011
- Composite
- 17.5/100
- National rank
- #9055
- State rank
- #67 of 98 in LA
Livability — Springhill
- Score
- 65/100
- State rank
- #139
- US rank
- #12517
Category grades
Schools grade is shown separately in the Schools card above.
Census & demographics
- Census place
- Springhill, LA
- Population (ZIP)
- 5,417
Population outlook (Webster County) Hauer SSP2
- Today (2025)
- 37,736 people
- By 2030
- 36,203 · -4.1%
- By 2040
- 32,988 · -12.6%
- By 2050
- 29,743 · -21.2%
- By 2075
- 22,346 · -40.8%
- By 2100
- 15,045 · -60.1%
Race, ethnicity, and origin ACS 2023
- Neighborhood character
- Diverse neighborhood (Simpson 0.56)
- Race & ethnicity
- White 56% Black 34% Hispanic / Latino 6% Two or more races 2% Native American 2%
- Hispanic origin (detail)
- Mexican 4%
- Common ancestry
- Iranian 4% Slovak 3% Lithuanian 2%
- Foreign-born
- 1% · Canada
- Languages at home
- 99% English-only · French/Haitian/Cajun 1% Spanish 1%
Political lean MEDSL · Webster
- 2024 margin
- Solid R (+36.5) · D 31.2% · R 67.7% · Other 1.1%
- 2008→2024 swing
- -10.2pp toward R · 2008: -26.3pp · 2024: -36.5pp
- All cycles
- 2024: R+36.5 2020: R+31.1 2016: R+29.1 2012: R+25.0 2008: R+26.3
Not yet ingested
- Civics
- —
Market trends
- HPI YoY
- ▲ 3.57%
- Current HPI
- 90.8938
- Rent YoY
- —
- Metro
- —
- State GDP YoY
- ▲ 3.29%
- F500 in state
- 10
Industry mix (Fortune 500 HQ in LA)
| Industry | F500 HQs | Revenue |
|---|---|---|
| Telecommunications | 2 | $23B |
|
||
| Utilities | 1 | $12B |
|
||
| Wholesale / Distribution | 1 | $5B |
|
||
| Advertising | 1 | $2B |
|
||
Price history
+66.7% since first listed2 events — show timeline
- 2026-05-19 Listed $60,000 NTREIS
- 2005-05-10 Sold (Public Records) $36,000 Public Records
Property tax history
+2.4%/yrLatest (2025): $563 · +2.2% YoY. Source: county tax records.
Cash-flow waterfall
monthlySold comps — $/sqft
last 12 mo · ≤1 miLoading sold comps…