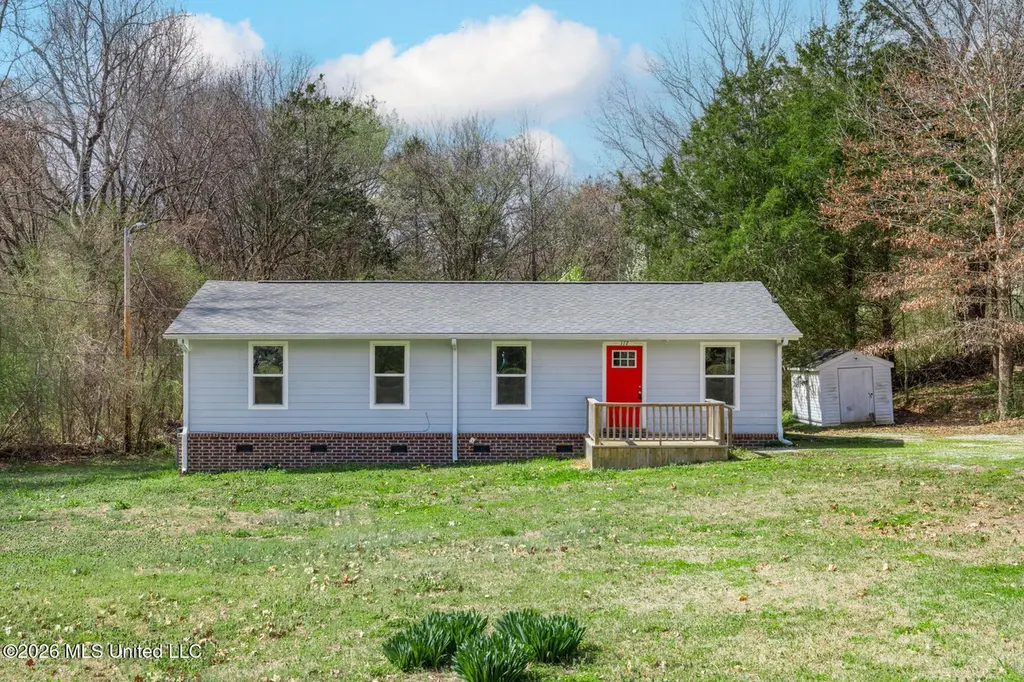
117 Interstate Hwy Farm Rd · Byhalia, MS
Flood risk 4/10 · Minor
- FEMA flood zone
- X (unshaded)
- Chance of flooding over 30 yrs
- 0.22%
- Est. flood insurance / yr
- $507 – $1,088
Fire risk 4/10 · Minor
- Est. fire insurance / yr
- $1,241 – $2,305
Heat risk 6/10 · Moderate
- Hot days now (above 109°F)
- 7 days/yr
- Hot days in 30 yrs
- 21 days/yr
Wind risk 4/10 · Minor
- Chance of severe wind over 30 yrs
- 18.0%
Air-quality risk 2/10 · Minimal
- Unhealthy air days now
- 2 days/yr
- Unhealthy air days in 30 yrs
- 2 days/yr
Risk factors via First Street. Map © Google.
Why this score? — see what drove the C- grade
The composite is a weighted blend of 9 inputs, each scored 0–100. Each bar is that input's sub-score; the figure is the points it added to the 100-point composite (weight × sub-score).
- Cash flow +17.0/30.0
- ARV discount +15.0/15.0
- DSCR +5.3/10.0
- 1% rule +3.8/10.0
- Livability +3.0/5.0
- Rent growth +2.5/5.0
- Condition / age +2.5/5.0
- Schools +1.8/10.0
- Appreciation +0.0/10.0
$240,000
🖨 Deal sheet (PDF) 📄 Offer letter ✓ Due diligence
Listing remarks
Enjoy privacy and room to grow on 3.62 acres in Byhalia, with future development nearby adding long-term value. Nearly every component of this home has been replaced within the last five years, including the roof, windows, gutters, HVAC, water heater, siding, exterior brick, decks, front door, flooring, paint, cabinets, appliances, countertops, tub surrounds, toilets, and vanities. Move-in ready with major updates already done.
Key facts
- Acreage
- Privacy
- Country living
Tags
Property features AI
Exterior
- Parking: Driveway
- Utilities: Public water; Septic tank; Cable available; Electricity connected; Water connected
- Home design: Single family residence (House); One level
- Construction: Vinyl exterior; Architectural shingle roof; Conventional foundation; Built (year per public records)
- Exterior features: Deck; Shed(s); Wooded lot with many trees
Interior
- Kitchen: Dishwasher; Microwave; Refrigerator
- Bathrooms: 2 full bathrooms
- Interior features: Dishwasher; Microwave; Refrigerator; Central heating; Central air
Neighborhood map
What this means for you Summary
Snapshot
- This is a 4-bed/1.0-bath single-family listed at $240k.
Deal economics
- At list price, monthly cash flow is $161 ($2k/yr) — positive.
- The deal already cash-flows at list — no discount required.
- To meet the 1% rule (rent ≥ 1% of price), the offer needs to be $210k (12.5% below list).
- Recommended offer: $210k (12.5% below list) — sets the bar for 1% rule.
- Cap rate 7.1% vs local median 2.9% in Byhalia — top-decile yield for the area; either an underpriced asset or a hidden risk that comps aren't pricing in. Stress-test before assuming the spread holds.
Location & tenants
- Location reads 60/100 on livability (#218 in MS) — a middle-class / working-renter tenant base. Strengths: crime A+, cost of living A+, housing B+; Watch: amenities F, commute F, employment F.
- Marshall County School District (rural): math 18% / reading 25% proficiency, ranked #87 of 130 in MS (top 67%) — low school quality limits family demand, transient renter base, plan for 1-2y turnover; 84% free/reduced lunch — lower-income household profile, screen leases tightly.
- Zoned schools: Byhalia Middle School (5-8) (math 18% / reading 24%, grade F, #112 of 179 statewide, top 64%, 444 students, 100% FRL) — zoned schools average 100% FRL vs 84% district-wide (16 pts higher); higher-poverty schools than district average — tighter screening recommended.
- Market conditions: 356 active listings in the ZIP; 1 comparable units currently listed for rent nearby; 310 units permitted in Marshall County in 2024 (0 in 5+ unit buildings).
Forward outlook
- Local home prices are declining (-3.0%/yr); year-one equity from $2k of loan paydown is wiped out by about $7k of value loss. Plan a longer hold.
- Marshall County population projected at -24% by 2050 — secular population decline; favor cash flow + early exit over multi-decade hold.
Negotiation context
- Only 11 days on market — expect competitive offers; lowballing is unlikely to land.
- 8 sale attempts since 4y ago with the ask held roughly flat each time — persistent listings suggest the price (not the market) is what's stuck; bring a comps-based counter.
- Current owner paid $44k; list at $240k implies a 445% gain — meaningful room to come down on a strong offer.
Risks & watch-outs
- Climate carrying-cost: extreme-heat days projected 7→21/yr by 2055 (HVAC capex compounding) — expect insurance premiums to compound above CPI over the hold.
Questions for the listing agent
- Is there a deadline driving the sale (1031 exchange, divorce, estate, relocation)? That informs how much negotiation room exists.
- Schools are F-rated, which usually means shorter tenancies and higher turnover. Who's the typical renter profile here, and what's been the actual vacancy rate?
- What's the average days-on-market for RENTAL listings here right now (not sales)? A rising rental-DOM trend means longer vacancies and softer asking-rent achievability than the comps imply.
- What's the recent tenant-quality profile in this submarket — average credit score on applications, eviction rate, late-payment / NSF rate, and stable-employment percentage? A property-management company in the area should have these aggregated.
- How much new for-sale + rental construction is in the pipeline within 1–3 miles? Heavy new supply typically softens prices + rents 12–24 months out; constrained supply supports both.
Investment metrics
- 1% rule
- 0.88% ✗
- Cap rate
- 7.10%
- Cash-on-cash
- 2.88%
- DSCR
- 1.13
- GRM
- 9.5
CMA / ARV
- ARV (median comp)
- $293,927
- List price
- $240,000
- Delta
- -16.65%
- Verdict
- UNDERPRICED
- Comps
- 3 within 1.0 mi
Projected returns pro-forma
-3.0% appreciation · 3.0% rent growth · sell at horizon
- IRR
- -11.8%
- Equity multiple
- 0.57×
- Total profit
- $-28,675
- Equity at exit
- $35,785
- IRR
- -2.7%
- Equity multiple
- 0.82×
- Total profit
- $-12,002
- Equity at exit
- $20,751
Cash invested: $67,200 (down + closing). Projections, not guarantees.
Landlord ↔ Tenant lean methodology
- Overall (STATE)
- 90 Strongly Landlord-Friendly
- State Mississippi
- 90 Strongly Landlord-Friendly · R+11
- County
- — inherits STATE
- City
- — inherits STATE
ZIP-level market 38611
- Home prices YoY
- -11.8%
- Active inventory
- 356
- Price-to-rent
- 9.5×
Monthly cashflow live
- Estimated rent
- $2,100 medium interval (Pro) →
- Mortgage (P&I)
- −$1,259
- Tax from tax record
- −$139 /mo · $1,668/yr
- Insurance
- −$100
- HOA
- −$0
- Vacancy / Maint / Mgmt
- −$441
- Net cashflow
- $161
Break-even live
Sensitivity live
| Price | -10% $297 | -5% $229 | +0% $161 | +5% $94 | +10% $26 |
|---|---|---|---|---|---|
| Rent | -10% $-4 | -5% $79 | +0% $161 | +5% $244 | +10% $327 |
| Rate | -1.0pp $282 | -0.5pp $222 | base $161 | +0.5pp $99 | +1.0pp $36 |
UW: 25.0% down · 7.5% · 30yr · 1.5% tax · 5.0% vac · 8.0% maint · 8.0% mgmt
Financing live
Cash to close
- Down payment
- $60,000
- Closing costs
- $7,200
- Reserves months
- —
- Total cash needed
- —
Loan-product check · same deal, 3 products live
Conventional
25% down · 7.5% · 30yr
- Down + closing
- —
- Monthly P&I
- —
- Monthly cashflow
- —
- DSCR
- —
- Eligible?
- —
Personal DTI + credit; lowest rate.
DSCR
20% down · 8.5% · 30yr
- Down + closing
- —
- Monthly P&I
- —
- Monthly cashflow
- —
- DSCR
- —
- Eligible?
- —
No personal income docs; deal must DSCR.
Hard money
10% down · 12.0% · 12mo
- Down + closing
- —
- Monthly P&I
- —
- Monthly cashflow
- —
- DSCR
- —
- Eligible?
- —
Short-term bridge; refi at stabilization.
Rent comps 1 comps
| Address | Beds | Baths | Sqft | Rent | $/sqft | DOM | Units | Dist |
|---|---|---|---|---|---|---|---|---|
| 56 Fox Hedge LN Byhalia, MS | 2.0–3.0 | 2.5 | 1486 | $2,100 | $1.41 | 3d | 8 | 0.80mi |
Listing history 28 events
-
2026-06-16statusdays on market $240,000 Pending 11 DOM
-
2026-06-15days on market $240,000 Active 10 DOM
-
2026-06-13days on market $240,000 Active 8 DOM
-
2026-06-10days on market $240,000 Active 5 DOM
-
2026-06-09days on market $240,000 Active 4 DOM
-
2026-06-08days on market $240,000 Active 3 DOM
-
2026-06-07pricedays on market $240,000 Active 2 DOM
-
2026-03-12historical $1,700
-
2026-03-09$245,000 Active 431-char remark
-
2026-01-03$1,700
-
2025-03-18historical $1,700
-
2025-02-04$1,700
-
2024-03-27historical
-
2023-11-02historical $1,600
-
2023-10-15price $229,900
-
2023-10-14$1,600
-
2023-08-31$245,000 Active
-
2022-09-26soldstatus
-
2022-09-22soldstatus Closed
-
2022-08-26status Pending
-
2022-08-23price $99,900
-
2022-07-15price $109,900
-
2022-07-15price $109,000
-
2022-07-08soldstatus
-
2022-07-05status Active
-
2022-06-25status Pending
-
2022-06-13$125,000 Active
-
1989-05-08soldstatus $44,000
ⓘ Source: listings_history table (triggers on properties + properties_extension) + one-shot
backfill from property_details.listing_events for pre-trigger history.
Tax reassessment forecast MS · Resets to sale price
- Current annual tax
- $1,668 · $139/mo
- Projected year-2 tax
- $1,896 · $158/mo
- Expected delta
- +$228/yr (+$19/mo · 13.7%)
ⓘ Screening estimate from a state-policy table — verify with the county assessor before closing.
Climate risk First Street
- Flood 4/10 Moderate FEMA zone X (unshaded) · 22% chance over 30 yrs
- Wildfire 4/10 Moderate
- Heat 6/10 Major 7 d/yr ≥109°F today · 21 d/yr by 30 yrs out
- Wind 4/10 Moderate 18% chance of damaging wind over 30 yrs
- Air quality 2/10 Low 2 unhealthy d/yr today · 2 by 30 yrs out
Nearby sold comps map
Loading sold comps map…
Walkable amenities ~0.75 mi
Loading nearby amenities…
Taxation est. · year 1
- Rental income
- $25,200
- − Mortgage interest
- −$13,444
- − Property taxes
- −$1,668
- − Insurance
- −$1,200
- − Repairs & maintenance
- −$2,016
- − Management
- −$2,016
- − Depreciation
- −$6,982
- Taxable loss
- −$2,125
- Est. tax savings @ 24.0%
- +$510
- After-tax cash flow
- $2,447/yr
For passive investors: Depreciation is non-cash, so a rental often shows a tax loss while cash-flowing — sheltering income. Rental losses are passive: they offset passive income freely, and up to $25,000/yr can offset ordinary (W-2) income if you actively participate and your MAGI is under $100k (phasing out to $0 by $150k); unused losses carry forward. On sale, claimed depreciation is recaptured at up to 25%, and gains may owe capital-gains tax (a 1031 exchange can defer both). Figures are a year-1 estimate at your 24.0% rate — not tax advice; consult a CPA.
Schools (NCES district)
- District
- Marshall County School District
- NCES district ID
- 2802850
- Math proficiency
- 18% ▼ -14.00%
- Reading proficiency
- 25% ▼ -8.00%
- Median HH income
- $39,333
- Composite
- 18.11/100
- National rank
- #8970
- State rank
- #87 of 130 in MS
Livability — Byhalia
- Score
- 60/100
- State rank
- #218
- US rank
- #18927
Category grades
Schools grade is shown separately in the Schools card above.
Census & demographics
- Census place
- Byhalia, MS
- City population
- 16,751
- Population (ZIP)
- 16,751
Population outlook (Marshall County) Hauer SSP2
- Today (2025)
- 33,542 people
- By 2030
- 31,983 · -4.6%
- By 2040
- 28,556 · -14.9%
- By 2050
- 25,352 · -24.4%
- By 2075
- 20,032 · -40.3%
- By 2100
- 16,738 · -50.1%
Race, ethnicity, and origin ACS 2023
- Neighborhood character
- Majority White (61%)
- Race & ethnicity
- White 61% Black 27% Hispanic / Latino 9% Two or more races 2%
- Hispanic origin (detail)
- Mexican 8%
- Common ancestry
- Serbian 2% Italian 2% Slovak 1%
- Foreign-born
- 4% · Canada
- Languages at home
- 90% English-only · Spanish 10%
Political lean MEDSL · Marshall
- 2024 margin
- Lean R (+7.3) · D 46.0% · R 53.2%
- 2008→2024 swing
- -25.5pp toward R · 2008: 18.2pp · 2024: -7.3pp
- All cycles
- 2024: R+7.3 2020: D+3.1 2016: D+9.7 2012: D+19.4 2008: D+18.2
Not yet ingested
- Civics
- —
Market trends
- HPI YoY
- ▼ -28.38%
- Current HPI
- 212.021
- Rent YoY
- —
- Metro
- —
- State GDP YoY
- —
- F500 in state
- 0
Price history
+445.5% since first listed24 events — show timeline
- 2026-06-16 Pending — MLSU
- 2026-06-05 Listed $240,000 MLSU
- 2026-05-26 Listing Removed — MLSU
- 2026-03-12 Rental Removed $1,700 MLSU
- 2026-03-09 Listed $245,000 MLSU
- 2026-01-03 Listed for Rent $1,700 MLSU
- 2025-03-18 Rental Removed $1,700 RENT.
- 2025-02-04 Listed for Rent $1,700 RENT.
- 2024-03-27 Listing Removed — MLSU
- 2023-11-02 Rental Removed $1,600 RENT.
- 2023-10-15 Price Changed $229,900 MLSU
- 2023-10-14 Listed for Rent $1,600 RENT.
- 2023-08-31 Listed $245,000 MLSU
- 2022-09-26 Sold (Public Records) — Public Records
- 2022-09-22 Sold (MLS) — MLSU
- 2022-08-26 Pending — MLSU
- 2022-08-23 Price Changed $99,900 MLSU
- 2022-07-15 Price Changed $109,900 MLSU
- 2022-07-15 Price Changed $109,000 MLSU
- 2022-07-08 Sold (Public Records) — Public Records
- 2022-07-05 Relisted — MLSU
- 2022-06-25 Pending — MLSU
- 2022-06-13 Listed $125,000 MLSU
- 1989-05-08 Sold (Public Records) $44,000 Public Records
Property tax history
-4.6%/yrLatest (2025): $1,668 · +12.6% YoY. Source: county tax records.
Cash-flow waterfall
monthlySold comps — $/sqft
last 12 mo · ≤1 miLoading sold comps…