 Duplex
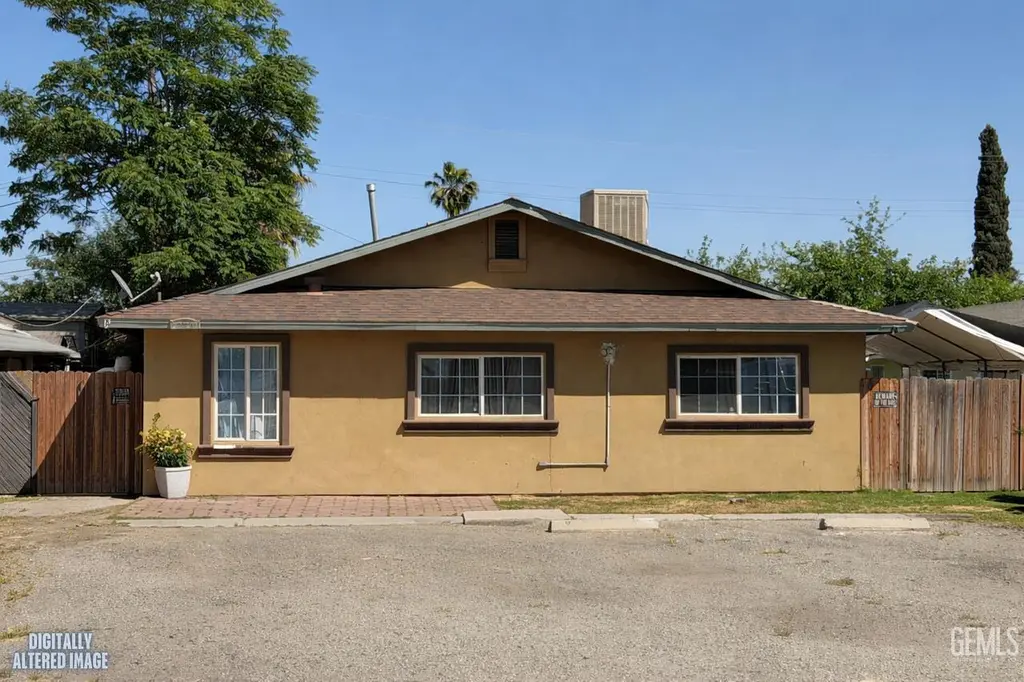
2320 Michael St · Bakersfield, CA
Flood risk 1/10 · Minimal
- FEMA flood zone
- X (unshaded)
- Chance of flooding over 30 yrs
- 0.0%
- Est. flood insurance / yr
- $507 – $1,088
Fire risk 6/10 · Moderate
- Est. fire insurance / yr
- $659 – $1,223
Heat risk 8/10 · Major
- Hot days now (above 105°F)
- 7 days/yr
- Hot days in 30 yrs
- 19 days/yr
Wind risk 1/10 · Minimal
- Chance of severe wind over 30 yrs
- —
Air-quality risk 10/10 · Severe
- Unhealthy air days now
- 33 days/yr
- Unhealthy air days in 30 yrs
- 37 days/yr
Risk factors via First Street. Map © Google.
Why this score? — see what drove the C- grade
The composite is a weighted blend of 9 inputs, each scored 0–100. Each bar is that input's sub-score; the figure is the points it added to the 100-point composite (weight × sub-score).
- Cash flow +18.1/30.0
- ARV discount +13.8/15.0
- DSCR +5.7/10.0
- 1% rule +4.4/10.0
- Rent growth +3.9/5.0
- Schools +3.4/10.0
- Livability +2.9/5.0
- Condition / age +2.5/5.0
- Appreciation +0.0/10.0
$387,000
🖨 Deal sheet 📄 Offer letter ✓ Due diligence
Multi-family units
County records classify this as Multi-Family (2-4 Unit). Listing-text estimate: 2 units. confirmed
Listing remarks MLS
Excellent investment opportunity in the heart of Bakersfield! This duplex at 2320 Michael St offers two spacious units, each featuring 3 bedrooms and 1 bathroom, perfect for generating strong rental income or accommodating multi-generational living. Each unit provides a functional layout with comfortable living spaces and convenient in-unit laundry hookups for added tenant appeal. The property offers separate living areas, making it ideal for owner-occupants looking to live in one unit while renting out the other, or for investors seeking a solid addition to their portfolio. Situated in an established neighborhood with easy access to schools, shopping, and major roadways, this duplex combines convenience and long-term value. Don't miss your chance to own a versatile income-producing property in a growing market!
Key facts
- 7,405 sq ft lot
- Built 1980
- Listed 70 days
Tags
Neighborhood map
What this means for you Summary
Snapshot
- This is a 2 × 3-bed/1.0-bath units multifamily listed at $387k.
Deal economics
- At list price, monthly cash flow is $341 ($4k/yr) — positive. Per door: $171/mo.
- The deal already cash-flows at list — no discount required.
- To meet the 1% rule (rent ≥ 1% of price), the offer needs to be $366k (5.5% below list).
- Recommended offer: $364k (6.0% below list) — sets the bar for market timing.
- Cap rate 7.4% vs local median 3.6% in Bakersfield — top-decile yield for the area; either an underpriced asset or a hidden risk that comps aren't pricing in. Stress-test before assuming the spread holds.
Location & tenants
- Location reads 58/100 on livability (#716 in CA) — a working-class tenant base; expect higher turnover. Strengths: housing A+; Watch: health & safety D, schools D-, crime F.
- Kern High (urban): math 21% / reading 51% proficiency, ranked #860 of 1,400 in CA (top 61%) — families likely to look elsewhere, expect single-tenant / working-renter base with shorter leases.
- Market conditions: Rents rising fast (+5.7%/yr); 311 active listings in the ZIP; 4 comparable units currently listed for rent nearby; rentals lingering (median 44d on market — plan ~5-8 weeks vacancy on turnover, expect pricing pressure); 50% of comp listings sitting > 30 days — soft ceiling on asking rent; 3,244 units permitted in Kern County in 2024 (73 in 5+ unit buildings).
- At $3,657/mo this rent would consume 78% of the median local household income ($56k/yr) (locally 3246% of renters already pay >50% of income on rent) — very limited rent-growth headroom before tenants either downsize or default.
Forward outlook
- Local home prices are declining (-3.0%/yr); year-one equity from $3k of loan paydown is wiped out by about $12k of value loss. Plan a longer hold.
- Kern County population projected at +17% by 2050 — long-run rental-demand tailwind backs the buy-and-hold thesis.
Negotiation context
- It's been on market 70 days — a 6% lower offer ($364k) is reasonable based on typical stale-listing flexibility.
- 4 sale attempts since 35y ago with the ask held roughly flat each time — persistent listings suggest the price (not the market) is what's stuck; bring a comps-based counter.
- Current owner paid $115k; list at $387k implies a 237% gain — meaningful room to come down on a strong offer.
Risks & watch-outs
- Climate carrying-cost: major wildfire risk; extreme-heat days projected 7→19/yr by 2055 (HVAC capex compounding) — expect insurance premiums to compound above CPI over the hold.
Questions for the listing agent
- It's been on market 70 days. Have you received any prior offers? Is the seller open to a 6% concession, seller financing, or rate buy-down credit?
- Can we see the unit-by-unit rent roll, current vacancy, and any below-market leases? What's the average tenancy length?
- What capital expenditures (roof, boiler, parking lot, exteriors) have been made in the last 5 years, and what's planned in the next 2?
- Why hasn't it sold? Are there any deal-killer items the seller is aware of (foundation, flood, title, zoning, code violations)?
- Is there a deadline driving the sale (1031 exchange, divorce, estate, relocation)? That informs how much negotiation room exists.
- Schools are D-rated, which usually means shorter tenancies and higher turnover. Who's the typical renter profile here, and what's been the actual vacancy rate?
- Crime grade is F in this area — have there been break-ins, vandalism, or insurance claims at this property in the last 3 years? What carrier currently insures it and at what premium?
- What's the average days-on-market for RENTAL listings here right now (not sales)? A rising rental-DOM trend means longer vacancies and softer asking-rent achievability than the comps imply.
- What's the recent tenant-quality profile in this submarket — average credit score on applications, eviction rate, late-payment / NSF rate, and stable-employment percentage? A property-management company in the area should have these aggregated.
- How much new apartment / multifamily construction is in the pipeline within 1–3 miles? Heavy new supply (>2% of stock underway) typically softens rents 12–24 months out; light construction supports rent growth.
Investment metrics
- 1% rule
- 0.94% ✗
- Cap rate
- 7.35%
- Cash-on-cash
- 3.78%
- DSCR
- 1.17
- GRM
- 8.8
CMA / ARV
- ARV (median comp)
- $449,964
- List price
- $387,000
- Delta
- -13.99%
- Verdict
- UNDERPRICED
- Comps
- 2 within 1.0 mi
Projected returns pro-forma
-3.0% appreciation · 5.71% rent growth · sell at horizon
- IRR
- -7.5%
- Equity multiple
- 0.72×
- Total profit
- $-30,754
- Equity at exit
- $57,703
- IRR
- 5.1%
- Equity multiple
- 1.42×
- Total profit
- $45,547
- Equity at exit
- $33,461
Cash invested: $108,360 (down + closing). Projections, not guarantees.
Landlord ↔ Tenant lean methodology
- Overall (STATE)
- 18 Strongly Tenant-Friendly
- State California
- 18 Strongly Tenant-Friendly · D+13
- County
- — inherits STATE
- City
- — inherits STATE
ZIP-level market 93307
- Rents YoY
- 5.7%
- Active inventory
- 311
- Price-to-rent
- 17.6×
Monthly cashflow live
- Estimated rent
- $3,657 high interval (Pro) →
- Mortgage (P&I)
- −$2,029
- Tax from tax record
- −$357 /mo · $4,284/yr
- Insurance
- −$161
- HOA
- −$0
- Vacancy / Maint / Mgmt
- −$768
- Net cashflow
- $341
Break-even live
2-unit breakdown (identical units grouped — click to expand)
| Units | Beds | Baths | Est. rent |
|---|---|---|---|
| 2× units | 3 | 1 | $3,656 |
| #1 | 3 | 1 | $1,828 |
| #2 | 3 | 1 | $1,828 |
| Total (2 units) | $3,657 | ||
UW: 25.0% down · 7.5% · 30yr · 1.5% tax · 5.0% vac · 8.0% maint · 8.0% mgmt
Financing live
Cash to close
- Down payment
- $96,750
- Closing costs
- $11,610
- Reserves months
- —
- Total cash needed
- —
Loan-product check · same deal, 3 products live
Conventional
25% down · 7.5% · 30yr
- Down + closing
- —
- Monthly P&I
- —
- Monthly cashflow
- —
- DSCR
- —
- Eligible?
- —
Personal DTI + credit; lowest rate.
DSCR
20% down · 8.5% · 30yr
- Down + closing
- —
- Monthly P&I
- —
- Monthly cashflow
- —
- DSCR
- —
- Eligible?
- —
No personal income docs; deal must DSCR.
Hard money
10% down · 12.0% · 12mo
- Down + closing
- —
- Monthly P&I
- —
- Monthly cashflow
- —
- DSCR
- —
- Eligible?
- —
Short-term bridge; refi at stabilization.
Rent comps 4 comps
| Address | Beds | Baths | Sqft | Rent | $/sqft | DOM | Units | Dist |
|---|---|---|---|---|---|---|---|---|
| 710 Chateau Ct Bakersfield, CA | 3.0 | 2.0 | 1729 | $2,200 | $1.27 | 43d | 1 | 0.83mi |
| 715 Houchin Rd Bakersfield, CA | 3.0 | 2.0 | 1650 | $2,150 | $1.30 | 43d | 1 | 1.35mi |
| 4513 Barry St Bakersfield, CA | 3.0 | 2.0 | 1492 | $1,975 | $1.32 | 2d | 1 | 1.43mi |
| 801 Oleander Ave Bakersfield, CA | 3.0 | 2.0 | 1700 | $2,480 | $1.46 | 2d | 1 | 1.45mi |
Listing history 26 events
-
2026-06-18days on market $387,000 Active 70 DOM
-
2026-06-17days on market $387,000 Active 69 DOM
-
2026-06-16days on market $387,000 Active 68 DOM
-
2026-06-15days on market $387,000 Active 67 DOM
-
2026-06-14days on market $387,000 Active 65 DOM
-
2026-06-10days on market $387,000 Active 62 DOM
-
2026-06-09days on market $387,000 Active 61 DOM
-
2026-06-08days on market $387,000 Active 60 DOM
-
2026-06-07pricedays on market $387,000 Active 59 DOM
-
2026-06-05days on market $395,000 Active 56 DOM
-
2026-06-03days on market $395,000 Active 55 DOM
-
2026-06-03days on market $395,000 Active 54 DOM
-
2026-06-01days on market $395,000 Active 53 DOM
-
2026-05-31days on market $395,000 Active 52 DOM
-
2026-04-09$395,000 Active 823-char remark
Show marketing remark (823 chars)
Excellent investment opportunity in the heart of Bakersfield! This duplex at 2320 Michael St offers two spacious units, each featuring 3 bedrooms and 1 bathroom, perfect for generating strong rental income or accommodating multi-generational living. Each unit provides a functional layout with comfortable living spaces and convenient in-unit laundry hookups for added tenant appeal. The property offers separate living areas, making it ideal for owner-occupants looking to live in one unit while renting out the other, or for investors seeking a solid addition to their portfolio. Situated in an established neighborhood with easy access to schools, shopping, and major roadways, this duplex combines convenience and long-term value. Don't miss your chance to own a versatile income-producing property in a growing market!
-
2026-04-02$399,000 Active
-
2015-08-28soldstatus $115,000
-
2015-08-10historical
-
2015-08-10price $129,900
-
2015-03-03$115,000
-
1994-10-31soldstatus $82,500
-
1992-04-06soldstatus $74,000
-
1992-03-10price $75,000
-
1992-03-10historical
-
1991-12-17$74,000
-
1989-03-22soldstatus $43,000
ⓘ Source: listings_history table (triggers on properties + properties_extension) + one-shot
backfill from property_details.listing_events for pre-trigger history.
Tax reassessment forecast CA · Resets to sale price
- Current annual tax
- $4,284 · $357/mo
- Projected year-2 tax
- $4,284 · $357/mo
- Expected delta
- $0/yr ($0/mo · 0.0%)
ⓘ Screening estimate from a state-policy table — verify with the county assessor before closing.
Climate risk First Street
- Flood 1/10 Low FEMA zone X (unshaded) · 0% chance over 30 yrs
- Wildfire 6/10 Major
- Heat 8/10 Severe 7 d/yr ≥105°F today · 19 d/yr by 30 yrs out
- Wind 1/10 Low
- Air quality 10/10 Extreme 33 unhealthy d/yr today · 37 by 30 yrs out
Nearby sold comps map
Loading sold comps map…
Walkable amenities ~0.75 mi
Loading nearby amenities…
Taxation est. · year 1
- Rental income
- $43,884
- − Mortgage interest
- −$21,678
- − Property taxes
- −$4,284
- − Insurance
- −$1,935
- − Repairs & maintenance
- −$3,511
- − Management
- −$3,511
- − Depreciation
- −$11,258
- Taxable loss
- −$2,293
- Est. tax savings @ 24.0%
- +$550
- After-tax cash flow
- $4,646/yr
For passive investors: Depreciation is non-cash, so a rental often shows a tax loss while cash-flowing — sheltering income. Rental losses are passive: they offset passive income freely, and up to $25,000/yr can offset ordinary (W-2) income if you actively participate and your MAGI is under $100k (phasing out to $0 by $150k); unused losses carry forward. On sale, claimed depreciation is recaptured at up to 25%, and gains may owe capital-gains tax (a 1031 exchange can defer both). Figures are a year-1 estimate at your 24.0% rate — not tax advice; consult a CPA.
Schools (NCES district)
- District
- Kern High
- NCES district ID
- 0619540
- Math proficiency
- 21% ▬ 0.00%
- Reading proficiency
- 51% ▲ 2.00%
- Median HH income
- $49,686
- Composite
- 33.68/100
- National rank
- #10443
- State rank
- #860 of 1400 in CA
Livability — Bakersfield
- Score
- 58/100
- State rank
- #716
- US rank
- #21355
Category grades
Schools grade is shown separately in the Schools card above.
Census & demographics
- County
- Kern County · 710,371 people
- City population
- 499,124
- Metro
- Bakersfield, CA
- Population (ZIP)
- 85,945
- Household income
- $56,446
- Rent vs Own
- Severe rent burden
- 3246.0
Population outlook (Kern County) Hauer SSP2
- Today (2025)
- 947,286 people
- By 2030
- 978,984 · +3.3%
- By 2040
- 1,045,018 · +10.3%
- By 2050
- 1,105,232 · +16.7%
- By 2075
- 1,229,538 · +29.8%
- By 2100
- 1,238,059 · +30.7%
Race, ethnicity, and origin ACS 2023
- Neighborhood character
- Predominantly Hispanic (80%)
- Race & ethnicity
- Hispanic / Latino 80% Two or more races 12% White 10% Black 6% Asian 3% Native American 1%
- Hispanic origin (detail)
- Mexican 73%
- Common ancestry
- Lithuanian 0%
- Foreign-born
- 31% · Canada
- Languages at home
- 28% English-only · Spanish 69% Other Indo-European 1% Arabic 1%
Political lean MEDSL · Kern
- 2024 margin
- Strong R (+21.1) · D 38.2% · R 59.3% · Other 2.5%
- 2008→2024 swing
- -3.3pp toward R · 2008: -17.8pp · 2024: -21.1pp
- All cycles
- 2024: R+21.1 2020: R+10.2 2016: R+15.0 2012: R+20.9 2008: R+17.8
Not yet ingested
- Civics
- —
Market trends
- HPI YoY
- ▼ -263.59%
- Current HPI
- 447.1746
- Rent YoY
- ▲ 5.71%
- Metro
- Bakersfield, CA
- State GDP YoY
- ▲ 3.21%
- F500 in state
- 116
Industry mix (Fortune 500 HQ in CA)
| Industry | F500 HQs | Revenue |
|---|---|---|
| Technology | 27 | $1,492B |
|
||
| Financial Services | 3 | $174B |
|
||
| Retail | 3 | $44B |
|
||
| Insurance | 3 | $26B |
|
||
| Media / Entertainment | 2 | $115B |
|
||
| Pharmaceuticals / Biotech | 2 | $62B |
|
||
Price history
+818.6% since first listed12 events — show timeline
- 2026-04-09 Listed $395,000 GEMLS
- 2026-04-02 Listed $399,000 GEMLS
- 2015-08-28 Sold (MLS) $115,000 GEMLS
- 2015-08-10 Price Changed $129,900 GEMLS
- 2015-08-10 Delisted — GEMLS
- 2015-03-03 Listed $115,000 GEMLS
- 1994-10-31 Sold (Public Records) $82,500 Public Records
- 1992-04-06 Sold (MLS) $74,000 GEMLS
- 1992-03-10 Delisted — GEMLS
- 1992-03-10 Price Changed $75,000 GEMLS
- 1991-12-17 Listed $74,000 GEMLS
- 1989-03-22 Sold (Public Records) $43,000 Public Records
Property tax history
+6.6%/yrLatest (2025): $4,284 · +2.4% YoY. Source: county tax records.
Cash-flow waterfall
monthlySold comps — $/sqft
last 12 mo · ≤1 miLoading sold comps…