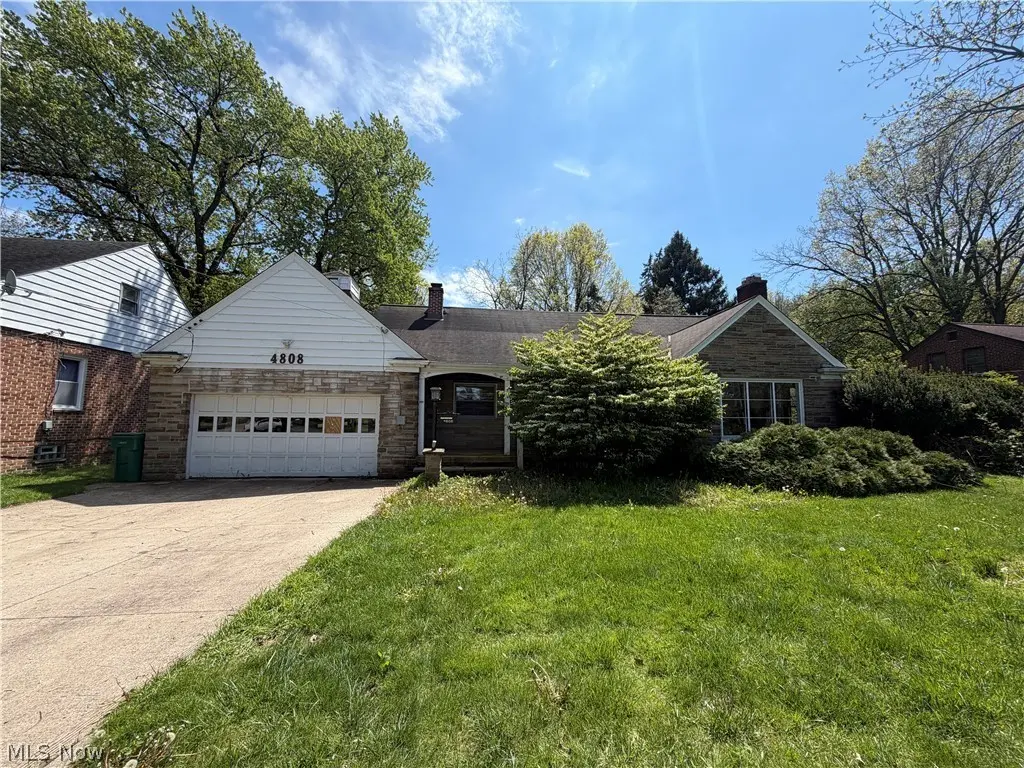
4808 Monticello Blvd · Richmond Heights, OH
Flood risk 1/10 · Minimal
- FEMA flood zone
- X (unshaded)
- Chance of flooding over 30 yrs
- 0.0%
- Est. flood insurance / yr
- $473 – $860
Fire risk 1/10 · Minimal
- Est. fire insurance / yr
- $713 – $1,323
Heat risk 2/10 · Minimal
- Hot days now (above 95°F)
- 7 days/yr
- Hot days in 30 yrs
- 16 days/yr
Wind risk 1/10 · Minimal
- Chance of severe wind over 30 yrs
- —
Air-quality risk 3/10 · Minor
- Unhealthy air days now
- 2 days/yr
- Unhealthy air days in 30 yrs
- 5 days/yr
Risk factors via First Street. Map © Google.
Why this score? — see what drove the C grade
The composite is a weighted blend of 9 inputs, each scored 0–100. Each bar is that input's sub-score; the figure is the points it added to the 100-point composite (weight × sub-score).
- Cash flow +19.4/30.0
- ARV discount +13.4/15.0
- 1% rule +6.2/10.0
- DSCR +6.1/10.0
- Livability +3.5/5.0
- Schools +3.1/10.0
- Rent growth +2.5/5.0
- Condition / age +2.5/5.0
- Appreciation +0.0/10.0
$195,000
🖨 Deal sheet (PDF) 📄 Offer letter ✓ Due diligence
Listing remarks MLS
Welcome to this gorgeous & Immaculately cared for 3 bed, 2.5 bath, with 2 car heated garage, Cape Cod. This home has an abundance of living space and every inch of it is pristine. First floor features a master with beautiful hardwood floors, large full bath has over-sized soaking tub and shower, updated kitchen with granite, dining room hardwood floors, amazingly spacious living room with wood burning fireplace, and large second bedroom. On the second level you will find a giant third bedroom with full bath, an office, a library and lots of storage space. The lower level features a large family room with fireplace and a wet bar, that is perfect for entertaining. Exterior features a large front porch, private back patio, storage shed and giant backyard.
Key facts
- 0.63 acre lot
- 3 garage spots
- Built 1952
Property features AI
Finance
- Financial info: Pets allowed
Exterior
- Parking: Attached garage; Three garage spaces; Driveway
- Utilities: Public water; Public sewer
- Home design: Two-story home; Owner-reported year built; Property listed as fixer
- Construction: Brick, frame and wood siding construction; Asphalt shingle roof
- Exterior features: Front porch; Patio; Lot approximately 0.63 acres
Interior
- Kitchen: Range
- Bedrooms: Two main-level bedrooms; Additional bedrooms on first and second levels
- Flooring: Hardwood flooring in multiple rooms
- Bathrooms: Two full bathrooms; One half bathroom; One main-level bathroom
- Heating & cooling: Central air conditioning; Forced air heating; Gas heating; Fireplace(s) for supplemental heat
- Interior features: See remarks; Full unfinished basement
- Laundry & utility: Laundry located in basement
Neighborhood map
What this means for you Summary
Snapshot
- This is a 3-bed/2.0-bath single-family listed at $195k.
Deal economics
- At list price, monthly cash flow is $217 ($3k/yr) — positive.
- The deal already cash-flows at list — no discount required.
- Meets the 1% rule at list price ($2k rent vs $195k).
- Recommended offer: $192k (1.5% below list) — sets the bar for market timing.
- Cap rate 7.6% vs local median 4.6% in Richmond Heights — top-decile yield for the area; either an underpriced asset or a hidden risk that comps aren't pricing in. Stress-test before assuming the spread holds.
Location & tenants
- Location reads 70/100 on livability (#471 in OH) — a middle-class / working-renter tenant base. Strengths: crime A+, cost of living A+, housing A; Watch: employment D+, health & safety D, amenities F.
- South Euclid-Lyndhurst City (suburban): math 23% / reading 45% proficiency, ranked #556 of 656 in OH (top 85%) — families likely to look elsewhere, expect single-tenant / working-renter base with shorter leases.
- Zoned schools: Sunview Elementary School (math 57% / reading 47%, grade C-, #851 of 1,584 statewide, top 56%, 359 students, 36% FRL); Memorial Junior High School (math 19% / reading 45%, grade F, #559 of 654 statewide, top 87%, 497 students, 51% FRL); Brush High School (math 32% / reading 47%, grade F, #528 of 781 statewide, top 71%, 1,041 students, 44% FRL) — zoned schools at 44% FRL track the district average.
- Market conditions: 98 active listings in the ZIP; 8 comparable units currently listed for rent nearby; rentals at typical pace (median 25d on market — plan ~3-4 weeks tenant-placement turnaround); solid renter incomes; 1,441 units permitted in Cuyahoga County in 2024 (700 in 5+ unit buildings).
- This rent runs 32% of the median local income ($81k/yr) — at the standard rent-burdened threshold; future hikes will face affordability resistance.
Forward outlook
- Local home prices are declining (-3.0%/yr); year-one equity from $1k of loan paydown is wiped out by about $6k of value loss. Plan a longer hold.
- Cuyahoga County population projected to shrink 8% by 2050 — rents likely to lag national; underwrite the cash flow, not the appreciation.
Negotiation context
- It's been on market 17 days — a 2% lower offer ($192k) is reasonable based on typical stale-listing flexibility.
- 7 sale attempts since 20y ago with the ask held roughly flat each time — persistent listings suggest the price (not the market) is what's stuck; bring a comps-based counter.
- Current owner paid $140k; 39% above their basis — modest negotiation headroom, anchor on the comps not their cost.
Risks & watch-outs
- Watch-outs: property tax is 2.5% of price; built in 1952 — expect roof / HVAC / electrical / plumbing capex.
Questions for the listing agent
- Built in 1952 — when were the roof, HVAC, electrical panel, plumbing, and water heater last replaced?
- Property tax is high relative to price — has the assessment been appealed recently, and will the sale trigger a re-assessment?
- Is there a deadline driving the sale (1031 exchange, divorce, estate, relocation)? That informs how much negotiation room exists.
- Schools are D-rated, which usually means shorter tenancies and higher turnover. Who's the typical renter profile here, and what's been the actual vacancy rate?
- What's the average days-on-market for RENTAL listings here right now (not sales)? A rising rental-DOM trend means longer vacancies and softer asking-rent achievability than the comps imply.
- What's the recent tenant-quality profile in this submarket — average credit score on applications, eviction rate, late-payment / NSF rate, and stable-employment percentage? A property-management company in the area should have these aggregated.
- How much new for-sale + rental construction is in the pipeline within 1–3 miles? Heavy new supply typically softens prices + rents 12–24 months out; constrained supply supports both.
Investment metrics
- 1% rule
- 1.12% ✓
- Cap rate
- 7.63%
- Cash-on-cash
- 4.77%
- DSCR
- 1.21
- GRM
- 7.4
CMA / ARV
- ARV (on-the-fly)
- $224,256
- Comps found
- 12
Show comp detail 12 sales within ~0.75 mi
| Address | Dist | Beds/Ba | Sqft | Sold | Price | $/sf | Match |
|---|---|---|---|---|---|---|---|
| 4785 Donald Ave | 0.13mi | 3/2.0 | 1,561 (+2%) | 6mo | $265,000 | $170 | 86 |
| 4876 Monticello Blvd | 0.28mi | 3/1.5 | 1,572 (+2%) | 1mo | $242,000 | $154 | 80 |
| 4742 Anderson Rd | 0.32mi | 3/1.5 | 1,540 (+0%) | 7mo | $197,500 | $128 | 77 |
| 4948 Anderson Rd | 0.34mi | 3/1.0 | 1,684 (+10%) | 3mo | $136,000 | $81 | 61 |
| 5163 Lynd Ave | 0.68mi | 3/2.0 | 1,496 (-3%) | 8mo | $240,000 | $160 | 58 |
| S/L 13 Queen Anne Ct | 0.38mi | 4/2.5 (+1) | 1,680 (+9%) | 6mo | $325,355 | $194 | 55 |
| 5012 S Barton Rd | 0.51mi | 2/1.5 (-1) | 1,413 (-8%) | 2mo | $207,000 | $146 | 54 |
| 4998 N Barton Rd | 0.46mi | 4/2.5 (+1) | 1,410 (-8%) | 5mo | $175,000 | $124 | 54 |
| 981 Hanley Rd | 0.36mi | 4/2.5 (+1) | 1,312 (-15%) | 6mo | $275,000 | $210 | 47 |
| 4784 Burger Rd | 0.73mi | 3/1.5 | 1,686 (+10%) | 2mo | $242,500 | $144 | 46 |
| 888 Richmond Rd | 0.49mi | 2/1.5 (-1) | 1,321 (-14%) | 1mo | $159,000 | $120 | 46 |
| 4776 Burger Rd | 0.73mi | 4/1.5 (+1) | 1,657 (+8%) | 1mo | $155,000 | $94 | 45 |
Match score weights: distance 35% · size 25% · config 20% · recency 20%. Top-matched comps best support the ARV.
Projected returns pro-forma
-3.0% appreciation · 3.0% rent growth · sell at horizon
- IRR
- -8.8%
- Equity multiple
- 0.68×
- Total profit
- $-17,644
- Equity at exit
- $29,075
- IRR
- 0.8%
- Equity multiple
- 1.05×
- Total profit
- $2,975
- Equity at exit
- $16,860
Cash invested: $54,600 (down + closing). Projections, not guarantees.
Landlord ↔ Tenant lean methodology
- Overall (STATE)
- 73 Landlord-Friendly
- State Ohio
- 73 Landlord-Friendly · R+6
- County
- — inherits STATE
- City
- — inherits STATE
ZIP-level market 44143
- Active inventory
- 98
- Price-to-rent
- 7.4×
Monthly cashflow live
- Estimated rent
- $2,187 high interval (Pro) →
- Mortgage (P&I)
- −$1,023
- Tax from tax record
- −$407 /mo · $4,884/yr
- Insurance
- −$81
- HOA
- −$0
- Vacancy / Maint / Mgmt
- −$459
- Net cashflow
- $217
Break-even live
Sensitivity live
| Price | -10% $327 | -5% $272 | +0% $217 | +5% $162 | +10% $107 |
|---|---|---|---|---|---|
| Rent | -10% $44 | -5% $131 | +0% $217 | +5% $303 | +10% $390 |
| Rate | -1.0pp $315 | -0.5pp $267 | base $217 | +0.5pp $166 | +1.0pp $115 |
UW: 25.0% down · 7.5% · 30yr · 1.5% tax · 5.0% vac · 8.0% maint · 8.0% mgmt
Financing live
Cash to close
- Down payment
- $48,750
- Closing costs
- $5,850
- Reserves months
- —
- Total cash needed
- —
Loan-product check · same deal, 3 products live
Conventional
25% down · 7.5% · 30yr
- Down + closing
- —
- Monthly P&I
- —
- Monthly cashflow
- —
- DSCR
- —
- Eligible?
- —
Personal DTI + credit; lowest rate.
DSCR
20% down · 8.5% · 30yr
- Down + closing
- —
- Monthly P&I
- —
- Monthly cashflow
- —
- DSCR
- —
- Eligible?
- —
No personal income docs; deal must DSCR.
Hard money
10% down · 12.0% · 12mo
- Down + closing
- —
- Monthly P&I
- —
- Monthly cashflow
- —
- DSCR
- —
- Eligible?
- —
Short-term bridge; refi at stabilization.
Rent comps 8 comps
| Address | Beds | Baths | Sqft | Rent | $/sqft | DOM | Units | Dist |
|---|---|---|---|---|---|---|---|---|
| 4456 Donna Dr Richmond Heights, OH | 3.0 | 2.5 | 1940 | $2,295 | $1.18 | 3d | 1 | 0.83mi |
| 4994 N Sedgewick Rd Cleveland, OH | 3.0 | 1.5 | 1400 | $3,000 | $2.14 | 45d | 1 | 0.85mi |
| 4409 Adrian Rd Cleveland, OH | 4.0 | 2.5 | 1542 | $1,855 | $1.20 | 3d | 1 | 0.99mi |
| 963 Chelston Rd Cleveland, OH | 4.0 | 2.0 | 1974 | $1,950 | $0.99 | 45d | 1 | 1.08mi |
| 1344 S Green Rd Cleveland, OH | 3.0 | 1.0 | 1076 | $1,150 | $1.07 | 17d | 1 | 1.30mi |
| 1270 Roland Rd Cleveland, OH | 4.0 | 2.0 | 1720 | $2,450 | $1.42 | 45d | 1 | 1.30mi |
| 1207 Churchill Rd Cleveland, OH | 3.0 | 2.0 | 1134 | $1,895 | $1.67 | 25d | 1 | 1.33mi |
| 303 S Green Rd Cleveland, OH | 4.0 | 2.0 | 1381 | $1,700 | $1.23 | 3d | 1 | 1.39mi |
Listing history 15 events
-
2026-06-21days on market $195,000 Active 17 DOM
-
2026-06-18days on market $195,000 Active 14 DOM
-
2026-06-17days on market $195,000 Active 13 DOM
-
2026-06-16days on market $195,000 Active 12 DOM
-
2026-06-15days on market $195,000 Active 11 DOM
-
2026-06-13days on market $195,000 Active 9 DOM
-
2026-06-13status $195,000 Active 8 DOM
-
2026-06-09status $195,000 Pending 8 DOM
-
2026-06-08days on market $195,000 Active 8 DOM
-
2026-06-07days on market $195,000 Active 7 DOM
-
2026-06-05days on market $195,000 Active 4 DOM
-
2026-06-03days on market $195,000 Active 3 DOM
-
2026-06-02days on market $195,000 Active 2 DOM
-
2026-06-01remarks 132-char remark
-
2026-06-01$195,000 Active 1 DOM
ⓘ Source: listings_history table (triggers on properties + properties_extension) + one-shot
backfill from property_details.listing_events for pre-trigger history.
Tax reassessment forecast OH · Partial reset (capped growth)
- Current annual tax
- $4,884 · $407/mo
- Projected year-2 tax
- $4,884 · $407/mo
- Expected delta
- $0/yr ($0/mo · 0.0%)
ⓘ Screening estimate from a state-policy table — verify with the county assessor before closing.
Climate risk First Street
- Flood 1/10 Low FEMA zone X (unshaded) · 0% chance over 30 yrs
- Wildfire 1/10 Low
- Heat 2/10 Low 7 d/yr ≥95°F today · 16 d/yr by 30 yrs out
- Wind 1/10 Low
- Air quality 3/10 Moderate 2 unhealthy d/yr today · 5 by 30 yrs out
Nearby sold comps map
Loading sold comps map…
Walkable amenities ~0.75 mi
Loading nearby amenities…
Taxation est. · year 1
- Rental income
- $26,245
- − Mortgage interest
- −$10,923
- − Property taxes
- −$4,884
- − Insurance
- −$975
- − Repairs & maintenance
- −$2,100
- − Management
- −$2,100
- − Depreciation
- −$5,673
- Taxable loss
- −$408
- Est. tax savings @ 24.0%
- +$98
- After-tax cash flow
- $2,702/yr
For passive investors: Depreciation is non-cash, so a rental often shows a tax loss while cash-flowing — sheltering income. Rental losses are passive: they offset passive income freely, and up to $25,000/yr can offset ordinary (W-2) income if you actively participate and your MAGI is under $100k (phasing out to $0 by $150k); unused losses carry forward. On sale, claimed depreciation is recaptured at up to 25%, and gains may owe capital-gains tax (a 1031 exchange can defer both). Figures are a year-1 estimate at your 24.0% rate — not tax advice; consult a CPA.
Schools (NCES district)
- District
- South Euclid-Lyndhurst City
- NCES district ID
- 3904479
- Math proficiency
- 23% ▼ -22.00%
- Reading proficiency
- 45% ▼ -11.00%
- Median HH income
- $61,244
- Composite
- 30.51/100
- National rank
- #6212
- State rank
- #556 of 656 in OH
Livability — Richmond Heights
- Score
- 70/100
- State rank
- #471
- US rank
- #7847
Category grades
Schools grade is shown separately in the Schools card above.
Census & demographics
- Census place
- Richmond Heights, OH
- County
- Cuyahoga County · 1,090,369 people
- Metro
- Cleveland-Elyria, OH
- Population (ZIP)
- 24,597
- Household income
- $81,268
- Rent vs Own
- Severe rent burden
- 656.0
Population outlook (Cuyahoga County) Hauer SSP2
- Today (2025)
- 1,244,621 people
- By 2030
- 1,230,093 · -1.2%
- By 2040
- 1,189,108 · -4.5%
- By 2050
- 1,145,706 · -7.9%
- By 2075
- 1,076,557 · -13.5%
- By 2100
- 978,987 · -21.3%
Race, ethnicity, and origin ACS 2023
- Neighborhood character
- Diverse neighborhood (Simpson 0.57)
- Race & ethnicity
- White 56% Black 34% Two or more races 5% Asian 3% Hispanic / Latino 3%
- Common ancestry
- Romanian 4% Scotch-Irish 2% Subsaharan African 2%
- Foreign-born
- 9% · Canada
- Languages at home
- 86% English-only · Russian/Polish/Slavic 3% Other Indo-European 3% Spanish 3%
Political lean MEDSL · Cuyahoga
- 2024 margin
- Solid D (+31.5) · D 65.4% · R 33.9%
- 2008→2024 swing
- -7.4pp toward R · 2008: 38.9pp · 2024: 31.5pp
- All cycles
- 2024: D+31.5 2020: D+34.1 2016: D+35.0 2012: D+38.7 2008: D+38.9
Not yet ingested
- Civics
- —
Market trends
- HPI YoY
- ▼ -123.55%
- Current HPI
- 167.6083
- Rent YoY
- —
- Metro
- Cleveland-Elyria, OH
- State GDP YoY
- ▲ 1.98%
- F500 in state
- 48
Industry mix (Fortune 500 HQ in OH)
| Industry | F500 HQs | Revenue |
|---|---|---|
| Insurance | 3 | $145B |
|
||
| Industrial Machinery | 3 | $49B |
|
||
| Financial Services | 3 | $24B |
|
||
| Consumer Goods | 2 | $93B |
|
||
| Aerospace / Defense | 2 | $47B |
|
||
| Utilities | 2 | $33B |
|
||
Price history
+343.2% since first listed17 events — show timeline
- 2026-05-30 Listed $195,000 MLSNOW
- 2025-07-23 Listing Removed — MLSNOW
- 2025-07-17 Listed $225,000 MLSNOW
- 2015-04-24 Sold (Public Records) $140,000 Public Records
- 2015-04-24 Sold (MLS) $140,000 MLSNOW
- 2015-04-02 Pending — MLSNOW
- 2015-03-04 Listed — MLSNOW
- 2014-10-11 Listing Removed — MLSNOW
- 2014-07-11 Listed $145,000 MLSNOW
- 2011-12-15 Listing Removed — MLSNOW
- 2011-06-15 Listed $165,900 MLSNOW
- 2011-04-27 Listing Removed — MLSNOW
- 2011-01-27 Listed $179,900 MLSNOW
- 2006-09-28 Sold (Public Records) $135,000 Public Records
- 2006-09-28 Sold (MLS) $135,000 MLSNOW
- 2006-03-14 Listed $144,000 MLSNOW
- 1973-11-01 Sold (Public Records) $44,000 Public Records
Property tax history
+5.7%/yrLatest (2025): $4,884 · +10.4% YoY. Source: county tax records.
Cash-flow waterfall
monthlySold comps — $/sqft
last 12 mo · ≤1 miLoading sold comps…