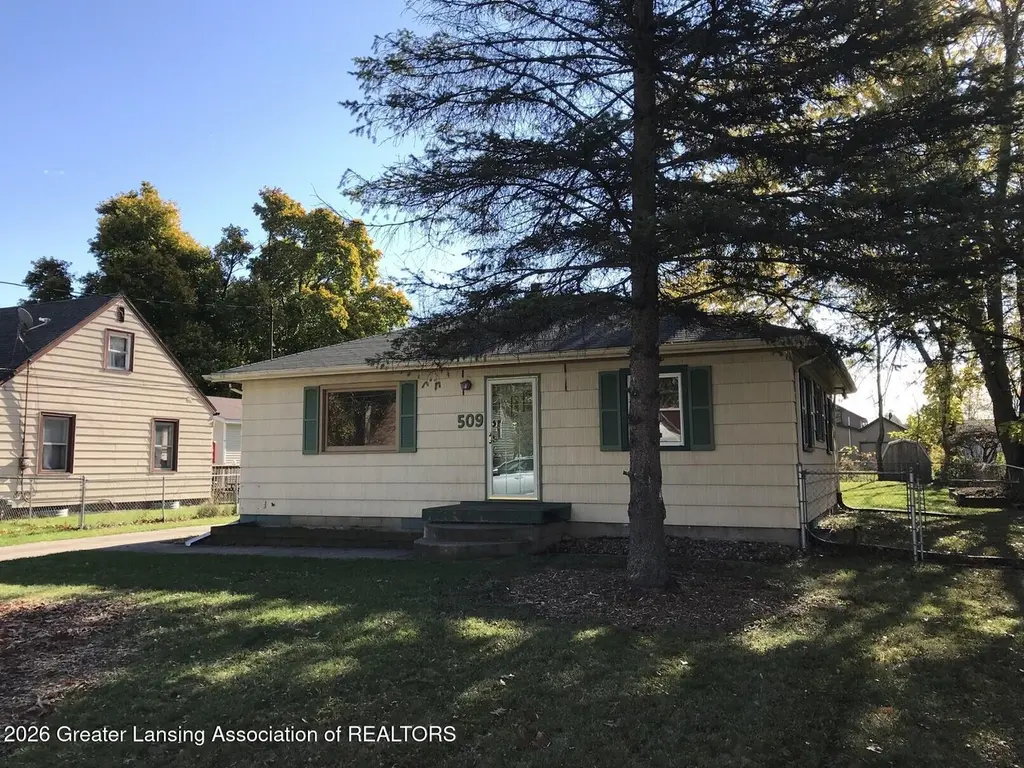
509 W Paulson St · Lansing, MI
Flood risk 1/10 · Minimal
- FEMA flood zone
- X (unshaded)
- Chance of flooding over 30 yrs
- 0.0%
- Est. flood insurance / yr
- $473 – $860
Fire risk 1/10 · Minimal
- Est. fire insurance / yr
- $784 – $1,456
Heat risk 2/10 · Minimal
- Hot days now (above 97°F)
- 7 days/yr
- Hot days in 30 yrs
- 15 days/yr
Wind risk 2/10 · Minimal
- Chance of severe wind over 30 yrs
- —
Air-quality risk 2/10 · Minimal
- Unhealthy air days now
- 1 days/yr
- Unhealthy air days in 30 yrs
- 2 days/yr
Risk factors via First Street. Map © Google.
Why this score? — see what drove the C+ grade
The composite is a weighted blend of 9 inputs, each scored 0–100. Each bar is that input's sub-score; the figure is the points it added to the 100-point composite (weight × sub-score).
- Cash flow +21.4/30.0
- ARV discount +14.4/15.0
- DSCR +6.8/10.0
- Rent growth +5.0/5.0
- 1% rule +4.4/10.0
- Livability +4.0/5.0
- Condition / age +2.5/5.0
- Schools +1.9/10.0
- Appreciation +0.0/10.0
$139,900
🖨 Deal sheet 📄 Offer letter ✓ Due diligence
Listing remarks MLS
Welcome to 509 W Paulson in Lansing! This well-maintained home offers a functional layout with comfortable living space, spacious bedrooms, and great natural light throughout. The property features a large yard with plenty of room for entertaining, pets, or outdoor activities. Conveniently located near shopping, restaurants, schools, parks, and major highways, this home provides both comfort and convenience. Whether you're a first-time buyer, downsizing, or looking for an investment opportunity, this property has great potential. Don't miss your chance to make this home your own!
Key facts
- Large yard
- Natural light
- Conveniently located
Tags
Property features AI
Finance
- Other: Property suitable for rental, primary residence, or investment (current uses listed)
- HOA & community: No homeowners association
Exterior
- Parking: Driveway parking; Detached garage not present; 2 garage spaces (garage not attached)
- Utilities: Electric: fuses; Public sewer; Cable available
- Home design: Single-story home; Built in 1955; City street frontage; Living area noted (internal record)
- Construction: Aluminum siding; Block foundation; Shingle roof
- Exterior features: Partial fencing; Insulated windows; No community or exterior-specific amenities listed; No patio or porch listed
Interior
- Kitchen: Kitchen with standard appliances: Dishwasher, Oven, Range, Refrigerator
- Bedrooms: 2 bedrooms (Primary Bedroom, Bedroom 2)
- Flooring: Wood and other flooring
- Bathrooms: 2 full bathrooms
- Heating & cooling: Forced air heating; No cooling
- Interior features: Dishwasher, Oven, Range, Refrigerator; Partially finished basement; No fireplace; Washer hookup
- Laundry & utility: Washer hookup
Neighborhood map
What this means for you Summary
Snapshot
- This is a 2-bed/1.0-bath single-family listed at $140k.
Deal economics
- At list price, monthly cash flow is $207 ($2k/yr) — positive.
- The deal already cash-flows at list — no discount required.
- To meet the 1% rule (rent ≥ 1% of price), the offer needs to be $132k (5.7% below list).
- Recommended offer: $132k (5.7% below list) — sets the bar for 1% rule.
- Cap rate 8.1% vs local median 6.0% in Lansing — top-decile yield for the area; either an underpriced asset or a hidden risk that comps aren't pricing in. Stress-test before assuming the spread holds.
Location & tenants
- Location reads 79/100 on livability (#94 in MI, #2,182 nationally) — a middle-class / working-renter tenant base. Strengths: amenities A+, commute A+, cost of living A+; Watch: employment D, schools F, crime F.
- Lansing Public School District (urban): math 14% / reading 23% proficiency, ranked #650 of 760 in MI (top 86%) — low school quality limits family demand, transient renter base, plan for 1-2y turnover; 68% free/reduced lunch — lower-income household profile, screen leases tightly.
- Market conditions: Rents rising fast (+10.5%/yr); 138 active listings in the ZIP; 2 comparable units currently listed for rent nearby; 350 units permitted in Ingham County in 2024 (186 in 5+ unit buildings).
Forward outlook
- Local home prices are declining (-3.0%/yr); year-one equity from $967 of loan paydown is wiped out by about $4k of value loss. Plan a longer hold.
- Ingham County population projected at +11% by 2050 — modest demand growth; plan on rents tracking national, not racing it.
- At projected returns (-3.0% appreciation + 8.0% rent growth), your $39k cash investment doubles in ~9 years — after that, you're playing with house money.
Negotiation context
- It's been on market 23 days — a 2% lower offer ($138k) is reasonable based on typical stale-listing flexibility.
- 6 sale attempts since 9y ago with the ask held roughly flat each time — persistent listings suggest the price (not the market) is what's stuck; bring a comps-based counter.
- Current owner paid $110k; 27% above their basis — modest negotiation headroom, anchor on the comps not their cost.
Risks & watch-outs
- Watch-outs: built in 1955 — expect roof / HVAC / electrical / plumbing capex.
Questions for the listing agent
- Built in 1955 — when were the roof, HVAC, electrical panel, plumbing, and water heater last replaced?
- Is there a deadline driving the sale (1031 exchange, divorce, estate, relocation)? That informs how much negotiation room exists.
- Schools are F-rated, which usually means shorter tenancies and higher turnover. Who's the typical renter profile here, and what's been the actual vacancy rate?
- Crime grade is F in this area — have there been break-ins, vandalism, or insurance claims at this property in the last 3 years? What carrier currently insures it and at what premium?
- What's the average days-on-market for RENTAL listings here right now (not sales)? A rising rental-DOM trend means longer vacancies and softer asking-rent achievability than the comps imply.
- What's the recent tenant-quality profile in this submarket — average credit score on applications, eviction rate, late-payment / NSF rate, and stable-employment percentage? A property-management company in the area should have these aggregated.
- How much new for-sale + rental construction is in the pipeline within 1–3 miles? Heavy new supply typically softens prices + rents 12–24 months out; constrained supply supports both.
Investment metrics
- 1% rule
- 0.94% ✗
- Cap rate
- 8.07%
- Cash-on-cash
- 6.34%
- DSCR
- 1.28
- GRM
- 8.8
CMA / ARV
- ARV (on-the-fly)
- $165,152
- Comps found
- 11
Show comp detail 11 sales within ~0.75 mi
| Address | Dist | Beds/Ba | Sqft | Sold | Price | $/sf | Match |
|---|---|---|---|---|---|---|---|
| 310 W Frederick Ave | 0.28mi | 3/2.0 (+1) | 1,440 (-9%) | 1mo | $142,000 | $99 | 61 |
| 2508 Gary Ave | 0.56mi | 3/1.0 (+1) | 1,614 (+2%) | 11mo | $100,000 | $62 | 57 |
| 228 Lynwood Circle Cir | 0.41mi | 3/1.5 (+1) | 1,529 (-4%) | 17mo | $181,000 | $118 | 54 |
| 709 Sadie Ct | 0.68mi | 3/1.5 (+1) | 1,562 (-2%) | 14mo | $225,000 | $144 | 46 |
| 700 Sadie Ct | 0.63mi | 2/2.0 | 1,548 (-2%) | 23mo | $184,500 | $119 | 43 |
| 218 W Thomas St | 0.47mi | 3/1.0 (+1) | 1,371 (-14%) | 11mo | $142,000 | $104 | 41 |
| 1523 Biltmore Blvd | 0.72mi | 3/1.5 (+1) | 1,512 (-5%) | 15mo | $85,000 | $56 | 39 |
| 200 Mosley Ave | 0.64mi | 3/2.0 (+1) | 1,380 (-13%) | 1mo | $157,500 | $114 | 38 |
| 514 Chilson Ave | 0.70mi | 2/2.0 | 1,512 (-5%) | 24mo | $147,000 | $97 | 36 |
| 3005 N Cedar St | 0.60mi | 3/2.0 (+1) | 1,352 (-15%) | 6mo | $219,900 | $163 | 33 |
| 518 Chilson Ave | 0.71mi | 3/2.0 (+1) | 1,448 (-9%) | 14mo | $150,000 | $104 | 32 |
Match score weights: distance 35% · size 25% · config 20% · recency 20%. Top-matched comps best support the ARV.
Projected returns pro-forma
-3.0% appreciation · 8.0% rent growth · sell at horizon
- IRR
- -1.7%
- Equity multiple
- 0.93×
- Total profit
- $-2,577
- Equity at exit
- $20,860
- IRR
- 12.3%
- Equity multiple
- 2.18×
- Total profit
- $46,220
- Equity at exit
- $12,096
Cash invested: $39,172 (down + closing). Projections, not guarantees.
Landlord ↔ Tenant lean methodology
- Overall (STATE)
- 62 Landlord-Friendly
- State Michigan
- 62 Landlord-Friendly · EVEN
- County
- — inherits STATE
- City
- — inherits STATE
ZIP-level market 48906
- Rents YoY
- 10.5%
- Active inventory
- 138
- Price-to-rent
- 8.8×
Monthly cashflow live
- Estimated rent
- $1,320 medium interval (Pro) →
- Mortgage (P&I)
- −$734
- Tax from tax record
- −$44 /mo · $523/yr
- Insurance
- −$58
- HOA
- −$0
- Vacancy / Maint / Mgmt
- −$277
- Net cashflow
- $207
Break-even live
UW: 25.0% down · 7.5% · 30yr · 1.5% tax · 5.0% vac · 8.0% maint · 8.0% mgmt
Financing live
Cash to close
- Down payment
- $34,975
- Closing costs
- $4,197
- Reserves months
- —
- Total cash needed
- —
Loan-product check · same deal, 3 products live
Conventional
25% down · 7.5% · 30yr
- Down + closing
- —
- Monthly P&I
- —
- Monthly cashflow
- —
- DSCR
- —
- Eligible?
- —
Personal DTI + credit; lowest rate.
DSCR
20% down · 8.5% · 30yr
- Down + closing
- —
- Monthly P&I
- —
- Monthly cashflow
- —
- DSCR
- —
- Eligible?
- —
No personal income docs; deal must DSCR.
Hard money
10% down · 12.0% · 12mo
- Down + closing
- —
- Monthly P&I
- —
- Monthly cashflow
- —
- DSCR
- —
- Eligible?
- —
Short-term bridge; refi at stabilization.
Rent comps 2 comps
| Address | Beds | Baths | Sqft | Rent | $/sqft | DOM | Units | Dist |
|---|---|---|---|---|---|---|---|---|
| 1561 Massachusetts Ave Lansing, MI | 3.0 | 2.0 | 1100 | $1,400 | $1.27 | 43d | 1 | 1.41mi |
| 919 Princeton Ave Lansing, MI | 3.0 | 1.5 | 1119 | $1,475 | $1.32 | 21d | 1 | 1.42mi |
Listing history 28 events
-
2026-06-18days on market $139,900 Active 23 DOM
-
2026-06-17days on market $139,900 Active 22 DOM
-
2026-06-16days on market $139,900 Active 21 DOM
-
2026-06-15days on market $139,900 Active 20 DOM
-
2026-06-14days on market $139,900 Active 18 DOM
-
2026-06-13days on market $139,900 Active 17 DOM
-
2026-06-10days on market $139,900 Active 15 DOM
-
2026-06-09days on market $139,900 Active 14 DOM
-
2026-06-08days on market $139,900 Active 13 DOM
-
2026-06-07days on market $139,900 Active 12 DOM
-
2026-06-05days on market $139,900 Active 9 DOM
-
2026-06-03days on market $139,900 Active 8 DOM
-
2026-06-02days on market $139,900 Active 7 DOM
-
2026-06-01days on market $139,900 Active 6 DOM
-
2026-05-31days on market $139,900 Active 5 DOM
-
2026-05-30days on market $139,900 Active 4 DOM
-
2026-05-26$139,900 Active 586-char remark
Show marketing remark (586 chars)
Welcome to 509 W Paulson in Lansing! This well-maintained home offers a functional layout with comfortable living space, spacious bedrooms, and great natural light throughout. The property features a large yard with plenty of room for entertaining, pets, or outdoor activities. Conveniently located near shopping, restaurants, schools, parks, and major highways, this home provides both comfort and convenience. Whether you're a first-time buyer, downsizing, or looking for an investment opportunity, this property has great potential. Don't miss your chance to make this home your own!
-
2026-05-26$139,900 Active
Show marketing remark (586 chars)
Welcome to 509 W Paulson in Lansing! This well-maintained home offers a functional layout with comfortable living space, spacious bedrooms, and great natural light throughout. The property features a large yard with plenty of room for entertaining, pets, or outdoor activities. Conveniently located near shopping, restaurants, schools, parks, and major highways, this home provides both comfort and convenience. Whether you're a first-time buyer, downsizing, or looking for an investment opportunity, this property has great potential. Don't miss your chance to make this home your own!
-
2023-12-20historical $1,150
-
2023-12-07price $1,150
-
2023-11-23$1,200
-
2023-11-12historical $1,200
-
2023-09-08$1,200
-
2017-10-23historical
-
2017-10-23historical
-
2017-05-11$36,960
-
2017-05-11$36,960
-
2005-03-07soldstatus $110,000
ⓘ Source: listings_history table (triggers on properties + properties_extension) + one-shot
backfill from property_details.listing_events for pre-trigger history.
Tax reassessment forecast MI · Partial reset (capped growth)
- Current annual tax
- $523 · $44/mo
- Projected year-2 tax
- $1,339 · $112/mo
- Expected delta
- +$816/yr (+$68/mo · 155.9%)
ⓘ Screening estimate from a state-policy table — verify with the county assessor before closing.
Climate risk First Street
- Flood 1/10 Low FEMA zone X (unshaded) · 0% chance over 30 yrs
- Wildfire 1/10 Low
- Heat 2/10 Low 7 d/yr ≥97°F today · 15 d/yr by 30 yrs out
- Wind 2/10 Low
- Air quality 2/10 Low 1 unhealthy d/yr today · 2 by 30 yrs out
Nearby sold comps map
Loading sold comps map…
Walkable amenities ~0.75 mi
Loading nearby amenities…
Taxation est. · year 1
- Rental income
- $15,835
- − Mortgage interest
- −$7,837
- − Property taxes
- −$523
- − Insurance
- −$700
- − Repairs & maintenance
- −$1,267
- − Management
- −$1,267
- − Depreciation
- −$4,070
- Taxable income
- $172
- Est. tax owed @ 24.0%
- −$41
- After-tax cash flow
- $2,442/yr
For passive investors: Depreciation is non-cash, so a rental often shows a tax loss while cash-flowing — sheltering income. Rental losses are passive: they offset passive income freely, and up to $25,000/yr can offset ordinary (W-2) income if you actively participate and your MAGI is under $100k (phasing out to $0 by $150k); unused losses carry forward. On sale, claimed depreciation is recaptured at up to 25%, and gains may owe capital-gains tax (a 1031 exchange can defer both). Figures are a year-1 estimate at your 24.0% rate — not tax advice; consult a CPA.
Schools (NCES district)
- District
- Lansing Public School District
- NCES district ID
- 2621150
- Math proficiency
- 14% ▲ 1.00%
- Reading proficiency
- 23% ▲ 3.00%
- Median HH income
- $37,453
- Composite
- 18.76/100
- National rank
- #14002
- State rank
- #650 of 760 in MI
Livability — Lansing
- Score
- 79/100
- State rank
- #94
- US rank
- #2182
Category grades
Schools grade is shown separately in the Schools card above.
Census & demographics
- Census place
- Lansing, MI
- County
- Ingham County · 237,052 people
- City population
- 161,269
- Metro
- Lansing-East Lansing, MI
- Population (ZIP)
- 25,901
- Household income
- $64,315
- Rent vs Own
- Severe rent burden
- 851.0
Population outlook (Ingham County) Hauer SSP2
- Today (2025)
- 300,362 people
- By 2030
- 307,808 · +2.5%
- By 2040
- 320,492 · +6.7%
- By 2050
- 333,223 · +10.9%
- By 2075
- 373,693 · +24.4%
- By 2100
- 392,021 · +30.5%
Race, ethnicity, and origin ACS 2023
- Neighborhood character
- Diverse neighborhood (Simpson 0.56)
- Race & ethnicity
- White 64% Black 15% Two or more races 12% Hispanic / Latino 12% Asian 2%
- Hispanic origin (detail)
- Mexican 9%
- Common ancestry
- Romanian 3% Lithuanian 2% Iranian 2%
- Foreign-born
- 6% · Canada, China
- Languages at home
- 88% English-only · Spanish 5% Other Asian/Pacific 1% French/Haitian/Cajun 1%
Political lean MEDSL · Ingham
- 2024 margin
- Strong D (+29.7) · D 63.9% · R 34.2% · Other 2.0%
- 2008→2024 swing
- -3.6pp toward R · 2008: 33.3pp · 2024: 29.7pp
- All cycles
- 2024: D+29.7 2020: D+32.2 2016: D+27.6 2012: D+27.9 2008: D+33.3
Not yet ingested
- Civics
- —
Market trends
- HPI YoY
- ▼ -135.54%
- Current HPI
- 228.7023
- Rent YoY
- ▲ 10.50%
- Metro
- Lansing-East Lansing, MI
- State GDP YoY
- ▲ 1.37%
- F500 in state
- 28
Industry mix (Fortune 500 HQ in MI)
| Industry | F500 HQs | Revenue |
|---|---|---|
| Automotive Parts | 3 | $48B |
|
||
| Automotive | 2 | $372B |
|
||
| Chemicals | 1 | $45B |
|
||
| Automotive Retail | 1 | $29B |
|
||
| Healthcare / Medical Devices | 1 | $23B |
|
||
| Automotive Technology | 1 | $20B |
|
||
Price history
+27.2% since first listed12 events — show timeline
- 2026-05-26 Listed $139,900 REALCOMP
- 2026-05-26 Listed $139,900 Greater Lansing AoR
- 2023-12-20 Rental Removed $1,150 APPFOLIO
- 2023-12-07 Price Changed $1,150 APPFOLIO
- 2023-11-23 Listed for Rent $1,200 APPFOLIO
- 2023-11-12 Rental Removed $1,200 APPFOLIO
- 2023-09-08 Listed for Rent $1,200 APPFOLIO
- 2017-10-23 Listing Removed — MiRealSource-MiMLS
- 2017-10-23 Listing Removed — REALCOMP
- 2017-05-11 Listed $36,960 MiRealSource-MiMLS
- 2017-05-11 Listed $36,960 REALCOMP
- 2005-03-07 Sold (Public Records) $110,000 Public Records
Property tax history
-9.2%/yrLatest (2025): $523 · -82.3% YoY. Source: county tax records.
Cash-flow waterfall
monthlySold comps — $/sqft
last 12 mo · ≤1 miLoading sold comps…