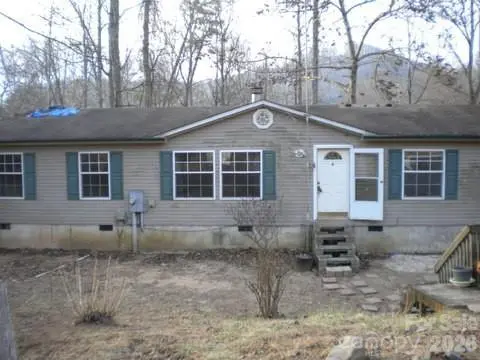
67 Earwood Ridge Rd · Asheville, NC
Flood risk 1/10 · Minimal
- FEMA flood zone
- X (unshaded)
- Chance of flooding over 30 yrs
- 0.0%
- Est. flood insurance / yr
- $473 – $860
Fire risk 5/10 · Moderate
- Est. fire insurance / yr
- $906 – $1,684
Heat risk 3/10 · Minor
- Hot days now (above 96°F)
- 6 days/yr
- Hot days in 30 yrs
- 15 days/yr
Wind risk 2/10 · Minimal
- Chance of severe wind over 30 yrs
- —
Air-quality risk 3/10 · Minor
- Unhealthy air days now
- 2 days/yr
- Unhealthy air days in 30 yrs
- 2 days/yr
Risk factors via First Street. Map © Google.
Why this score? — see what drove the C- grade
The composite is a weighted blend of 9 inputs, each scored 0–100. Each bar is that input's sub-score; the figure is the points it added to the 100-point composite (weight × sub-score).
- Cash flow +17.7/30.0
- ARV discount +15.0/15.0
- DSCR +5.5/10.0
- Schools +4.0/10.0
- Livability +3.6/5.0
- 1% rule +3.5/10.0
- Rent growth +2.5/5.0
- Condition / age +2.5/5.0
- Appreciation +0.0/10.0
$219,900
🖨 Deal sheet 📄 Offer letter ✓ Due diligence
Listing remarks MLS
A Fairview doublewide just waiting for your TLC. Home sits on 2 acres at the top of the ridge in a private setting but is 5 minutes to all shopping and services on 74A. Convenient to Asheville and the Blue Ridge Parkway. A diamond in the rough that can be the perfect house in the woods.
Key facts
- 2 acres
- Blue ridge parkway
- Private setting
Tags
Neighborhood map
What this means for you Summary
Snapshot
- This is a 3-bed/2.0-bath manufactured listed at $220k.
Deal economics
- At list price, monthly cash flow is $176 ($2k/yr) — positive.
- The deal already cash-flows at list — no discount required.
- To meet the 1% rule (rent ≥ 1% of price), the offer needs to be $187k (14.8% below list).
- Recommended offer: $187k (14.8% below list) — sets the bar for 1% rule.
- Cap rate 7.3% vs local median 2.4% in Asheville — top-decile yield for the area; either an underpriced asset or a hidden risk that comps aren't pricing in. Stress-test before assuming the spread holds.
Location & tenants
- Location reads 72/100 on livability (#96 in NC) — a middle-class / working-renter tenant base. Strengths: commute A+, health & safety A+, housing A-; Watch: crime F.
- Buncombe County Schools (suburban): math 45% / reading 50% proficiency, ranked #72 of 178 in NC (top 40%) — families likely to look elsewhere, expect single-tenant / working-renter base with shorter leases.
- Market conditions: 142 active listings in the ZIP; 4 comparable units currently listed for rent nearby; rentals leasing fast (median 14d on market — plan ~1-2 weeks tenant-placement turnaround); 3,305 units permitted in Buncombe County in 2024 (1,855 in 5+ unit buildings).
Forward outlook
- Local home prices are declining (-3.0%/yr); year-one equity from $2k of loan paydown is wiped out by about $7k of value loss. Plan a longer hold.
- Buncombe County population projected at +24% by 2050 — long-run rental-demand tailwind backs the buy-and-hold thesis.
Negotiation context
- It's been on market 145 days — a 12% lower offer ($194k) is reasonable based on typical stale-listing flexibility.
Risks & watch-outs
- Climate carrying-cost: moderate wildfire risk — expect insurance premiums to compound above CPI over the hold.
Questions for the listing agent
- It's been on market 145 days. Have you received any prior offers? Is the seller open to a 15% concession, seller financing, or rate buy-down credit?
- Why hasn't it sold? Are there any deal-killer items the seller is aware of (foundation, flood, title, zoning, code violations)?
- Is there a deadline driving the sale (1031 exchange, divorce, estate, relocation)? That informs how much negotiation room exists.
- Schools are B-rated — typically a magnet for longer-tenancy family renters. What's the average tenant stay here, and is there a school-zone premium baked into asking?
- Crime grade is F in this area — have there been break-ins, vandalism, or insurance claims at this property in the last 3 years? What carrier currently insures it and at what premium?
- What's the average days-on-market for RENTAL listings here right now (not sales)? A rising rental-DOM trend means longer vacancies and softer asking-rent achievability than the comps imply.
- What's the recent tenant-quality profile in this submarket — average credit score on applications, eviction rate, late-payment / NSF rate, and stable-employment percentage? A property-management company in the area should have these aggregated.
- How much new for-sale + rental construction is in the pipeline within 1–3 miles? Heavy new supply typically softens prices + rents 12–24 months out; constrained supply supports both.
Investment metrics
- 1% rule
- 0.85% ✗
- Cap rate
- 7.26%
- Cash-on-cash
- 3.44%
- DSCR
- 1.15
- GRM
- 9.8
CMA / ARV
- ARV (median comp)
- $430,772
- List price
- $219,900
- Delta
- -48.95%
- Verdict
- UNDERPRICED
- Comps
- 12 within 1.0 mi
Projected returns pro-forma
-3.0% appreciation · 3.0% rent growth · sell at horizon
- IRR
- -10.9%
- Equity multiple
- 0.60×
- Total profit
- $-24,500
- Equity at exit
- $32,788
- IRR
- -1.7%
- Equity multiple
- 0.88×
- Total profit
- $-7,287
- Equity at exit
- $19,013
Cash invested: $61,572 (down + closing). Projections, not guarantees.
Landlord ↔ Tenant lean methodology
- Overall (STATE)
- 85 Strongly Landlord-Friendly
- State North Carolina
- 85 Strongly Landlord-Friendly · R+3
- County
- — inherits STATE
- City
- — inherits STATE
ZIP-level market 28730
- Home prices YoY
- -25.6%
- Active inventory
- 142
- Price-to-rent
- 9.8×
Monthly cashflow live
- Estimated rent
- $1,874 medium interval (Pro) →
- Mortgage (P&I)
- −$1,153
- Tax from tax record
- −$59 /mo · $713/yr
- Insurance
- −$92
- HOA
- −$0
- Vacancy / Maint / Mgmt
- −$394
- Net cashflow
- $176
Break-even live
UW: 25.0% down · 7.5% · 30yr · 1.5% tax · 5.0% vac · 8.0% maint · 8.0% mgmt
Financing live
Cash to close
- Down payment
- $54,975
- Closing costs
- $6,597
- Reserves months
- —
- Total cash needed
- —
Loan-product check · same deal, 3 products live
Conventional
25% down · 7.5% · 30yr
- Down + closing
- —
- Monthly P&I
- —
- Monthly cashflow
- —
- DSCR
- —
- Eligible?
- —
Personal DTI + credit; lowest rate.
DSCR
20% down · 8.5% · 30yr
- Down + closing
- —
- Monthly P&I
- —
- Monthly cashflow
- —
- DSCR
- —
- Eligible?
- —
No personal income docs; deal must DSCR.
Hard money
10% down · 12.0% · 12mo
- Down + closing
- —
- Monthly P&I
- —
- Monthly cashflow
- —
- DSCR
- —
- Eligible?
- —
Short-term bridge; refi at stabilization.
Rent comps 4 comps
| Address | Beds | Baths | Sqft | Rent | $/sqft | DOM | Units | Dist |
|---|---|---|---|---|---|---|---|---|
| 1 Overton Way Asheville, NC | 3.0 | 2.0 | 1456 | $1,855 | $1.27 | 13d | 1 | 0.51mi |
| 1120 Gashes Ridge Ln Biltmore Forest, NC | 1.0–3.0 | 1.0–2.0 | 1029 | $2,100 | $2.04 | 13d | 11 | 0.82mi |
| 32 Olde Eastwood Village Blvd Asheville, NC | 1.0–2.0 | 1.0–2.0 | 836 | $1,750 | $2.09 | 23d | 8 | 1.09mi |
| 2000 Olde Eastwood Village Blvd Asheville, NC | 2.0 | 2.0 | 990 | $1,695 | $1.71 | 13d | 1 | 1.20mi |
Listing history 15 events
-
2026-06-18days on market $219,900 Active 145 DOM
-
2026-06-17days on market $219,900 Active 144 DOM
-
2026-06-16days on market $219,900 Active 143 DOM
-
2026-06-15days on market $219,900 Active 142 DOM
-
2026-06-14days on market $219,900 Active 140 DOM
-
2026-06-10days on market $219,900 Active 137 DOM
-
2026-06-09days on market $219,900 Active 136 DOM
-
2026-06-08days on market $219,900 Active 135 DOM
-
2026-06-07days on market $219,900 Active 134 DOM
-
2026-06-03days on market $219,900 Active 130 DOM
-
2026-06-02days on market $219,900 Active 129 DOM
-
2026-06-01days on market $219,900 Active 128 DOM
-
2026-04-29price $219,900 288-char remark
Show marketing remark (288 chars)
A Fairview doublewide just waiting for your TLC. Home sits on 2 acres at the top of the ridge in a private setting but is 5 minutes to all shopping and services on 74A. Convenient to Asheville and the Blue Ridge Parkway. A diamond in the rough that can be the perfect house in the woods.
-
2026-03-06price $229,900 288-char remark
Show marketing remark (288 chars)
A Fairview doublewide just waiting for your TLC. Home sits on 2 acres at the top of the ridge in a private setting but is 5 minutes to all shopping and services on 74A. Convenient to Asheville and the Blue Ridge Parkway. A diamond in the rough that can be the perfect house in the woods.
-
2026-01-22$249,900 Active 288-char remark
Show marketing remark (288 chars)
A Fairview doublewide just waiting for your TLC. Home sits on 2 acres at the top of the ridge in a private setting but is 5 minutes to all shopping and services on 74A. Convenient to Asheville and the Blue Ridge Parkway. A diamond in the rough that can be the perfect house in the woods.
ⓘ Source: listings_history table (triggers on properties + properties_extension) + one-shot
backfill from property_details.listing_events for pre-trigger history.
Tax reassessment forecast NC · Resets to sale price
- Current annual tax
- $713 · $59/mo
- Projected year-2 tax
- $1,803 · $150/mo
- Expected delta
- +$1,090/yr (+$91/mo · 152.9%)
ⓘ Screening estimate from a state-policy table — verify with the county assessor before closing.
Climate risk First Street
- Flood 1/10 Low FEMA zone X (unshaded) · 0% chance over 30 yrs
- Wildfire 5/10 Major
- Heat 3/10 Moderate 6 d/yr ≥96°F today · 15 d/yr by 30 yrs out
- Wind 2/10 Low
- Air quality 3/10 Moderate 2 unhealthy d/yr today · 2 by 30 yrs out
Nearby sold comps map
Loading sold comps map…
Walkable amenities ~0.75 mi
Loading nearby amenities…
Taxation est. · year 1
- Rental income
- $22,491
- − Mortgage interest
- −$12,318
- − Property taxes
- −$713
- − Insurance
- −$1,100
- − Repairs & maintenance
- −$1,799
- − Management
- −$1,799
- − Depreciation
- −$6,397
- Taxable loss
- −$1,635
- Est. tax savings @ 24.0%
- +$392
- After-tax cash flow
- $2,510/yr
For passive investors: Depreciation is non-cash, so a rental often shows a tax loss while cash-flowing — sheltering income. Rental losses are passive: they offset passive income freely, and up to $25,000/yr can offset ordinary (W-2) income if you actively participate and your MAGI is under $100k (phasing out to $0 by $150k); unused losses carry forward. On sale, claimed depreciation is recaptured at up to 25%, and gains may owe capital-gains tax (a 1031 exchange can defer both). Figures are a year-1 estimate at your 24.0% rate — not tax advice; consult a CPA.
Schools (NCES district)
- District
- Buncombe County Schools
- NCES district ID
- 3700450
- Math proficiency
- 45% ▬ 0.00%
- Reading proficiency
- 50% ▲ 2.00%
- Median HH income
- $45,981
- Composite
- 40.32/100
- National rank
- #3749
- State rank
- #72 of 178 in NC
Livability — Asheville
- Score
- 72/100
- State rank
- #96
- US rank
- #6307
Category grades
Schools grade is shown separately in the Schools card above.
Census & demographics
- City population
- 137,611
- Population (ZIP)
- 7,213
Population outlook (Buncombe County) Hauer SSP2
- Today (2025)
- 286,475 people
- By 2030
- 302,237 · +5.5%
- By 2040
- 330,687 · +15.4%
- By 2050
- 356,370 · +24.4%
- By 2075
- 409,383 · +42.9%
- By 2100
- 437,270 · +52.6%
Race, ethnicity, and origin ACS 2023
- Neighborhood character
- Predominantly White (94%)
- Race & ethnicity
- White 94% Hispanic / Latino 3% Two or more races 2%
- Common ancestry
- Slovak 3% Serbian 3% Italian 2%
- Foreign-born
- 2% · Canada, Jamaica
- Languages at home
- 96% English-only · Spanish 3%
Political lean MEDSL · Buncombe
- 2024 margin
- Strong D (+24.8) · D 61.7% · R 36.9% · Other 1.4%
- 2008→2024 swing
- +10.9pp toward D · 2008: 13.9pp · 2024: 24.8pp
- All cycles
- 2024: D+24.8 2020: D+21.1 2016: D+14.6 2012: D+12.4 2008: D+13.9
Not yet ingested
- Civics
- —
Market trends
- HPI YoY
- ▼ -99.34%
- Current HPI
- 288.6339
- Rent YoY
- —
- Metro
- —
- State GDP YoY
- ▲ 3.28%
- F500 in state
- 26
Industry mix (Fortune 500 HQ in NC)
| Industry | F500 HQs | Revenue |
|---|---|---|
| Financial Services | 2 | $213B |
|
||
| Retail | 2 | $95B |
|
||
| Industrial Conglomerate | 1 | $38B |
|
||
| Metals / Steel | 1 | $35B |
|
||
| Utilities | 1 | $30B |
|
||
| Industrial Machinery | 1 | $19B |
|
||
Price history
-12.0% since first listed3 events — show timeline
- 2026-04-29 Price Changed $219,900 CANOPYMLS as Distributed by MLS Grid
- 2026-03-06 Price Changed $229,900 CANOPYMLS as Distributed by MLS Grid
- 2026-01-22 Listed $249,900 CANOPYMLS as Distributed by MLS Grid
Property tax history
+0.1%/yrLatest (2025): $713 · +4.3% YoY. Source: county tax records.
Cash-flow waterfall
monthlySold comps — $/sqft
last 12 mo · ≤1 miLoading sold comps…