4007 NW 87th Ave #4007 · Sunrise, FL
Flood risk 1/10 · Minimal
- FEMA flood zone
- X (shaded)
- Chance of flooding over 30 yrs
- 0.0%
- Est. flood insurance / yr
- $507 – $1,088
Fire risk 1/10 · Minimal
- Est. fire insurance / yr
- $947 – $1,759
Heat risk 10/10 · Severe
- Hot days now (above 105°F)
- 7 days/yr
- Hot days in 30 yrs
- 27 days/yr
Wind risk 10/10 · Severe
- Chance of severe wind over 30 yrs
- 99.0%
Air-quality risk 3/10 · Minor
- Unhealthy air days now
- 2 days/yr
- Unhealthy air days in 30 yrs
- 3 days/yr
Risk factors via First Street. Map © Google.
Why this score? — see what drove the D grade
The composite is a weighted blend of 9 inputs, each scored 0–100. Each bar is that input's sub-score; the figure is the points it added to the 100-point composite (weight × sub-score).
- Cash flow +10.8/30.0
- ARV discount +7.5/15.0
- 1% rule +5.9/10.0
- Livability +4.2/5.0
- Schools +4.1/10.0
- DSCR +3.1/10.0
- Rent growth +2.7/5.0
- Condition / age +2.5/5.0
- Appreciation +0.0/10.0
$160,000
🖨 Deal sheet (PDF) 📄 Offer letter ✓ Due diligence
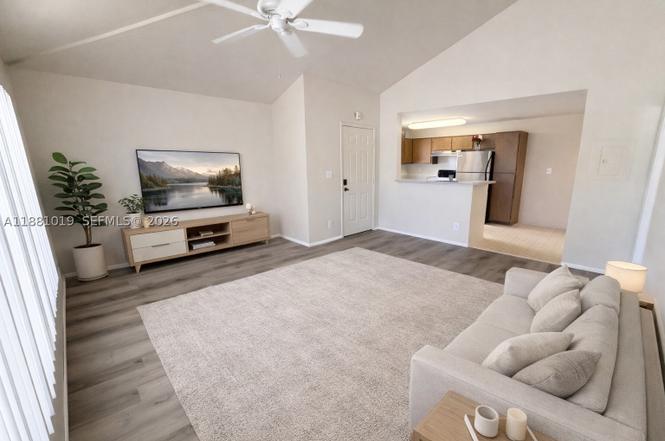
Listing remarks
1/1, NEW FLOORING, WALK-IN CLOSET, WASHER/DRYER IN UNIT. COMMUNITY HAS POOL, GYM, CLUB HOUSE. NEW TENANT MOVING IN MAY 15TH, WILL PAY $1600 MONTHLY.
Key facts
- Walk-in closet
- Washer/dryer in unit
- Pool
Tags
Property features AI
Finance
- Financial info: Pets allowed with restrictions or possible restrictions (conditional)
- HOA & community: Monthly association fee of $338; Association covers amenities, common areas, structure maintenance, sewer, and trash; Community amenities include basketball court, clubhouse, fitness center, barbecue, and picnic area
Exterior
- Parking: One parking space
- Home design: 2-story building; Entry located on level 1; Entry level 1
- Construction: Block construction; Effective year built
- Exterior features: Has property attached
Interior
- Kitchen: Dishwasher; Refrigerator
- Bathrooms: 1 full bathroom
- Heating & cooling: Central heating; Central air conditioning
- Interior features: First-floor entry
- Laundry & utility: Washer; Dryer
Neighborhood map
What this means for you Summary
Snapshot
- This is a 1-bed/1.0-bath condo listed at $160k.
Deal economics
- At list price, monthly cash flow is $-72 ($-866/yr) — negative.
- To cash-flow at today's rent, offer at most $150k (6.5% below list).
- Meets the 1% rule at list price ($2k rent vs $160k).
- Recommended offer: $141k (12.0% below list) — sets the bar for market timing.
Location & tenants
- Location reads 83/100 on livability (#56 in FL, #986 nationally) — a professional / high-income tenant draw. Strengths: commute A+, housing A+, health & safety A+; Watch: employment C-, amenities F.
- Broward (suburban): math 42% / reading 53% proficiency, ranked #46 of 73 in FL (top 63%) — families likely to look elsewhere, expect single-tenant / working-renter base with shorter leases.
- Zoned schools: Nova Blanche Forman Elementary (math 35% / reading 55%, grade D-, #1,271 of 2,144 statewide, top 60%, 769 students, 72% FRL); Nova Middle School (math 44% / reading 53%, grade C-, #274 of 571 statewide, top 50%, 1,284 students, 68% FRL); Piper High School (math 12% / reading 35%, grade F, #533 of 667 statewide, top 80%, 2,310 students, 65% FRL) — zoned schools average 68% FRL vs 51% district-wide (17 pts higher); higher-poverty schools than district average — tighter screening recommended.
- Market conditions: Rents flat; 191 active listings in the ZIP; 40 comparable units currently listed for rent nearby; rentals at typical pace (median 24d on market — plan ~3-4 weeks tenant-placement turnaround); solid renter incomes; 2,111 units permitted in Broward County in 2024 (1,265 in 5+ unit buildings).
Forward outlook
- Local home prices are declining (-3.0%/yr); year-one equity from $1k of loan paydown is wiped out by about $5k of value loss. Plan a longer hold.
- Broward County population projected at +34% by 2050 — long-run rental-demand tailwind backs the buy-and-hold thesis.
Negotiation context
- It's been on market 270 days — a 12% lower offer ($141k) is reasonable based on typical stale-listing flexibility.
- 3 sale attempts since 9y ago; this cycle's ask is 9900% above the opening price — seller raised mid-cycle; expect resistance to lowballs.
Risks & watch-outs
- Climate carrying-cost: severe wind risk, 99% chance of damaging wind over 30y; extreme-heat days projected 7→27/yr by 2055 (HVAC capex compounding) — expect insurance premiums to compound above CPI over the hold.
Questions for the listing agent
- What do current leases actually rent for vs. the listed asking? Can we see a recent rent roll and the last 12 months of T-12 income?
- It's been on market 270 days. Have you received any prior offers? Is the seller open to a 12% concession, seller financing, or rate buy-down credit?
- What does the HOA fee cover, when was the last increase, and are there any pending special assessments or reserve-fund shortfalls?
- Any open or pending special assessments — roof, HVAC, plumbing, elevator, façade? What's the per-unit balance and payoff schedule, and is the seller paying it off at close or rolling it to the buyer?
- Why hasn't it sold? Are there any deal-killer items the seller is aware of (foundation, flood, title, zoning, code violations)?
- Is there a deadline driving the sale (1031 exchange, divorce, estate, relocation)? That informs how much negotiation room exists.
- The area grade is low — what's the realistic commute time and amenity access for the typical tenant pool here? Any planned neighborhood developments (good or bad) we should know about?
- What's the average days-on-market for RENTAL listings here right now (not sales)? A rising rental-DOM trend means longer vacancies and softer asking-rent achievability than the comps imply.
- What's the recent tenant-quality profile in this submarket — average credit score on applications, eviction rate, late-payment / NSF rate, and stable-employment percentage? A property-management company in the area should have these aggregated.
- How much new apartment / multifamily construction is in the pipeline within 1–3 miles? Heavy new supply (>2% of stock underway) typically softens rents 12–24 months out; light construction supports rent growth.
Investment metrics
- 1% rule
- 1.09% ✓
- Cap rate
- 5.75%
- Cash-on-cash
- -1.93%
- DSCR
- 0.91
- GRM
- 7.7
CMA / ARV
No comps found within radius.
Projected returns pro-forma
-3.0% appreciation · 0.9% rent growth · sell at horizon
- IRR
- -22.5%
- Equity multiple
- 0.24×
- Total profit
- $-33,883
- Equity at exit
- $23,857
- IRR
- -25.3%
- Equity multiple
- -0.09×
- Total profit
- $-48,611
- Equity at exit
- $13,834
Cash invested: $44,800 (down + closing). Projections, not guarantees.
Landlord ↔ Tenant lean methodology
- Overall (STATE)
- 87 Strongly Landlord-Friendly
- State Florida
- 87 Strongly Landlord-Friendly · R+3
- County
- — inherits STATE
- City
- — inherits STATE
ZIP-level market 33351
- Rents YoY
- 0.9%
- Active inventory
- 191
- Price-to-rent
- 7.7×
Monthly cashflow live
- Estimated rent
- $1,736 high interval (Pro) →
- Mortgage (P&I)
- −$839
- Tax est. 1.5%
- −$200 /mo · $2,400/yr
- Insurance
- −$67
- HOA
- −$338
- Vacancy / Maint / Mgmt
- −$365
- Net cashflow
- $-72
Break-even live
Sensitivity live
| Price | -10% $38 | -5% $-17 | +0% $-72 | +5% $-127 | +10% $-183 |
|---|---|---|---|---|---|
| Rent | -10% $-209 | -5% $-141 | +0% $-72 | +5% $-4 | +10% $65 |
| Rate | -1.0pp $8 | -0.5pp $-31 | base $-72 | +0.5pp $-114 | +1.0pp $-156 |
UW: 25.0% down · 7.5% · 30yr · 1.5% tax · 5.0% vac · 8.0% maint · 8.0% mgmt
Financing live
Cash to close
- Down payment
- $40,000
- Closing costs
- $4,800
- Reserves months
- —
- Total cash needed
- —
Loan-product check · same deal, 3 products live
Conventional
25% down · 7.5% · 30yr
- Down + closing
- —
- Monthly P&I
- —
- Monthly cashflow
- —
- DSCR
- —
- Eligible?
- —
Personal DTI + credit; lowest rate.
DSCR
20% down · 8.5% · 30yr
- Down + closing
- —
- Monthly P&I
- —
- Monthly cashflow
- —
- DSCR
- —
- Eligible?
- —
No personal income docs; deal must DSCR.
Hard money
10% down · 12.0% · 12mo
- Down + closing
- —
- Monthly P&I
- —
- Monthly cashflow
- —
- DSCR
- —
- Eligible?
- —
Short-term bridge; refi at stabilization.
Rent comps 40 comps
| Address | Beds | Baths | Sqft | Rent | $/sqft | DOM | Units | Dist |
|---|---|---|---|---|---|---|---|---|
| 4028 NW 87th Ave #4028 Sunrise, FL | 1.0 | 1.0 | 595 | $1,700 | $2.86 | 26d | 1 | 0.04mi |
| 3973 NW 87th Ave #3973 Sunrise, FL | 2.0 | 1.0 | 731 | $1,899 | $2.60 | 26d | 1 | 0.04mi |
| 4028 NW 87th Ave #4028 Sunrise, FL | 1.0 | 1.0 | 595 | $1,700 | $2.86 | 1d | 1 | 0.04mi |
| 8775 NW 39th St #8775 Sunrise, FL | 2.0 | 1.0 | 731 | $1,845 | $2.52 | 16d | 1 | 0.04mi |
| 4072 NW 87th Ave Unit 4072 Sunrise, FL | 1.0 | 1.0 | 595 | $1,690 | $2.84 | 19d | 1 | 0.04mi |
| 4071 NW 87th Ave Sunrise, FL | 1.0 | 1.0 | 595 | $1,699 | $2.86 | 26d | 1 | 0.04mi |
| 4044 NW 87th Ave #4044 Sunrise, FL | 1.0 | 1.0 | 630 | $1,649 | $2.62 | 26d | 1 | 0.04mi |
| 4096 N Pine Island Rd #2102 Sunrise, FL | 1.0 | 1.0 | 595 | $1,625 | $2.73 | 26d | 1 | 0.06mi |
| 3968 NW 87th Ave #3968 Sunrise, FL | 1.0 | 1.0 | 595 | $1,625 | $2.73 | 26d | 1 | 0.09mi |
| 3968 NW 87th Ave #3968 Sunrise, FL | 1.0 | 1.0 | 595 | $1,625 | $2.73 | 10d | 1 | 0.09mi |
| 3935 NW 87th Ave Sunrise, FL | 1.0 | 1.0 | 595 | $1,600 | $2.69 | 26d | 1 | 0.10mi |
| 8798 NW 38th St Sunrise, FL | 1.0–2.0 | 1.0–2.0 | 893 | $1,826 | $2.04 | 10d | 1 | 0.15mi |
| 8083-8093 W Oakland Park Blvd Sunrise, FL | 1.0–3.0 | 1.0–2.0 | 1054 | $2,620 | $2.48 | 26d | 37 | 0.68mi |
| 8053 W Oakland Park Blvd Unit 6-307 Sunrise, FL | 1.0 | 1.0 | 727 | $2,618 | $3.60 | 26d | 1 | 0.76mi |
| 8053 W Oakland Park Blvd Unit 1-204 Sunrise, FL | 1.0 | 1.0 | 735 | $2,450 | $3.33 | 26d | 1 | 0.76mi |
| 8590 Sunrise Lakes Blvd #106 Sunrise, FL | 1.0 | 1.0 | 640 | $1,475 | $2.30 | 26d | 1 | 0.77mi |
| 4001 N University Dr Sunrise, FL | — | 1.0 | 600 | $1,388 | $2.31 | 15d | 1 | 0.79mi |
| 8400 Sunrise Lakes Blvd #106 Sunrise, FL | 1.0 | 1.0 | 640 | $1,400 | $2.19 | 10d | 1 | 0.79mi |
| 8400 Sunrise Lakes Blvd #106 Sunrise, FL | 1.0 | 1.0 | 640 | $1,400 | $2.19 | 26d | 1 | 0.79mi |
| 9823 Nob Hill Ct #9823 Sunrise, FL | 1.0 | 1.0 | 744 | $1,850 | $2.49 | 14d | 1 | 0.88mi |
| 9968 Nob Hill Ln #9968 Sunrise, FL | 1.0 | 1.0 | 744 | $1,800 | $2.42 | 26d | 1 | 0.88mi |
| 9943 Nob Hill Pl #9943 Sunrise, FL | 1.0 | 1.0 | 744 | $1,875 | $2.52 | 13d | 1 | 0.88mi |
| 9823 Nob Hill Ct #9823 Sunrise, FL | 1.0 | 1.0 | 744 | $1,775 | $2.39 | 1d | 1 | 0.88mi |
| 9934 Nob Hill Pl #9934 Sunrise, FL | 1.0 | 1.0 | 744 | $1,790 | $2.41 | 4d | 1 | 0.89mi |
| 9934 Nob Hill Pl #9934 Sunrise, FL | 1.0 | 1.0 | 744 | $1,850 | $2.49 | 26d | 1 | 0.89mi |
| 8285 Sunrise Lakes Blvd #208 Sunrise, FL | 1.0 | 1.0 | 640 | $1,400 | $2.19 | 10d | 1 | 0.89mi |
| 8285 Sunrise Lakes Blvd #208 Sunrise, FL | 1.0 | 1.0 | 640 | $1,400 | $2.19 | 26d | 1 | 0.89mi |
| 8110 Sunrise Lakes Blvd #307 Sunrise, FL | 1.0 | 1.0 | 640 | $1,500 | $2.34 | 19d | 1 | 0.89mi |
| 8110 Sunrise Lakes Blvd #307 Sunrise, FL | 1.0 | 1.0 | 640 | $1,500 | $2.34 | 4d | 1 | 0.89mi |
| 8595 Sunrise Lakes Blvd Sunrise, FL | 1.0 | 1.0 | 640 | $1,550 | $2.42 | 23d | 2 | 0.90mi |
| 8595 Sunrise Lakes Blvd #207 Sunrise, FL | 1.0 | 1.0 | 640 | $1,700 | $2.66 | 26d | 1 | 0.90mi |
| 8595 Sunrise Lakes Blvd #307 Sunrise, FL | 1.0 | 1.0 | 640 | $1,400 | $2.19 | 3d | 1 | 0.90mi |
| 8465 Sunrise Lakes Blvd #106 Sunrise, FL | 1.0 | 1.0 | 640 | $1,450 | $2.27 | 26d | 1 | 0.91mi |
| 8100 Sunrise Lakes Blvd Sunrise, FL | 1.0–2.0 | 1.0–2.0 | 745 | $1,380 | $1.85 | 13d | 2 | 0.95mi |
| 8135 Sunrise Lakes Blvd Sunrise, FL | 1.0–2.0 | 1.0–2.0 | 745 | $1,500 | $2.01 | 26d | 2 | 0.98mi |
| 7710 NW 50th St #304 Lauderhill, FL | 1.0 | 1.0 | 630 | $1,500 | $2.38 | 26d | 1 | 1.13mi |
| 3048 Sunrise Lakes Dr E Unit 411 Sunrise, FL | 1.0 | 1.0 | 725 | $1,600 | $2.21 | 5d | 1 | 1.38mi |
| 3048 E Sunrise Lakes Dr #412 Sunrise, FL | 1.0 | 1.0 | 725 | $1,400 | $1.93 | 24d | 1 | 1.38mi |
| 3048 Sunrise Lakes Dr E Unit 411 Sunrise, FL | 1.0 | 1.0 | 725 | $1,650 | $2.28 | 23d | 1 | 1.38mi |
| 5475 N University Dr Lauderhill, FL | 1.0–3.0 | 1.0–2.0 | 891 | $1,758 | $1.97 | 0d | 26 | 1.44mi |
HOA detail condo
- Monthly dues
- $338 · $4,056/yr
- Likely covers
- poolgym
- Assessments
- None detected in remarks — confirm with the listing agent.
Listing history 18 events
-
2026-06-15status $160,000 Pending 270 DOM
-
2026-06-15days on market $160,000 Active 270 DOM
-
2026-06-13days on market $160,000 Active 268 DOM
-
2026-06-09days on market $160,000 Active 264 DOM
-
2026-06-07days on market $160,000 Active 262 DOM
-
2026-06-04days on market $160,000 Active 259 DOM
-
2026-06-03days on market $160,000 Active 258 DOM
-
2026-06-02days on market $160,000 Active 257 DOM
-
2026-06-01days on market $160,000 Active 256 DOM
-
2026-05-31days on market $160,000 Active 255 DOM
-
2026-04-17historical $1,600
-
2026-04-07$1,600
-
2026-03-31price $160,000
-
2026-01-28price $164,900
-
2026-01-26price $165,000
-
2025-09-18$180,000 Active
-
2018-02-20historical
-
2017-04-14$95,000
ⓘ Source: listings_history table (triggers on properties + properties_extension) + one-shot
backfill from property_details.listing_events for pre-trigger history.
Climate risk First Street
- Flood 1/10 Low FEMA zone X (shaded) · 0% chance over 30 yrs
- Wildfire 1/10 Low
- Heat 10/10 Extreme 7 d/yr ≥105°F today · 27 d/yr by 30 yrs out
- Wind 10/10 Extreme 99% chance of damaging wind over 30 yrs
- Air quality 3/10 Moderate 2 unhealthy d/yr today · 3 by 30 yrs out
Nearby sold comps map
Loading sold comps map…
Walkable amenities ~0.75 mi
Loading nearby amenities…
Taxation est. · year 1
- Rental income
- $20,834
- − Mortgage interest
- −$8,962
- − Property taxes
- −$2,400
- − Insurance
- −$800
- − Repairs & maintenance
- −$1,667
- − Management
- −$1,667
- − HOA
- −$4,056
- − Depreciation
- −$4,655
- Taxable loss
- −$3,373
- Est. tax savings @ 24.0%
- +$809
- After-tax cash flow
- $-57/yr
For passive investors: Depreciation is non-cash, so a rental often shows a tax loss while cash-flowing — sheltering income. Rental losses are passive: they offset passive income freely, and up to $25,000/yr can offset ordinary (W-2) income if you actively participate and your MAGI is under $100k (phasing out to $0 by $150k); unused losses carry forward. On sale, claimed depreciation is recaptured at up to 25%, and gains may owe capital-gains tax (a 1031 exchange can defer both). Figures are a year-1 estimate at your 24.0% rate — not tax advice; consult a CPA.
Schools (NCES district)
- District
- Broward
- NCES district ID
- 1200180
- Math proficiency
- 42% ▼ -18.00%
- Reading proficiency
- 53% ▼ -5.00%
- Median HH income
- $52,139
- Composite
- 40.88/100
- National rank
- #3621
- State rank
- #46 of 73 in FL
Livability — Sunrise
- Score
- 83/100
- State rank
- #56
- US rank
- #986
Category grades
Schools grade is shown separately in the Schools card above.
Census & demographics
- Census place
- Sunrise, FL
- County
- Broward County · 1,963,430 people
- City population
- 77,492
- Metro
- Miami-Fort Lauderdale-Pompano Beach, FL
- Population (ZIP)
- 36,364
- Household income
- $77,363
- Rent vs Own
- Severe rent burden
- 1753.0
Population outlook (Broward County) Hauer SSP2
- Today (2025)
- 2,207,033 people
- By 2030
- 2,360,704 · +7.0%
- By 2040
- 2,661,208 · +20.6%
- By 2050
- 2,946,698 · +33.5%
- By 2075
- 3,602,273 · +63.2%
- By 2100
- 3,970,984 · +79.9%
Race, ethnicity, and origin ACS 2023
- Neighborhood character
- Highly diverse neighborhood (Simpson 0.70)
- Race & ethnicity
- Black 38% Hispanic / Latino 32% White 21% Two or more races 19% Asian 5%
- Hispanic origin (detail)
- Puerto Rican 5% Cuban 4% Dominican 1%
- Common ancestry
- Hispanic 7% Romanian 1% Scotch-Irish 1%
- Foreign-born
- 40% · Canada, Jamaica, Dominican Republic
- Languages at home
- 57% English-only · Spanish 29% French/Haitian/Cajun 6% Other Indo-European 4%
Political lean MEDSL · Broward
- 2024 margin
- D (+17.0) · D 58.0% · R 41.0%
- 2008→2024 swing
- -17.8pp toward R · 2008: 34.7pp · 2024: 17.0pp
- All cycles
- 2024: D+17.0 2020: D+29.8 2016: D+35.0 2012: D+34.9 2008: D+34.7
Not yet ingested
- Civics
- —
Market trends
- HPI YoY
- ▼ -238.70%
- Current HPI
- 395.4292
- Rent YoY
- ▲ 0.90%
- Metro
- Miami-Fort Lauderdale-Pompano Beach, FL
- State GDP YoY
- ▲ 3.28%
- F500 in state
- 36
Industry mix (Fortune 500 HQ in FL)
| Industry | F500 HQs | Revenue |
|---|---|---|
| Industrial Technology | 2 | $29B |
|
||
| Insurance | 2 | $17B |
|
||
| Retail | 1 | $60B |
|
||
| Technology Distribution | 1 | $58B |
|
||
| Homebuilding | 1 | $35B |
|
||
| Technology Manufacturing | 1 | $35B |
|
||
Price history
-98.3% since first listed8 events — show timeline
- 2026-04-17 Rental Removed $1,600 MARMLS
- 2026-04-07 Listed for Rent $1,600 MARMLS
- 2026-03-31 Price Changed $160,000 MARMLS
- 2026-01-28 Price Changed $164,900 MARMLS
- 2026-01-26 Price Changed $165,000 MARMLS
- 2025-09-18 Listed $180,000 MARMLS
- 2018-02-20 Listing Removed — MARMLS
- 2017-04-14 Listed $95,000 MARMLS
Cash-flow waterfall
monthlySold comps — $/sqft
last 12 mo · ≤1 miLoading sold comps…