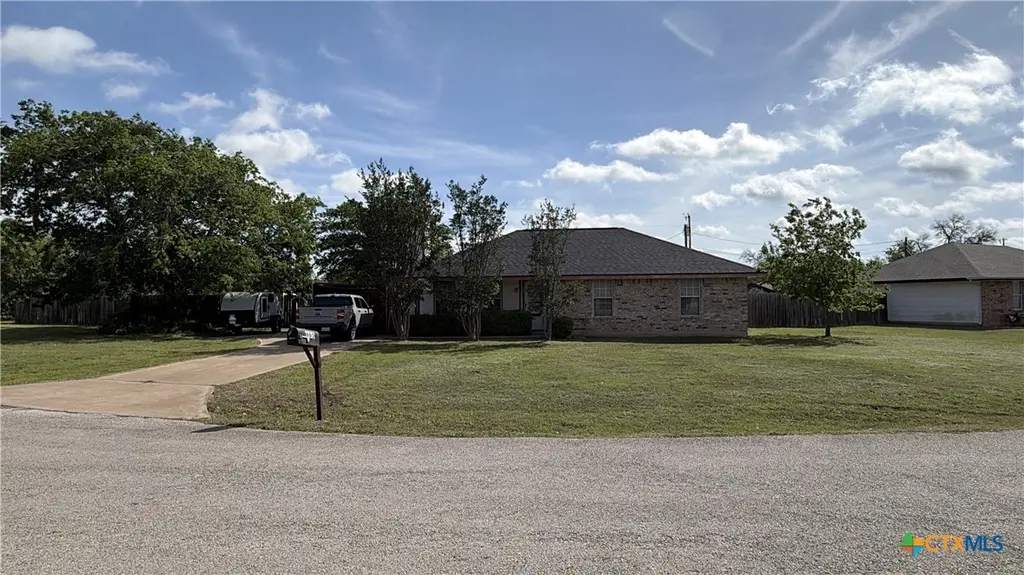
665 Fallen Oak Dr · Bertram, TX
Flood risk 1/10 · Minimal
- FEMA flood zone
- X (unshaded)
- Chance of flooding over 30 yrs
- 0.0%
- Est. flood insurance / yr
- $507 – $1,088
Fire risk 7/10 · Major
- Est. fire insurance / yr
- $1,222 – $2,270
Heat risk 7/10 · Major
- Hot days now (above 105°F)
- 7 days/yr
- Hot days in 30 yrs
- 23 days/yr
Wind risk 6/10 · Moderate
- Chance of severe wind over 30 yrs
- 61.0%
Air-quality risk 1/10 · Minimal
- Unhealthy air days now
- 0 days/yr
- Unhealthy air days in 30 yrs
- 0 days/yr
Risk factors via First Street. Map © Google.
Why this score? — see what drove the D grade
The composite is a weighted blend of 9 inputs, each scored 0–100. Each bar is that input's sub-score; the figure is the points it added to the 100-point composite (weight × sub-score).
- ARV discount +15.0/15.0
- Cash flow +7.3/30.0
- Livability +3.7/5.0
- Schools +3.2/10.0
- 1% rule +2.7/10.0
- Rent growth +2.5/5.0
- Condition / age +2.5/5.0
- Appreciation +1.8/10.0
- DSCR +1.4/10.0
$200,000
🖨 Deal sheet (PDF) 📄 Offer letter ✓ Due diligence
Key facts
- 0.35 acre lot
- Built 2002
- Listed 27 days
Property features AI
Finance
- Other: City lot (approximately quarter to half acre); Paved city street frontage
Exterior
- Utilities: Public water; Public sewer (sewer not connected at lot) / Septic tank listed; Electricity available and on property
- Home design: Single-story home; Resale property
- Construction: Brick veneer, frame and masonry construction; Shingle/composition roof; Slab foundation; Built (year per assessor)
- Exterior features: Patio; Exterior storage; Backyard privacy wood fence
Interior
- Kitchen: Electric range
- Flooring: Carpet; Vinyl
- Bathrooms: 2 full bathrooms
- Heating & cooling: Central heating; Electric heating; Heat pump; One cooling unit
- Interior features: Ceiling fans; Kitchen/dining combo; Tub with shower; Vanity; Breakfast area; Wood-burning fireplace in living room
- Laundry & utility: Laundry room; Laundry area in kitchen
Neighborhood map
What this means for you Summary
Snapshot
- This is a 3-bed/2.0-bath single-family listed at $200k.
Deal economics
- At list price, monthly cash flow is $-270 ($-3k/yr) — negative.
- To cash-flow at today's rent, offer at most $152k (23.9% below list).
- To meet the 1% rule (rent ≥ 1% of price), the offer needs to be $155k (22.7% below list).
- Recommended offer: $152k (23.9% below list) — sets the bar for cash-flow.
- Cap rate 4.7% vs local median 2.5% in Bertram — top-decile yield for the area; either an underpriced asset or a hidden risk that comps aren't pricing in. Stress-test before assuming the spread holds.
Location & tenants
- Location reads 74/100 on livability (#170 in TX, #4,466 nationally) — a middle-class / working-renter tenant base. Strengths: crime A+, cost of living A+, housing A+; Watch: amenities F, commute F, health & safety F.
- Burnet CISD (rural): math 36% / reading 38% proficiency, ranked #465 of 826 in TX (top 56%) — families likely to look elsewhere, expect single-tenant / working-renter base with shorter leases.
- Zoned schools: Burnet Middle (math 32% / reading 33%, grade F, #947 of 1,662 statewide, top 58%, 731 students, 62% FRL) — zoned schools average 62% FRL vs 46% district-wide (15 pts higher); higher-poverty schools than district average — tighter screening recommended.
- Market conditions: 358 active listings in the ZIP; 5 comparable units currently listed for rent nearby; rentals at typical pace (median 17d on market — plan ~3-4 weeks tenant-placement turnaround); 40% of comp listings sitting > 30 days — soft ceiling on asking rent; 891 units permitted in Burnet County in 2024 (76 in 5+ unit buildings).
Forward outlook
- Local home prices are declining (-3.0%/yr); year-one equity from $1k of loan paydown is wiped out by about $6k of value loss. Plan a longer hold.
- Burnet County population projected at +22% by 2050 — long-run rental-demand tailwind backs the buy-and-hold thesis.
Negotiation context
- It's been on market 27 days — a 2% lower offer ($197k) is reasonable based on typical stale-listing flexibility.
Risks & watch-outs
- Climate carrying-cost: major wind risk, 61% chance of damaging wind over 30y; major wildfire risk; extreme-heat days projected 7→23/yr by 2055 (HVAC capex compounding) — expect insurance premiums to compound above CPI over the hold.
Questions for the listing agent
- What do current leases actually rent for vs. the listed asking? Can we see a recent rent roll and the last 12 months of T-12 income?
- Is there a deadline driving the sale (1031 exchange, divorce, estate, relocation)? That informs how much negotiation room exists.
- Schools are D-rated, which usually means shorter tenancies and higher turnover. Who's the typical renter profile here, and what's been the actual vacancy rate?
- The area grade is low — what's the realistic commute time and amenity access for the typical tenant pool here? Any planned neighborhood developments (good or bad) we should know about?
- What's the average days-on-market for RENTAL listings here right now (not sales)? A rising rental-DOM trend means longer vacancies and softer asking-rent achievability than the comps imply.
- What's the recent tenant-quality profile in this submarket — average credit score on applications, eviction rate, late-payment / NSF rate, and stable-employment percentage? A property-management company in the area should have these aggregated.
- How much new for-sale + rental construction is in the pipeline within 1–3 miles? Heavy new supply typically softens prices + rents 12–24 months out; constrained supply supports both.
Investment metrics
- 1% rule
- 0.77% ✗
- Cap rate
- 4.67%
- Cash-on-cash
- -5.79%
- DSCR
- 0.74
- GRM
- 10.8
CMA / ARV
- ARV (median comp)
- $268,146
- List price
- $200,000
- Delta
- -25.41%
- Verdict
- UNDERPRICED
- Comps
- 20 within 1.0 mi
Show comp detail 11 sales within ~0.75 mi
| Address | Dist | Beds/Ba | Sqft | Sold | Price | $/sf | Match |
|---|---|---|---|---|---|---|---|
| 665 Fallen Oak Dr | 0.00mi | 3/2.0 | 1,156 (0%) | 0mo | $190,000 | $164 | 100 |
| 560 Live Oak Dr | 0.12mi | 3/2.0 | 1,109 (-4%) | 7mo | $280,000 | $252 | 81 |
| 679 W South St | 0.13mi | 3/1.5 | 1,111 (-4%) | 13mo | $260,000 | $234 | 75 |
| 510 Live Oak Dr | 0.10mi | 3/2.0 | 1,239 (+7%) | 13mo | $272,000 | $220 | 72 |
| 340 S Grange St | 0.36mi | 3/2.0 | 1,134 (-2%) | 13mo | $248,500 | $219 | 69 |
| 415 Brooks Mill Rd | 0.39mi | 3/2.0 | 1,100 (-5%) | 8mo | $245,000 | $223 | 67 |
| 730 Fallen Oak Dr | 0.16mi | 3/2.0 | 1,260 (+9%) | 17mo | $290,000 | $230 | 64 |
| 518 W Vaughan St | 0.19mi | 2/2.0 (-1) | 1,000 (-14%) | 17mo | $270,000 | $270 | 50 |
| 345 S Lampasas St | 0.34mi | 2/1.0 (-1) | 1,300 (+12%) | 13mo | $275,000 | $212 | 44 |
| 1540 W State Highway 29 Hwy | 0.70mi | 2/1.0 (-1) | 1,180 (+2%) | 18mo | $285,000 | $242 | 40 |
| 420 N Grange | 0.53mi | 2/1.0 (-1) | 1,098 (-5%) | 24mo | $245,000 | $223 | 38 |
Match score weights: distance 35% · size 25% · config 20% · recency 20%. Top-matched comps best support the ARV.
Projected returns pro-forma
-3.0% appreciation · 3.0% rent growth · sell at horizon
- IRR
- -26.2%
- Equity multiple
- 0.12×
- Total profit
- $-49,538
- Equity at exit
- $29,821
- IRR
- -22.9%
- Equity multiple
- -0.16×
- Total profit
- $-64,941
- Equity at exit
- $17,292
Cash invested: $56,000 (down + closing). Projections, not guarantees.
Landlord ↔ Tenant lean methodology
- Overall (STATE)
- 87 Strongly Landlord-Friendly
- State Texas
- 87 Strongly Landlord-Friendly · R+5
- County
- — inherits STATE
- City
- — inherits STATE
ZIP-level market 78605
- Home prices YoY
- -2.1%
- Active inventory
- 358
- Price-to-rent
- 10.8×
Monthly cashflow live
- Estimated rent
- $1,546 high interval (Pro) →
- Mortgage (P&I)
- −$1,049
- Tax from tax record
- −$359 /mo · $4,313/yr
- Insurance
- −$83
- HOA
- −$0
- Vacancy / Maint / Mgmt
- −$325
- Net cashflow
- $-270
Break-even live
Sensitivity live
| Price | -10% $-157 | -5% $-214 | +0% $-270 | +5% $-327 | +10% $-384 |
|---|---|---|---|---|---|
| Rent | -10% $-392 | -5% $-331 | +0% $-270 | +5% $-209 | +10% $-148 |
| Rate | -1.0pp $-170 | -0.5pp $-219 | base $-270 | +0.5pp $-322 | +1.0pp $-375 |
UW: 25.0% down · 7.5% · 30yr · 1.5% tax · 5.0% vac · 8.0% maint · 8.0% mgmt
Financing live
Cash to close
- Down payment
- $50,000
- Closing costs
- $6,000
- Reserves months
- —
- Total cash needed
- —
Loan-product check · same deal, 3 products live
Conventional
25% down · 7.5% · 30yr
- Down + closing
- —
- Monthly P&I
- —
- Monthly cashflow
- —
- DSCR
- —
- Eligible?
- —
Personal DTI + credit; lowest rate.
DSCR
20% down · 8.5% · 30yr
- Down + closing
- —
- Monthly P&I
- —
- Monthly cashflow
- —
- DSCR
- —
- Eligible?
- —
No personal income docs; deal must DSCR.
Hard money
10% down · 12.0% · 12mo
- Down + closing
- —
- Monthly P&I
- —
- Monthly cashflow
- —
- DSCR
- —
- Eligible?
- —
Short-term bridge; refi at stabilization.
Rent comps 5 comps
| Address | Beds | Baths | Sqft | Rent | $/sqft | DOM | Units | Dist |
|---|---|---|---|---|---|---|---|---|
| 750 Fallen Oak Dr Bertram, TX | 3.0 | 2.0 | 1174 | $1,595 | $1.36 | 45d | 1 | 0.16mi |
| 90 Huge Oak St Bertram, TX | 3.0 | 2.0 | 996 | $1,650 | $1.66 | 45d | 1 | 0.18mi |
| 440 W State Highway 29 Bertram, TX | 2.0 | 2.0 | 1300 | $1,300 | $1.00 | 3d | 1 | 0.25mi |
| 520 West St Bertram, TX | 3.0 | 2.0 | 1155 | $1,595 | $1.38 | 6d | 1 | 0.48mi |
| 104 Castleberry Ct Unit A Bertram, TX | 3.0 | 2.0 | 1401 | $1,525 | $1.09 | 16d | 1 | 0.91mi |
Listing history 11 events
-
2026-06-13statusdays on market $200,000 Pending 27 DOM
-
2026-06-09days on market $200,000 Active Under Contract 25 DOM
-
2026-06-08days on market $200,000 Active Under Contract 24 DOM
-
2026-06-07days on market $200,000 Active Under Contract 23 DOM
-
2026-06-04days on market $200,000 Active Under Contract 20 DOM
-
2026-06-03days on market $200,000 Active Under Contract 19 DOM
-
2026-06-02days on market $200,000 Active Under Contract 18 DOM
-
2026-06-01days on market $200,000 Active Under Contract 17 DOM
-
2026-05-31days on market $200,000 Active Under Contract 16 DOM
-
2026-05-11$200,000 Active
-
2003-07-07soldstatus
ⓘ Source: listings_history table (triggers on properties + properties_extension) + one-shot
backfill from property_details.listing_events for pre-trigger history.
Tax reassessment forecast TX · Resets to sale price
- Current annual tax
- $4,313 · $359/mo
- Projected year-2 tax
- $4,313 · $359/mo
- Expected delta
- $0/yr ($0/mo · 0.0%)
ⓘ Screening estimate from a state-policy table — verify with the county assessor before closing.
Climate risk First Street
- Flood 1/10 Low FEMA zone X (unshaded) · 0% chance over 30 yrs
- Wildfire 7/10 Severe
- Heat 7/10 Severe 7 d/yr ≥105°F today · 23 d/yr by 30 yrs out
- Wind 6/10 Major 61% chance of damaging wind over 30 yrs
- Air quality 1/10 Low 0 unhealthy d/yr today · 0 by 30 yrs out
Nearby sold comps map
Loading sold comps map…
Walkable amenities ~0.75 mi
Loading nearby amenities…
Taxation est. · year 1
- Rental income
- $18,550
- − Mortgage interest
- −$11,203
- − Property taxes
- −$4,313
- − Insurance
- −$1,000
- − Repairs & maintenance
- −$1,484
- − Management
- −$1,484
- − Depreciation
- −$5,818
- Taxable loss
- −$6,752
- Est. tax savings @ 24.0%
- +$1,621
- After-tax cash flow
- $-1,624/yr
For passive investors: Depreciation is non-cash, so a rental often shows a tax loss while cash-flowing — sheltering income. Rental losses are passive: they offset passive income freely, and up to $25,000/yr can offset ordinary (W-2) income if you actively participate and your MAGI is under $100k (phasing out to $0 by $150k); unused losses carry forward. On sale, claimed depreciation is recaptured at up to 25%, and gains may owe capital-gains tax (a 1031 exchange can defer both). Figures are a year-1 estimate at your 24.0% rate — not tax advice; consult a CPA.
Schools (NCES district)
- District
- Burnet CISD
- NCES district ID
- 4812220
- Math proficiency
- 36% ▼ -3.00%
- Reading proficiency
- 38% ▬ 0.00%
- Median HH income
- $50,890
- Composite
- 32.09/100
- National rank
- #5811
- State rank
- #465 of 826 in TX
Livability — Bertram
- Score
- 74/100
- State rank
- #170
- US rank
- #4466
Category grades
Schools grade is shown separately in the Schools card above.
Census & demographics
- Census place
- Bertram, TX
- Population (ZIP)
- 7,632
Population outlook (Burnet County) Hauer SSP2
- Today (2025)
- 50,492 people
- By 2030
- 52,995 · +5.0%
- By 2040
- 57,528 · +13.9%
- By 2050
- 61,444 · +21.7%
- By 2075
- 71,098 · +40.8%
- By 2100
- 74,634 · +47.8%
Race, ethnicity, and origin ACS 2023
- Neighborhood character
- Predominantly White (66%)
- Race & ethnicity
- White 66% Hispanic / Latino 27% Two or more races 19% Native American 2%
- Hispanic origin (detail)
- Mexican 23%
- Common ancestry
- Italian 5% Romanian 3% Serbian 2%
- Foreign-born
- 11% · Canada
- Languages at home
- 79% English-only · Spanish 20%
Political lean MEDSL · Burnet
- 2024 margin
- Solid R (+55.7) · D 21.7% · R 77.4%
- 2008→2024 swing
- -11.6pp toward R · 2008: -44.1pp · 2024: -55.7pp
- All cycles
- 2024: R+55.7 2020: R+53.1 2016: R+56.8 2012: R+54.6 2008: R+44.1
Not yet ingested
- Civics
- —
Market trends
- HPI YoY
- ▼ -6.46%
- Current HPI
- 296.8166
- Rent YoY
- —
- Metro
- —
- State GDP YoY
- ▲ 3.95%
- F500 in state
- 110
Industry mix (Fortune 500 HQ in TX)
| Industry | F500 HQs | Revenue |
|---|---|---|
| Energy | 16 | $1,198B |
|
||
| Technology | 5 | $198B |
|
||
| Engineering / Construction | 4 | $72B |
|
||
| Energy Services | 3 | $60B |
|
||
| Utilities | 3 | $41B |
|
||
| Healthcare | 2 | $330B |
|
||
Price history
-5.0% since first listed5 events — show timeline
- 2026-06-15 Sold (MLS) $190,000 CTXMLS
- 2026-06-11 Pending — CTXMLS
- 2026-05-28 Contingent — CTXMLS
- 2026-05-11 Listed $200,000 CTXMLS
- 2003-07-07 Sold (Public Records) — Public Records
Property tax history
+9.3%/yrLatest (2026): $4,313 · +32.5% YoY. Source: county tax records.
Cash-flow waterfall
monthlySold comps — $/sqft
last 12 mo · ≤1 miLoading sold comps…